Automated Development of Railway Signalling Control Tables: A Case Study from Serbia
Abstract:
The automation of railway signalling control table preparation, a task historically marked by labor-intensity and susceptibility to error, is critically examined in this study. Traditional manual methods of generating these tables not only demand extensive effort but also bear the risk of errors, potentially leading to severe consequences in subsequent project phases if overlooked. This research, therefore, underscores the imperative for automation in this domain. An extensive review of existing methodologies in the field forms the foundation of this investigation, culminating in the enhancement of a select approach with advanced automation capabilities. The outcome is a standardized procedure, adaptable with minimal modifications to the unique national signalling norms of various countries. This procedure promises to streamline project execution in railway signalling, reducing both time and error margins. Such a standardized, automated approach is particularly pertinent to the Republic of Serbia, where this study is situated, but its implications extend globally. Key technologies employed include AutoCAD and Mathematica, which facilitate the requirements-driven automation process. This research not only contributes to the academic discourse on railway signalling automation but also offers a practical blueprint for its implementation across diverse national contexts.1. Introduction
Railway signalling serves as a vital element in the safe and efficient operation of train networks. The development of signalling control (interlocking) tables is a crucial but often intricate process. These tables define the signalling logic necessary for managing signals, switches, and track section vacancies, integrating complex considerations of train positions, speeds, and potential route conflicts. For smaller stations, manual generation of these control tables is feasible. However, as the complexity of the station's topology increases, the task becomes exponentially more challenging and prone to errors.
Key challenges in control table preparation include:
-In stations with complex layouts, multiple routing variants between two signals may exist. This necessitates a thorough evaluation of potential routes, including scenarios where the station operator manually selects specific paths. It is not uncommon for initially designed control tables to be suboptimal from the end-users' perspective, necessitating late-stage modifications that lead to project delays.
-Ambiguities in interpreting certain signalling rules, such as those governing route protection (flank protection, dark signals, etc.), can lead to inaccuracies in the control tables. This further complicates the preparation process and emphasizes the need for clear, unambiguous rule definitions.
The introduction of automated methods for generating control tables in railway signalling systems marks a significant advancement in the field. Previous research has explored various formal tools for this purpose, including EURIS [1], Ladder logic [2], Petri Nets (PN) [3], [4], RailML [5], Controlled Natural Language (CNL) [6], Maple [7], B-method, Gröbner Bases (GB), Abstract State Machines (ASM), and Finite State Machines (FSM). These studies typically required the manual preparation of the railway station's topological layout using specialized input tools before generating the control table. A notable progression in this area is evident in the studies referenced as [8], [9], [10]. These papers introduced methods where the topology of a railway station is generated within a dedicated graphical editor. This innovation allows users to define the railway topology simply by drawing it in the user interface, thereby incorporating a degree of automation in the control table generation process.
This paper contributes to this evolving field by presenting a methodology for generating station control tables in the Republic of Serbia using the MATHEMATICA$^\circledR$ package directly from the AutoCAD station signalling layout. Traditionally, the AutoCAD layout serves as the initial step in designing a railway signalling system for specific stations. The proposed approach enables designers who primarily use AutoCAD for signalling design to further automate the control table generation process. This eliminates the need for the dedicated graphical tools assumed necessary in the aforementioned studies [8], [9], [10], thus streamlining the process and potentially reducing the time and effort required for accurate control table generation.
2. Methodology
The methodology outlined in this paper is predicated on several key assumptions, which are crucial for the effective application of the proposed approach to generate control tables for railway signalling. These assumptions are as follows:
-The station signalling layout containing only lines has been already prepared in the AutoCAD (.dwg format) and then converted to .dxf format;
-The station contains only the main signals (no shunting signals installed);
-There are no double diamond switches in the station area;
-There are no level crossings in the station area.
A general algorithm showing the whole process is elaborated in Figure 1.

The innovative algorithm proposed in this paper harnesses the versatile and powerful capabilities of MATHEMATICA for automating the generation of control tables in railway signalling. This method revolves around the construction and nuanced analysis of a graph model, meticulously drawn from the station's signalling layout within MATHEMATICA. The essence of the approach lies in the identification of key components in the graph model, namely vertices, edges, and edge labels, and effectively mapping these elements to their respective counterparts in the railway signalling system: vertices $\rightarrow$ sections, edges $\rightarrow$ tracks, and edge labels $\rightarrow$ signals in the route.
MATHEMATICA was chosen for its extensive suite of built-in functions adept at creating, manipulating, and visualizing complex graphs, as well as its incorporation of highly efficient algorithms for detailed graph analysis. Its ability to optimize operations such as finding the shortest paths, computing connectivity, or identifying critical graph properties, is invaluable, particularly when dealing with expansive and intricate graph models that mirror complex railway station layouts. The environment of MATHEMATICA ensures not only rapid processing but also the precision of results, which is paramount in the development of accurate control tables that are essential for the safety and efficiency of railway operations.
The AutoCAD signalling layout of a railway station, which is central to the methodology described in this paper, is illustrated in Figure 2.
As depicted in the previous figure, the railway station's signalling system comprises various essential elements, which are systematically catalogued in Table 1.
Element | Explanation |
|---|---|
 | Station main signal (entry or exit) |
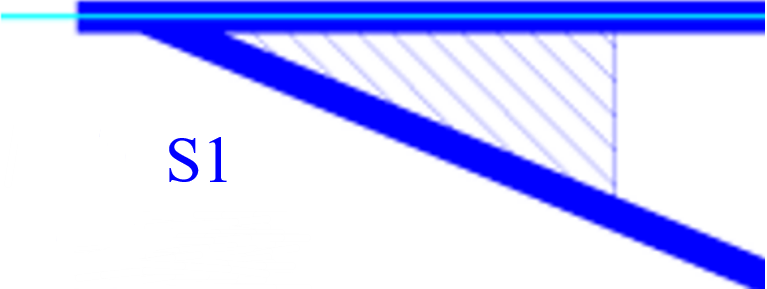 | Station switch (left or right) |
 | Station insulated section (for switch or track) |
 | Track section |
According to regulation [11], the aspects of the main signals in the railway signalling system are comprehensively detailed in Table 2.
Aspect No. | Display | Meaning |
|---|---|---|
4 | 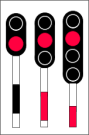 | Unconditional stop |
5a |  | Free passage |
6 | 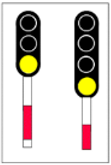 | Caution: the next signal shows the stop aspect |
7 |  | Free passage, expect speed limit aspect on the next signal |
8 |  | Speed limit: expect the stop aspect on the next signal |
9 |  | Speed limit: expect free or caution aspect on the next signal |
10 |  | Speed limit: expect the speed limit aspect on the next signal |
12a |  | Cautious entry into the station with speed 10km/h |
A snippet of code in MATHEMATICA, which converts the .dxf file to the corresponding graph, is shown in Figure 3.
3. Results
The comprehensive implementation of signalling rules, particularly those concerning the routes between main signals, forms a crucial part of this study. These rules encompass various parameters such as conditions for setting, locking, flank protection, and release of signals. A detailed exposition of these rules is available in reference [12]. Given the intricate nature of this subject matter, Table 3 provides a succinct overview of the basic route requirements as stipulated in the referenced document.
Route Requirement ID | Description |
|---|---|
L1_SYS_ZE101 | Train routes shall be settable: -from a main entry signal in the station to a main exit signal in the station (with overlap); -from a main signal in the station (entry or exit signal) to the open line (without overlap); -from entry signal to the limit track signal (with overlap). |
L1_SYS_ZE12 | Train routes must be settable individually or as a sequence, where main signals serve as both start and destination points in the route sequence. |
L1_SYS_ZE13 | Sequencing of train routes is allowed only if each individual route in the sequence is permitted. |
L1_SYS_ZE18 | Train routes require flank protection in both the route and overlap. |
L1_SYS_ZE21 | For points in the overlap, the overlap position is selectable. |
L1_SYS_ZE22 | All points (derailers) on the route and overlap require individual and automatic locking as dictated by the set route. |
L1_SYS_ZE23 | Overlaps are not settable individually. |
L1_SYS_ZE25 | Setting an exit route over an existing overlap is prohibited, except on the same track. |
L1_SYS_ZE28 | Route setting is allowed only if both the route and overlap are settable. |
L1_SYS_ZE36 | Signals in train routes should be activated sequentially from the destination to the start signal. |
L1_SYS_ZE43 | Route setting is prohibited if any part of the route is required for another route. |
L1_SYS_ZE45 | Route setting is prohibited if any track section or point in the route is blocked by the "block" command. |
L1_SYS_ZE46 | Route setting is prohibited if any flank protection element is blocked by the "block" command. |
L1_SYS_ZE48 | Using an overlap for a route is allowed if the route and overlap facilitate the same movement. |
L1_SYS_ZE49 | Points in a route should not be in demand as flank protection elements for another route if they are opposite to the position required by the route. |
L1_SYS_ ZE50_1 | Route setting is prohibited if any point within the route is occupied. |
L1_SYS_ZE55 | Setting a route over derailers is prohibited. |
L1_SYS_ZE70Z | Points in an overlap should not be in demand as flank protection for another route in a position opposite to that required by the overlap. |
L1_SYS_ZE82 | Elements providing flank protection include points, derailers, main signals, and track limit signals. |
L1_SYS_ZU16 | For signals in the route: (1) Stop aspect is required for movements in the opposite direction. (2) Flank protection signals must show a stop aspect. (3) Opposite signals must show a stop aspect if routes protected by them overlap. (4) Opposite signals cannot be dark if at least one route protected by them does not overlap with the route. |
L1_SYS_ZU17 | Intermediate signals in the direction of movement should indicate a proceed aspect. |
L1_SYS_ZU36_2 | The start signal cannot show a proceed aspect if the destination signal is dark. |
L1_SYS_ZU57_1 | For signals located within the overlap and aligned with the direction of movement, it is imperative that they remain illuminated (i.e., not dark). |
L1_SYS_ZU75 | Sections between the route, overlap, and flank protection elements must be clear. |
L1_SYS_ZS03 | If the destination signal is dark, there will be no proceed aspect on the start signal and all intermediate signals on the route. |
L1_SYS_ZS22 | All signals in the route must show a stop aspect if flank protection conditions are not met. |
L1_SYS_AW04 | A route part is actively released if: (1) Cleared by the last axle. (2) The subsequent section is occupied (not due to a fault). (3) Occupied by a train (not due to a fault) since route setting. (4) The preceding part of the route has been released. |
L1_SYS_AW05 | The route is released by train movement one section at a time. |
L1_SYS_AW06 | Release of train route must begin at the start of the route. |
L1_SYS_AW08 | A destination section in the route can be released by train movement under specific conditions, even if it deviates from active release requirements. |
L1_SYS_AD04 | Overlap release occurs when: (1) The train completely enters the destination track. (2) Configured delay time expires. (3) All sections in the overlap are clear. |
L1_SYS_AD06 | Overlap release delay (90s) stops if a train occupies the overlap without a continually signaled route. Otherwise, it activates with the last axle's arrival to the destination track. |
L1_SYS_AF01 | Flank protection release for a demanding element occurs when the demand is canceled, which should happen as soon as the need for protection ceases (e.g., after route or overlap release). |
Building upon the foundational research detailed in references [8], [9], [10], this paper adopts a structured approach to graph representation within the MATHEMATICA environment. In this model, the nodes of the graph are designated to represent distinct sections of the railway station, while the edges of the graph correspond to the tracks connecting these sections. Additionally, the labels on the graph edges are assigned to represent the appropriate signals governing the train movement along these tracks.
Further refining this graph representation involved transforming the initial undirected graph, as delineated in section 2, into two directed graphs. This transformation is critical for accurately depicting the directionality of train routes. Consequently, the resultant directed station graphs, as illustrated in Figure 4 and Figure 5, represent train routes in specific directions: Figure 4 for routes traveling from left to right, and Figure 5 for routes traveling from right to left.
The process of route determination within the graph topology is a critical aspect of the control table generation methodology. It involves identifying all viable paths in the graph that start and end with a signal, representing the starting and destination points of a train route. Each row in the control table is then formulated to encapsulate the necessary conditions for setting a specific route in the railway station's signalling system.
A key aspect of this analysis is the treatment of each edge within the graph as a simple railway track section. However, a notable exception arises in scenarios where three edges converge at a single node, which is then identified as a switch point. The accurate detection and handling of such switch points pose a significant challenge in the route determination process. To address this, the orientation of the switch is determined based on the related track sections. Subsequently, the user is required to confirm the positions for each switch, a “+” signifying a straight route over the switch, and a “-” indicating a turnout route.
The methodology employed for detecting station switches in MATHEMATICA is not only intricate but also crucial for the accuracy of the route determination process. This is encapsulated in the pseudocode presented in Figure 6. This pseudocode provides a systematic approach to identify switch points within the station layout, ensuring that each route is accurately represented in the control table.
The route definition process is meticulously structured and hinges on the graph topology derived from the station layout. Routes are delineated between the entrance railway track section and the station tracks for entry routes, or between a station track and an exit railway track section for exit routes. This is achieved by utilizing the tags on the graph edges, which correspond to the relevant signals. In doing so, the methodology accurately identifies all track sections that comprise a route, including their sequential arrangement. Additionally, it determines the related switch points, along with essential information regarding their positions.
The determination of signal aspects is closely tied to the possible routes in the station topology. For instance, if a turnout is present in the route ahead of a signal, a flashing aspect (as detailed in options 7, 8, 9, or 10 from Table 2) is assigned to that signal. Conversely, in cases where the route proceeds in a straight direction, a steady signal aspect (options 5a or 6 from Table 2) is identified. This distinction is crucial for ensuring the accuracy and safety of signal operations within the station.
To implement this route determination process in MATHEMATICA, general graph searching algorithms, akin to those discussed in references [13], [14], [15], [16], [17], were employed. These algorithms are integral to navigating and analyzing the complex graph representations of station layouts.
Building upon the core graph theory functionalities of MATHEMATICA, as outlined in references [18], [19], [20], and aligning them with the signalling rules presented in Table 3, a specialized notebook was developed. This notebook serves as a dedicated tool for the determination of train routes within the station, incorporating the intricate signalling rules into the graph-based analysis. The general steps for generating routes in MATHEMATICA, encapsulating this comprehensive approach, are outlined in the pseudocode displayed in Figure 7.
The output of the route determination process, as applied to the station layout for train routes traveling from left to right, is systematically presented in Table 4.
| Route Start | Route End | Switches + Position | Switches - Position | Sections | Aspect-Start Signal | Aspect-End Signal |
|---|---|---|---|---|---|---|
| Ju92 | Ko1 | S2 S3 | S5 | OK1 OS2 OS3 OS5 OuJ2 | 8 | 4 |
| Ju92 | Ko2 | S2 S3 S5 | 0 | OK2 OS2 OS3 OS5 OuJ2 | 6 | 4 |
| Ju92 | Ko3 | S2 S4 S6 | S3 | OK3 OS2 OS3 OS4 OS6 OuJ2 | 8 | 4 |
| Ju92 | Ko4 | S2 S6 | S3 S4 | OK4 OS2 OS3 OS4 OS6 OuJ2 | 8 | 4 |
| Ju94 | Ko1 | S3 | S1 S2 S5 | OK1 OS1 OS2 OS3 OS5 OuJ4 | 8 | 4 |
| Ju94 | Ko2 | S2 S3 S5 | S1 | OK2 OS1 OS2 OS3 OS5 OuJ4 | 6 | 4 |
| Ju94 | Ko3 | S1 S4 S6 | 0 | OK3 OK3b OS1 OS4 OS6 OuJ4 | 8 | 4 |
| Ju94 | Ko4 | S1 S4 | S6 S7 | OK3b OK4 OS1 OS4 OS6 OuJ4 | 8 | 4 |
The results obtained from the automated process of generating control tables in MATHEMATICA were subjected to manual verification and were found to be completely accurate. This outcome underscores a crucial advantage of automation: the significant reduction, or even elimination, of human error, which is often a risk factor in manual processes. The use of automated tools in railway signalling design and implementation not only enhances precision but also bolsters the reliability of control tables.
4. Discussion
The results of this study highlight two main achievements that underscore the significance of automating the generation process of control tables in railway signalling:
-Efficiency and Error Reduction: Automation significantly shortens the duration of the overall project while concurrently minimizing the number of potential errors in the control table. This efficiency gain is contingent upon the accurate and unambiguous translation of specific signalling rules into the graph search algorithms used in the automation process. By streamlining the generation of control tables through automation, the time and resources invested in railway signalling projects can be considerably reduced, leading to more efficient project execution.
-Adaptability to Network Changes: Railway networks are inherently dynamic, often undergoing updates and modifications such as the addition of new switches or tracks. The automated processes showcased in this study excel in adapting to these changes. This adaptability ensures that control tables are always current, accurately reflecting the latest configuration of the railway network. The ability to quickly and accurately update control tables in response to changes in the network is a significant advantage, enhancing the responsiveness and reliability of railway operations.
Additionally, it's important to note the versatility of the proposed graphical representation of the results. The methodology allows for customization according to the specific requirements of different end users. The output does not need to be confined to a tabular form; it can also be translated into other formats such as specific software code or ladder diagrams. This flexibility in representation means that the results can be tailored to fit various applications and user preferences, further extending the utility and applicability of the automated process in diverse railway signalling contexts.
5. Conclusions
The traditional approach to preparing railway signalling control tables, integral to configuring signals and routes within a station, has historically been a meticulous and time-consuming task. The introduction of automation into this process marks a transformative advancement in the railway industry. The primary aim of this paper was to present a novel automated technique for generating railway signalling control tables, expanding upon existing methodologies found in the literature. This expansion involved a significant innovation: acquiring the station layout directly from an AutoCAD drawing, rather than relying on manual preparation in a dedicated editing tool.
The use of MATHEMATICA, a comprehensive computational software system, is central to this innovation. Its symbolic computation capabilities, combined with a broad spectrum of built-in functions, render it highly effective for managing complex mathematical operations and simplifying the coding of signalling logic. Furthermore, MATHEMATICA's advanced visualization tools enable users to create both informative and visually appealing representations of graphs and control tables. This graphical representation not only enhances the comprehension of signalling logic but also aids in easier troubleshooting and maintenance of the system.
A MATHEMATICA notebook developed as part of this research serves as a solid foundation for further automation and validation of railway signalling control tables. Future work is planned to integrate additional route conditions, such as the definition and generation of overlap and flank protection elements, which will be addressed in subsequent publications.
The potential for further enhancement of this tool lies in leveraging Natural Language Processing (NLP) and Large Language Models (LLM), particularly with the ongoing advancements in Artificial Intelligence (AI). One promising avenue is the integration of the Wolfram Language plugin for ChatGPT [19], combining the powerful capabilities of both platforms.
In conclusion, automating the preparation of railway signalling control tables not only streamlines the process but also results in significant long-term cost savings. By reducing manual labor and minimizing errors, it allows for more efficient resource utilization. This shift enables railway operators and infrastructure managers to reallocate personnel towards more strategic initiatives, thereby enhancing the overall cost-effectiveness and operational efficiency of control systems.
The data supporting the research results are included within the article or supplementary material.
The author wants to thank the authors of the papers [8], [9], [10] for their initial contribution and guidelines to this exciting topic, which served as a basis for the preparation of this paper.
The author declares no conflict of interest.