Stacked Extreme Learning Machine with Horse Herd Optimization: A Methodology for Traffic Sign Recognition in Advanced Driver Assistance Systems
Abstract:
In the quest for autonomous vehicle safety and road infrastructure management, traffic sign recognition (TSR) remains paramount. Recent advancements in accuracy across various benchmarks have been identified in the literature concerning this essential task. Such technology might remain absent in older vehicles, while integration into Advanced Driver Assistance Systems (ADAS) is common in more recent models. Yet, the capability of these systems to function proficiently under diverse driving conditions has not been widely investigated. A framework has been devised to allow a moving vehicle to detect traffic signs, targeting the enhancement of driver safety and the diminishment of accidents. The present research introduces an innovative methodology, amalgamating the extreme learning machine (ELM) method with deep-learning paradigms, in response to experimental discoveries. As a pioneering computational approach in neural network-based learning, ELM facilitates rapid training and commendable generalization. An accuracy of 95.00% was achieved by the proposed model. By utilizing the Horse Herd Optimization method (HHOA), the memory consumption is minimized in the more sophisticated approach of stacked ELM (SELM) within the deep-learning framework. This study contributes to the understanding of potential challenges that may be encountered during TSR tasks, and lays the groundwork for future investigation by proffering a diverse set of evaluations for various road scenarios. Consistency in the utilization of professional terms is maintained throughout.
1. Introduction
The advent of technology has heralded the incorporation of safety-enhancing driving aids that form the backbone of autonomous vehicles and ADAS [1]. Developed to facilitate rapid and accurate response to potentially hazardous traffic scenarios, these systems have become a crucial aspect of automotive safety and comfort, thus warranting considerable scholarly interest and development [2]. A diverse array of technologies contributes to the development of ADAS systems, among which camera-based solutions are notable for their cost-effectiveness, facilitated by the evolution of computer vision technology [3], [4].
As population increments, so does the number of vehicles, leading to a proportional rise in accidents and fatalities. The increasing risks are further amplified by factors such as fatigue, poor driving conditions, and distractions, necessitating the development of solutions aimed at minimizing traffic accidents and bolstering driver safety [5].
ADAS critically rely on external environment sensing, which involves data collection from extravehicular sources including vehicles, pedestrians, and traffic signals [6]. However, the efficiency of environmental perception can be hindered by external variables like weather, traffic volume, and lighting conditions [7]. Thus, when devising ADAS systems, these potential confounders should be taken into account. Increasing vehicular volume escalates the potential for accidents and fatalities, a threat that can be effectively mitigated by ADAS and autonomous driving systems [8]. Harnessing computer vision technology, camera-based solutions offer financial feasibility and superior image analysis capabilities [9]. However, designing ADAS systems requires careful consideration of environmental variables such as weather, road conditions, and lighting.
TSR systems, an essential feature of intelligent vehicles, include two critical phases: detection and categorization of road signs [10]. Despite advancements in these systems, they exhibit several drawbacks. The lack of studies evaluating the efficiency of deep learning-based TSR in real-world noisy urban settings is conspicuous [11]. Given the considerable discrepancies in benchmark images and actual urban scenes, it becomes imperative to evaluate the types of noise and validate the recognition outcomes [12]. Moreover, TSR schemes rarely incorporate object-tracking models in conjunction with detection models [13]. Lastly, the performance of deep learning-based models in vehicles equipped with smart cameras needs further improvement [14], [15].
Addressing these issues, the current study presents a framework for TSR complete with a testbed for validating the system's accuracy and latency [16]. A computing unit and server were installed in a vehicle to allow the system to recognize traffic signs in real-world conditions. Different types of noise were identified in urban road environments, and road images were clustered based on their corresponding conditions. Subsequent analysis and iterations of object detection models led to accuracy and latency evaluations under various environmental scenarios. This comprehensive approach aids in unearthing potential challenges in traffic sign identification tasks, setting the stage for future studies.
The significant findings from this study include:
•A novel TSR framework, which leverages the benefits of the ELM within a deep learning-based object detection model, the SELM [1].
•An enhanced memory usage via SELM, achieved by dividing a large neural network into smaller, serially computed ones, which increases learning accuracy [2].
•Empirical evidence for the effectiveness of deep learning-based tracking models in diverse environments [3].
•A comprehensive analysis to guide future research on TSR schemes [4].
This study is structured as follows: Section 2 provides a review of existing models; Section 3 offers a succinct explanation of the proposed work; Section 4 presents a discussion of the validation analysis. The final results and suggestions for future research are discussed in Sections 5 and 6, respectively.
2. Related Works
With the expansion of urban populations and the subsequent increase in vehicular traffic, a rise in traffic accidents and fatalities has been observed. Factors such as driver fatigue and deteriorating road conditions have contributed to this trend. In response, significant efforts have been made to develop ADAS and autonomous vehicles, aiming to alleviate these issues.
Camera-based ADAS devices, made practical and more affordable by advancements in computer vision, have been increasingly deployed. Through object recognition, lane detection, and traffic sign identification, these systems offer enhanced decision-making and timely warnings. A 360-degree view of the road is provided by these systems, improving the driver's perception of the surroundings. As a result, an elevation in safety standards and driving experience has been recorded.
TSR is a critical component of intelligent transportation systems, and research in this field has witnessed a progression of methodologies with distinctive contributions.
Triki et al. [17] initiated a trend by combining the Haar cascade method with a deep Convolutional Neural Network (CNN) classifier, achieving an accuracy of 98.56% on the GTSRB dataset. This milestone laid a solid foundation for further exploration, particularly regarding enhanced classifiers in TSR. The attention-based deep CNN subsequently proposed, boasting superior testing rates of 99.91% and 99%, sparked interest in more focused detection methods.
Following this path, Torres et al. [18] addressed the identification accuracy issue by proposing a combination of edge detection filters and fuzzy inference systems. The approach emphasized the importance of pre-processing layers and demonstrated competitive results. The continuity of this method from Triki's foundation illustrates the growing complexity and refinement in TSR.
Integrating this notion of complexity, Chung et al. [19] introduced a paradigm shift by employing the YOLO v5 construction with an attentional deconvolution detector (FSADD). Recognizing the limitations of previous detection methods, this novel approach provided an accuracy of 73.9%, bridging the gap between conventional techniques and cutting-edge standards.
In a response to the challenge of efficiency, Khan et al. [20] leveraged the advancements made by Chung and others by designing a lightweight neural network. Achieving accuracy rates of 98.41% and 92.06%, this approach offered a streamlined yet effective method, reflecting a move towards optimal performance with reduced complexity. Building on the need for broader application, Yan et al. [21] extensively explored the integration of TSR in traffic management. The Graph Cooperation model with self-attention mechanisms unveiled new horizons in traffic signal control. This progression not only aligned with the previous research but also opened doors to holistic traffic management solutions.
Enhancing this direction, Liu et al. [22] iImplemented the teacher-student structure to guide the student agent, adding a novel dimension to RL-based traffic signal control strategies. This inventive method provided a seamless transition from Yan's cooperative models, portraying an evolving landscape in intelligent traffic control.
Concluding the trajectory, Gu and Si [23] consolidated previous insights to craft a YOLO-based system for real-time TSR. By optimizing latency and enabling applicability in constrained hardware, this work epitomized the culmination of ongoing efforts in TSR, reflecting adaptability and resource-efficiency.
Through the methodological progression outlined above, it is evident that the field of TSR has undergone a significant evolution, characterized by innovation, specialization, and integration into broader traffic management contexts. The collective body of work presented here not only portrays individual advancements but also illustrates a coherent narrative of growth and development in TSR.
Despite significant progress, certain challenges remain in the TSR systems. Key issues include:
•Robustness: Existing systems suffer from a lack of reliability, especially in handling varying illumination, weather, and occlusions. This lack of robustness has been observed under different illumination conditions.
•Scalability: Current technologies often face difficulties in scalability, particularly when adapting to new conditions or expanding datasets.
•Interpretability: A general lack of transparency in decision-making within current TSR technologies hampers efforts to debug and optimize systems, which could potentially erode trust in their reliability.
3. Proposed System
The proper function of road traffic signals offers substantial benefits to vehicles, drivers, passengers, and property. Within the Indian context, road signage can be classified into three principal categories:
(a) Mandatory or Regulatory Symbols: Compliance with these signs is required by law, with legal consequences for non-adherence.
(b) Cautionary Warning Symbols: These signs serve to alert drivers to impending hazards, construction activities, or accidents.
(c) Informatory Symbols: These signs facilitate travel by providing guidance on direction, nearby facilities such as restaurants, motels, rest stops, and petrol stations, etc.
In this study, a custom dataset is utilized, comprising 6480 images and 7056 instances of traffic signs, subdivided into 100 categories. Thirteen out of the 100 categories pertain to traffic signs, derived from authoritative sources such as the Deutsche Forschungsgemeinschaft (DFG) dataset, exhibiting similarity to their Indian counterparts. The remaining 1936 images were procured from public domain websites.
Of the total images, 4544 were sourced from real-world scenarios and classified into 87 traffic sign categories. Resolution variation was noted, with over 70% of the images being of higher resolution (4128 × 2322 pixels, 774 × 1032 pixels, 960 × 1280 pixels), and the remaining 29% of lower resolution (225 × 225 pixels, 200 × 200 pixels). Furthermore, 200 images contain two occurrences of a traffic sign, 40 with three, and 32 with four. Visibility was predominantly clear at 97%, with a minor 3% exhibiting reduced visibility. Figure 1 [24] offers examples from the custom dataset.
Images within the custom dataset were categorized into two classes, one featuring signs exceeding 30 pixels in resolution and the other exceeding 50 pixels. Exceptional cases, such as multiple occurrences of the same sign in a photograph, were consistently excluded in both training and testing stages.
The predominance of traffic signs was observed to exceed 30 pixels. The adopted model in this research employs the standard test split ratio of 80:20, thereby ensuring a minimum of 6 images in each category. Separation of the datasets into training and testing sets was carried out arbitrarily, resulting in 5664 images designated for the training dataset and 1412 for the testing phase.
By offering a comprehensive view of the dataset, including the categorization and characteristics of the images, this section establishes the foundation for the proposed system. This dataset description aligns with the broader focus on Indian road traffic signal categories, reflecting the complexity and diversity of real-world scenarios.

The process for sign identification and recognition within the proposed system necessitates three primary pre-processing stages: shape detection, region of interest (ROI) determination, and color probability analysis.
•Shape Detection: The commencement of pre-processing focuses on isolating the geometrical characteristics from captured video scenes. Color images are initially converted to black and white, allowing for the determination of contour values through an OpenCV-derived contour detection algorithm. Subsequent computation of the area, based on these values and user-defined threshold values, facilitates the detection of the traffic sign's shape in accordance with the counter's area. The resultant images are then conveyed to the ROI component.
•ROI: The determination of the ROI is instrumental in precisely locating the traffic sign within an image. Triangles, rectangles, and circles, which commonly depict traffic signs in India, can be identified as the ROI by the proposed model. Anomalies within an image, such as a larger area, can prolong the estimation time or render the predictions inaccurate. Three distinct algorithms are employed to locate the ROI within an image. In instances where the ROI is circular, the Hough Circle program is used to identify triangles and squares. Various algorithms cater to the finding of edges and contours, with unique ROI calculations and coloring codes specific to each shape (circle, rectangle, triangle). Images are extracted from the ROI without distortion by cropping them with a 5% threshold, and subsequent colorization precedes the transition to the color probability stage.
•Color Probability: This stage entails the creation of a novel dataset, comprising the RGB values for each pixel in the sample image. Visibility testing under diverse lighting conditions, including bright sunlight, diffused sunlight, and complete darkness, serves to determine the range of RGB pixel values. A real-range derived from the image collection is used to compute the percentage of pixels that are red, black, and white. A counter corresponding to red, black, or white is incremented based on the pixel range. Analysis of the dataset reveals variations in RGB pixel counts between images captured with and without direct sunlight. Post color probability, the image is relayed to the model, with a cutoff value ascertained from the training dataset. The range for each color is computed and applied during color probability, considering additional images from the dataset. The total number of RGB pixels is obtained as follows:
For the context of this study, the cutoffs for the respective colors red (12%), white (15%), and black (9%) were ascertained using this method.
The described pre-processing stages contribute significantly to the accuracy of the proposed system's sign identification and recognition. By incorporating a systematic approach that addresses shape, region of interest, and color probability, this methodology aligns with the complexities of traffic sign detection and ensures a robust foundation for subsequent analysis.
The utilization of the SELM within the proposed methodology hinges upon the integration of a single-layer feedforward network (SLFN) with a deep learning model, a combination that divides an extensive ELM Neural Network (NN) into manageable segments through the stacking of smaller ELMs. A detailed description of this methodology is presented below:
•Single-Layer Feedforward Network (SLFN): In this network with only one hidden layer containing $L$ hidden neurons, the $j$ th (where $1\leq j \leq L$) hidden layer node's input $W_j$ weights and biases $b_j$ are generated randomly. With $N$ samples utilized for training, denoted by $\left\{\left(x_i, t_i\right) \mid x_i \in R ^q, t_i \in R^n\right\}_{i=1}^N$, and the activation function $g(.)$, the output weight vector SLFN is computed using Eq. (2) [25]:
where, $H$ signifies the hidden layer output matrix, and $T=\left[\left[t_i\right]_{i=1}^N\right]^{\top}$ represents the target matrix.
•SELM Framework: The architecture of SELM, inspired by deep learning models, is constructed through a layered ELM with a multilayer NN, as described by Zhou et al. [26]. This division is achieved by introducing a novel ELM architecture in the first layer, wherein all hidden layer neurons' parameters are randomly generated. In the subsequent layers, some parameters are propagated after being scaled down, thus constraining the extent to which the remaining parameters are randomly generated. Following the training of one layer, the data input to that layer is relayed to the next, culminating in the final layer. Thus, the multilayer ELM structure constitutes the deep learning model.
The first-layer optimization problem can be formulated as [25]:
where, $\beta_1$ denotes the first layer's output weight vector, and $C$ signifies the norm of the training error at the output's cost. The optimal value for $\beta_1$ is subsequently obtained as:
where, $H_1=\left[g\left(w_j^{(1)}\right)^{\top} x_i+b_j^{(1)}\right]_{i=1, \ldots, N ; j=1, \ldots, L}$, $W_1=\left[w_j^{(1)}\right]_{j=1}^L$ and $b_1=\left[b_j^{(1)}\right]_{j=1}^L$ respectively.
•Dimension Reduction and Layer Construction: To manage the potential duplication of data stored in the neurons of the initial hidden layer, the dimensionality can be reduced from $L$ to a lower level $Z$, where $L>1$. This reduction is achieved via the PCA method, leading to a new matrix $U_r \in R^{L \times l}$, which pertains to the eigenvalues. The subsequent expressions for the reduced output matrix from the hidden layer are given by:
The construction of the next layer involves the creation of exactly $L – I$ hidden neurons at random, and a new $H$ is determined after the number of hidden neurons is reduced to $I$:
By applying Eq. (4) in this layer, and iteratively employing the previously described reduction techniques, the dimension reduction process can be circumvented, leading directly to the final output:
where, $\beta$ represents the final accumulated value vector from all layers. In this context, the Harmony Search Optimization (HSO) model is employed to ascertain the optimal weight value for SELM.
The incorporation of the SELM classification method is integral to the proposed methodology, offering a robust and scalable approach to the categorization of data. Through the structured layering of ELMs and the sophisticated handling of dimensions, the SELM achieves a nuanced analysis that aligns with the complexity of the problem domain.
The HHOA algorithm, a sophisticated swarm-based optimization method, was devised by MiarNaeimi et al. [27], reflecting the herding instinct observed in horses. Within the paradigm of HHOA, the social behavior of horses is classified into six discrete types, denoted as $G$, $H$, $S$, $I$, $D$, and $R$, each corresponding to varying age classifications of the horse.
The optimization process commences with the configuration and initialization of control parameters, a common practice with most metaheuristic algorithms, including the maximal sum of size. Figure 2 provides a schematic representation of the flow of the HHOA algorithm.
Eq. (9) is utilized for the iterative update of horse positions, characterized as follows:
In this expression, $X_m^{t, A G E}$ symbolizes the updated location of the $m$th horse at iteration $t$, with AGE being the specific age category. Conversely, $X_m^{(t-1), A G E}$ signifies the previous location of the $m$th horse, while $\vec{V}_m^{t, A G E}$ denotes the $m$th horse's velocity vector, evaluated in context with the horse's age.
The population of horses is categorized into four distinct age groups:
•Horses aged 0-5 years are classified as $\delta$.
•Those aged 5-10 years are referred to as $\gamma$.
•Horses within the range of 10-15 years are categorized as $\beta$.
•Those aged over 15 years are defined as $\alpha$.
Notably, the fitness values of the swarm's horses are an essential parameter in the model. The following methodology is applied to the iterative selection of horse ages: the uppermost 10% of the sorted population is selected as $\alpha$, and the succeeding 20% is classified as $\beta$. The subsequent 30% is grouped as $\gamma$, and the remaining 40% as $\delta$.
Subsequent sections will provide a detailed exposition of the six fundamental elements of effective social interaction that form the basis of this optimization method.
A. Grazing
In the context of the HHOA algorithm, the process of grazing is vital, and it is intricately associated with the horses' fitness values within the swarm [27]. A detailed examination of this process reveals an essential hierarchical structure.
The swarm's horses are ranked from best to worst based on their fitness values. An iterative selection process is applied to classify the horses into age categories. Specifically, the top 10% of the sorted population are categorized as $\alpha$, followed by the next 20% as $\beta$. Horses falling into the $\gamma$ age category constitute the following 30%, and the remaining 40% are assigned to the $\delta$ category.
This hierarchical classification influences the computation of the age-specific velocity vector for each horse, defined by the following equations:
where, $\vec{G}_m^{t, A G E}$ symbolizes the propensity to graze at the tenth iteration of the $m$th horse's grazing motion parameter. The parameter is reduced linearly at each iterative loop, in accordance with a reduction factor denoted by $\omega_{\mathrm{g}}$. The terms $\breve{l}$ and $\breve{u}$ signify two levels of grazing available, and in the cited work [27], $p$ is a random value between 0 and 1, with $u$ being given a value of 1.05. Eq. (15) serves to update the value of $\vec{g}_m^{t, A G E}$. The search initiates with a constant $g$ set to 1.5 for the entire age range of horses.
B. Hierarchy
The intricate structure of hierarchy within the swarm of horses in the HHOA algorithm can be elucidated as follows. Within the population, a dichotomy between leaders and followers is recognized. This division into “follower horses” and leaders is integral to the dynamics of the swarm, and a specific coefficient, denoted by $h$, defines the extent to which horses are influenced by the leader possessing the greatest experience and strength.
The hierarchical relationship is encapsulated by the following equations:
where, $\vec{H}_m^{t, A G E}$ represents the hierarchy at iteration $t$ for the $m$th horse, illuminating how the velocity parameter is influenced by the optimal horse placement. The optimal position is designated by $X_{\text {best }}^{(t-1)}$ at iteration $\mathrm{t}-1$. A factor of linear reduction symbolized by $\omega_h$ is utilized to achieve this effect. The search procedure is initiated with distinct values of the $h$ coefficient, namely 0.5 for age $\alpha$, 0.9 for age $\beta$, and various values for horses of age $\gamma$.
The hierarchy's embodiment in these mathematical formulations serves to highlight the adaptive nature of the swarm, ensuring that the influence of the leader on the followers is precisely calibrated. This adaptation ensures that the search space is explored efficiently, guided by the leader but also allowing for individual variation among the followers. Consequently, the inclusion of hierarchy within the model adds depth and complexity to the understanding of how social interactions are simulated in the HHOA, offering insights into how these mechanisms may be translated into more efficient optimization strategies.
C. Sociability
The group dynamics of horses, mirroring the behavior of numerous other social animals, offer a compelling example of collaborative survival strategies. This cohesiveness, defined by cooperative defense and enhanced escape capability, is encapsulated in the HHOA algorithm through the coefficient s, representing the sociability factor. This factor is characterized by a systematic movement towards the mean position of the horses in the swarm and can be mathematically expressed as:
In these equations, $N$ symbolizes the population size, and the social motion vector $\vec{S}_m^{t, A G E}$ at time step $t$ for the $m$-th horse is defined, with the factor denoted by $\omega_s$. The coefficient $\vec{s}_m^{t, A G E}$ conveys the horse's inclination towards the herd at repetition $t$. For horses of ages $\beta$ and $\gamma$, it is established at 0.2 and 0.1 , respectively, and the value of $\vec{s}_m^{t, A G E}$ is updated according to Eq. (19).
The sociability aspect of the model elucidates the intricate dynamics of interaction among horses, mirroring real-world herd behavior. By modeling this aspect, insights are gained into the nature of collaborative decision-making and cooperative strategies within the swarm. It may also offer broader implications for understanding social interactions among other species, potentially informing the development of innovative algorithms or approaches that mimic these natural dynamics.
The addition of sociability into the model not only increases the realism of the simulations but may also enhance the efficiency of the algorithm by encouraging a more cohesive exploration of the search space. The intricate interplay between individual exploration and group cohesion, captured in the equations above, contributes to the sophistication of the model and its potential applications in various optimization problems.
D. Imitation
A horse can pick up on the habits and mannerisms of other horses very quickly. This means the horse can learn both the positive and harmful habits of its peers. The mathematical formula that describes the social behaviour of imitation is as follows:
where, $\vec{I}_m^{t, A G E}$ denotes the imitation vector of the $m$-th horse in accordance with the standard of the best horses in positions denoted by bX. $p^N$ signifies the quantity of horses present at the current fittest sites, and the value of this constraint has been suggested to lie in the range of $0.1 \times N$ as proposed by MiarNaeimi et al. [27]. Eq. (21) governs the update of $\vec{i}_{}^{t, A G E}$, facilitated by a decrement factor denoted by $\omega_i$.
The mathematical modeling of imitation behavior serves to enrich the understanding of the intricate social dynamics within the herd. This aspect is not only representative of the mimicry witnessed among horses but might also lend itself to broader behavioral studies encompassing other social animals.
Moreover, the inclusion of imitation in the algorithm extends the real-world applicability of the model. It serves to further align the simulated behaviors with actual observations of herd dynamics, thus potentially enhancing the robustness and efficacy of the optimization strategies derived from this model. By capturing the dual nature of imitation, where both positive and negative attributes can be adopted, the model provides a nuanced depiction of social learning. Such complexities are instrumental in the pursuit of advanced optimization algorithms that capitalize on the collective intelligence demonstrated by social creatures.
E. Defense
The concept of defense within the context of the horse model is formulated to characterize the ability of a horse to evade its peers, particularly in precarious situations. This evasion ability is vital to simulate the instinctual movement away from zones of perceived threat. A negative sign is introduced in Eq. (22) to depict this evasion by adjusting the coefficient $d$:
where, $\vec{D}_m^{t, A G E}$ is defined as the leakage vector emanating from the standard horses at positions denoted by $\hat{X}$. The parameter $q^N$ represents the total number of horses in the current population that are positioned at the least desirable sites. The constraint for this value has been recommended to lie within 0:2 X.N as proposed by MiarNaeimi et al. [27]. Eq. (23) guides the update of $\vec{D}_m^{D M T, A G E}$, utilizing a discount factor symbolized by $\omega_d$.
The introduction of a defense mechanism within the model adds an additional layer of complexity that mirrors real-world dynamics. By accounting for the tendency to escape adverse situations, the mathematical representation allows for a nuanced understanding of survival strategies. This defense parameter not only aligns with observed behavior but also contributes to the overall robustness of the model in various applications.
In addition, the concept of defense, as expressed in the equations, serves to fortify the underlying algorithm's adaptive capabilities. By incorporating both attraction (as noted in previous sections) and repulsion within the dynamics, the model may offer insights into multifaceted social behaviors beyond the specific context of horses. Such balanced interaction mechanisms might find applications in various computational models seeking to replicate complex social interactions.
F. Roam
The tendency of horses to roam across pastures in search of food represents an intrinsic characteristic that has been formulated within the model to replicate random wanderings. This attribute is mathematically depicted through the following equations:
where, $\vec{R}_m^{t, A G E}$ is characterized as the $m$-th horse's trajectory during random wandering. The variable $P$ is introduced as a stochastic value that ranges between 0 and 1. Eq. (25) elucidates the update process for the value of $\vec{r}_m^{t, A G E}$, employing a discount factor symbolized by $\omega_r$.
The inclusion of roaming behavior within the model provides a realistic depiction of foraging habits observed in horses. By allowing for a stochastic component, the mathematical representation embodies the unpredictable nature of these movements. This aspect of random wandering may be instrumental in understanding the patterns and dynamics that influence the mobility of horses in their natural habitats.
Furthermore, the consideration of roaming aligns with an overarching theme of nuanced social behaviors that has been a focal point in this section. Through these mathematical characterizations, a multidimensional understanding of herd behavior, social dynamics, and survival strategies can be obtained. The ability to capture such complex behaviors through mathematical equations opens avenues for applying these models to other species or even human social dynamics, where random movements and interactions are also prevalent.
4. Results and Discussion
The TSR system underwent initial evaluation on a specific Windows PC setup, comprised of an i57200 Intel® Core™ processor, 8 GB RAM, and 64-bit architecture. Subsequently, assessment was conducted on a Raspberry Pi 4 board Classical B, equipped with a 64-bit CPU and 8 GB RAM. The computational resources were augmented with a separate storage server and central processing unit. An independent archive for camera footage was facilitated using a NEOUSYS 930 GB storage server. Further, inference on the trained model was performed using an NVIDIA Jetson AGX Xavier edge device, integrated with a 512-core NVIDIA Volta™ GPU.
| Categories | Categories |
|---|---|
| Night | Since there is no daylight to illuminate the area, it is exceedingly dim. |
| Clean | No blinding glare from the sun is in the way, and you can see well in all directions. |
| Rain | The surroundings are dark, and rainfall frequently makes traffic signs hazy. |
| Sunlight | The vision camera is immediately hampered by direct sunshine, which scatters light and makes it challenging to see traffic signs. |
Inspiration drawn from the prior description of meteorological features in reference [28] guided the proposal of novel classes to capture unique ecological circumstances in urban road scenes. Factors such as seasonal influences, topographical features, and the presence or absence of roads were identified as elements capable of modifying natural settings. The implications of these elements were observed to bear significant influence on TSR, even when employing identical traffic signs. Consequently, taxonomies were constructed for various traffic circumstances, and training images were compiled in alignment with these classifications. The dataset included observations made under diverse conditions such as pristine, cloudy, tunnel, night, rain, and sunny weather. The detailed classifications are provided in Table 1.
Standardized forms and colors were adhered to for the signs in order to facilitate accurate information transmission to drivers. Specifically, warning signs, characterized by their triangular shape, serve to notify drivers of hazardous or challenging road conditions. Regulatory signs, in contrast, alert drivers to prohibitions or limitations on driving conditions and are circular in form with a borderless blue background. Indication signs, guiding drivers directionally, follow this pattern as well. Examples of these three principal sign types—warnings, regulations, and indications—are illustrated in Table 2.
Class No. | Class Name | Sign Classification | Image |
|---|---|---|---|
0 | Cross Intersection | Carefulness | 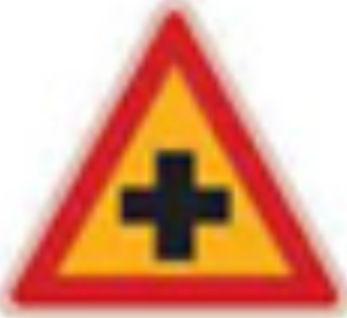 |
24 | Signal | Carefulness | 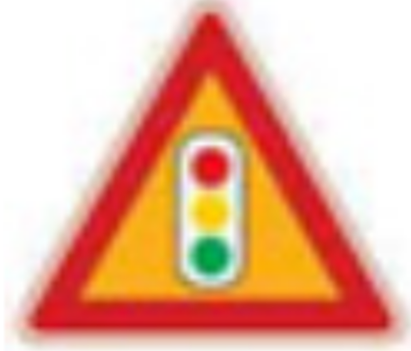 |
31 | Watch out Children | Carefulness | 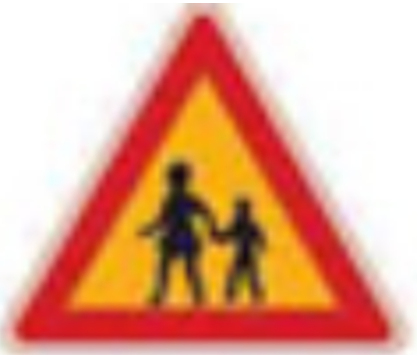 |
43 | No Trucks Allowed | Regulation |  |
56 | No Parking | Rule |  |
61 | Speed limit 60 | Rule |  |
74 | Crosswalk | Signal |  |
86 | Right turn | Signal |  |
92 | U-Turn | Sign |  |
Emerging technologies in this context constitute the foundation for advanced systems and autonomous vehicles. ADAS were developed to support both drivers and vehicles in recognizing and responding to potential hazardous driving conditions. The primary objective of these devices is the reduction of accident frequency on roads and the enhancement of driver safety. Integration of ADAS into the dashboard electronics of modern automobiles has become standard, though such integration is often absent in older vehicles.
The efficacy of the method was evaluated through the application of specific metrics, including sensitivity, specificity, F-measure, and accuracy. In this study, the following definitions were utilized:
where, T.P. denotes the true positives or correctly classified traffic sign images, F.P. signifies the false positives or incorrectly classified traffic sign images, F.N. represents the false negatives or incorrectly classified normal traffic sign images, and T.N. refers to the true negatives or the correct classification of normal traffic sign images.
For the validation and efficacy testing of the proposed approach, a unique dataset was constructed specifically for this study. Contrary to existing methods that relied on signals from unrelated datasets, a bespoke dataset was created, permitting a more precise and controlled validation. This bespoke approach ensured consistency with the experimental design, thus enabling a robust comparative analysis.
A comparative investigation was conducted with the proposed CNN against different deep-learning techniques. The performance indicators, including sensitivity, specificity, F-Measure, and accuracy, were evaluated for each method, as summarized in Table 3 and Figure 3. Key observations from the analysis include:
| Models | Sensitivity | Specificity | F-Measure | Accuracy |
|---|---|---|---|---|
| SVM | 75.00 | 80.00 | 76.92 | 77.50 |
| ELM | 90.00 | 80.00 | 85.71 | 85.00 |
| SELM | 90.00 | 85.00 | 87.80 | 87.50 |
| LR | 85.00 | 75.00 | 80.95 | 80.00 |
| MLP | 80.00 | 70.00 | 76.19 | 75.00 |
| SELM-HHOA | 100 | 90.00 | 95.24 | 95.00 |
•The SVM model achieved a sensitivity of 75.00, specificity of 80.00, F-Measure of 76.92, and accuracy of 77.50.
•For the Logistic Regression (L.R.) model, the sensitivity, specificity, and accuracy were recorded at 85.00, 75.00, and 80.95, respectively.
•The MLP, ELM, SELM, and SELM with SELM-HHOA models also demonstrated diverse performance metrics, ranging from a sensitivity of 80.00 to 90.00, specificity of 70.00 to 90.00, F-Measure of 75.00 to 87.80, and accuracy of 75.00 to 95.00, depending on the method applied.
Figure 4 presents the graphical comparison of various models.
Table 4 and Figure 5 detail the comparative study of the proposed model with different epochs. A trend analysis revealed:
| Metrics | 30 | 50 | 70 |
|---|---|---|---|
| Sensitivity | 80.00 | 70.00 | 100 |
| Accuracy | 85.00 | 80.00 | 95.00 |
| Specificity | 90.00 | 90.00 | 90.00 |
| F-Measure | 84.21 | 77.78 | 95.24 |
•Sensitivity increased from 80.00 at 30 epochs to 100 at 70 epochs.
•Specificity remained consistent at 90.00 across 30, 50, and 70 epochs.
•The F-Measure showed variations, with values of 84.21 at 30 epochs, 77.78 at 50 epochs, and 95.24 at 70 epochs.
•Accuracy also demonstrated a progression, with values of 85.00 at 30 epochs, 80.00 at 50 epochs, and 95.00 at 70 epochs.
These variations in performance metrics across different epochs signify the model's adaptability and learning efficiency, contributing to a deeper understanding of the model's responsiveness to the training process.
The results obtained underscore the efficacy and robustness of the proposed model in comparison to other deep-learning techniques. The ability to maintain or improve key performance indicators across varying epochs further highlights the adaptability of the proposed model.
The construction of a unique dataset tailored specifically to the research also contributes to the validity of the comparative analysis. This approach is recommended for future work to maintain control over variables and facilitate the reproduction of results.
The conducted study and the corresponding results do highlight several potential shortcomings and areas where further refinement or exploration is warranted. These are enumerated as follows:
•Utilization of Color Information: The study primarily relied on grayscale images, ostensibly to simplify computation and reduce complexity. While this approach has merits, it may simultaneously deprive the model of valuable information inherent in the full color spectrum. Colors, especially in the context of TSR, may carry significant distinguishing features crucial for accurate categorization. An exploration into how the RGB color model could be effectively integrated without unduly increasing computational burden should be considered in future work.
•Necessity for Expanded Training Data: The scarcity of training data for specific classes, such as Classes 0, 41, and 42, emerged as a limitation. An expansion of the dataset, particularly for under-represented classes, would likely lead to a more balanced and robust model.
•Imbalance in Training Data Across Classes: A marked variation was observed in the quantity of training data samples available across different classes. This imbalance manifested in a tendency for the model to recognize classes with larger sample sizes more accurately. Additional efforts to rectify this imbalance, possibly through techniques like data augmentation or synthetic data generation, could enhance the generalization capabilities of the model.
•Possible Extension: It may be beneficial to explore additional preprocessing or feature engineering techniques to mitigate some of the identified limitations. A systematic evaluation of various preprocessing methodologies and their impact on model performance could represent a fruitful direction for future research.
These observations provide essential insights into the limitations of the implemented approaches and suggest clear pathways for further research and development. Addressing these shortcomings might lead to substantial improvements in the efficacy and robustness of TSR systems.
5. Conclusions
The burgeoning field of automated safety technologies, with a view towards eventual deployment in fully autonomous vehicles, places an imperative on the development of robust and error-free systems. Among these, the TSR system, characterized by real-time automatic recognition of traffic signs, stands as a critical component within both ADAS and ADS. In this context, the present research introduced a method designed to fulfill stringent criteria pertaining to accuracy and processing time.
The study's proposed approach involved the development of a novel TSR system, employing a machine learning model classifier known as the SELM, with optimal parameters determined through the use of the HHOA model. It was observed that the recognition rate must meet exceedingly high standards, as the implications of error in this sphere can be profound. The approach delineated herein is posited to align with these stringent requirements, contributing to a paradigm that underpins both current advancements in vehicle safety and future strides towards full autonomy.
The research has laid foundational groundwork but also illuminated avenues for future exploration. Environmental factors, such as motion blur, color fading, unwanted light interference, occlusion, and weather conditions like rain and snow, have not been incorporated into the dataset. The integration of these complex real-world scenarios represents a logical next step in the refinement of the TSR system.
Moreover, future iterations of the model may benefit from the application of cutting-edge deep learning techniques, further enhancing the capability of the ADAS to detect road obstacles. Exploration of innovative strategies to bolster real-time detection speed and accuracy is also warranted.
The current landscape of TSR research has revealed a tendency towards redundancy, a condition that can impede practical application. A focused effort to diversify the scope of the project could involve an expansion into the nuanced study of traffic signs specific to different geographical regions, such as New Zealand. Additionally, the incorporation of advanced object recognition methods, such as heatmap techniques, and the employment of alternative evaluation metrics may contribute to a more holistic understanding of model performance.
In conclusion, the present study's insights and proposed method offer a promising direction in the field of TSR. The identified limitations and suggested pathways for future research contribute to an evolving narrative that resonates with the broader movement towards enhanced vehicle safety and autonomy. The continuance of this research trajectory is poised to yield innovations with far-reaching impacts on transportation systems and society at large.
The data used to support the findings of this study are available from the corresponding author upon request.
The authors declare that they have no conflicts of interest.