Improvement the Preparation of C4 Oolefin Through Ethanol Coupling and Optimization the Gray Correlation Degree Algorithm
Abstract:
C4 olefin is an important chemical raw material, but traditional production methods use limited and polluting fossil energy as raw materials. Ethanol stands out from many alternative energy sources because of its wide sources, easy conversion, and low pollution. The preparation of C4 olefins from ethanol has become an effective alternative route for olefin production, which has great environmental and economic value. Metal oxides are the main catalysts for the preparation of C4 olefins from ethanol. In this paper, a $\mathrm{SiO}_2$-$\mathrm{HAP}$ catalyst with both acid and base active sites was designed, and Co metal with dehydrogenation activity was supported on its surface. To improve the catalytic activity and improve the conversion of ethanol and the selectivity of C4 olefin, experiments were carried out by changing the process parameters such as $\mathrm{Co}$ loading (weight ratio of $\mathrm{Co}$ to $\mathrm{SiO}_2$), HAP (hydroxyapatite) mass, ethanol concentration, and reaction temperature. The improved gray relational degree algorithm was used to analyze the relational degree of process parameters with ethanol conversion and C4 olefin selectivity. Experimental results show that the detection accuracy of this algorithm for C4 olefin selectivity is better than that of the traditional algorithm without considering the difference in change rate between data, the detection accuracy is improved by 50%, and the detection accuracy of ethanol conversion is improved by 2%.
1. Introduction
C4 olefin [1] is a crucial chemical raw material with widespread applications in the production of various chemical and pharmaceutical products. It also serves as a fundamental resource in the petrochemical industry. The growing demand for coal and fossil energy has resulted in a continuous increase in the demand for C4 olefin. Therefore, the exploration of novel processes and methods for C4 olefin production has garnered significant attention from scholars.
Zeolite, metal oxides, and HAP(hydroxyapatite) [2] were selected as active components to catalyze the growth of the ethanol carbon chain to C4 olefin, and some progress was made. However, due to the variety and wide distribution of products involved in the process of ethanol conversion, the selectivity of the target products is low and the economic applicability is poor. To address this issue, a Co/SiO2-HAP catalyst was designed and synthesized for the preparation of C4 olefins from ethanol, demonstrating exceptional catalytic performance.
The traditional steam cracking process can provide abundant C4 olefin resources, but it has the outstanding defect of large energy consumption. The catalytic cracking process [3] can only produce a small amount of C4 olefin resources. Given the above problems, when studying the relationship between ethanol conversion, C4 olefin selectivity, and temperature, Wang et al. conducted thermodynamic calculations [4] to analyze the equilibrium conversion of ethanol, the equilibrium uptake rate of ethylene, the equilibrium uptake rate of ether, and the equilibrium uptake rate of C4 under different reaction temperatures, pressures, and water-alcohol ratios. The results indicated that reducing the pressure and increasing the water-alcohol ratio were favorable for ethylene yield. Li Ming employed a regression analysis method [5], using the product of ethanol conversion and C4 olefin selectivity as the dependent variable and temperature as the independent variable, to establish a regression analysis model. The analysis concluded that C4 olefin selectivity is positively correlated with temperature within a certain range. Moreover, it was found that at 350$^{\circ} \mathrm{C}$, the C4 olefin selectivity remains more stable over time with incremental increases. In the research of preparing light olefins, Wang Pei adopted the catalytic cracking method of heavy naphtha [6], in which the catalytic cracking products of raw materials were analyzed by thermal cracking instrument-gas chromatography-mass spectrometry, and it was found that the catalytic cracking effect of heavy naphtha on calcined HZSM-5 to produce C3-C4 olefins was the best at 700$^{\circ} \mathrm{C}$ for 2 hours.
Gray correlation analysis [7] is a quantitative method used to describe and compare the development and dynamics of a system. Its basic concept involves determining the closeness of the relationship by assessing the degree of geometric similarity between the reference data column and multiple comparison data columns. Li S W employed gray correlation analysis to analyze the influencing factors of chemical reactions and identified the optimal catalyst combination of Co/SiO2 and HAP in a mass ratio of 200mg: 200mg, with a Co to SiO2 weight ratio of 1: 100. The study also determined the optimal reaction temperature as 400$^{\circ} \mathrm{C}$, resulting in a maximum C4 olefin yield of 43.11 %. However, the gray correlation analysis method does not consider the allocation of weight values and overlooks differences in absolute position and the rate of change between the data. To address these limitations, various scholars have proposed theories such as absolute correlation, gray generalized absolute correlation, T-type correlation, gray slope correlation, gray correlation quantitative model, etc., and have improved weight allocation by employing methods like entropy weight calculation and off-potential coefficient assignment based on the traditional gray correlation analysis method. However, there is a lack of analysis and research concerning the differences in absolute position.
Drawing on practical experience in the preparation of C4 olefin through ethanol coupling, this study expands on the gray correlation quantitative model and constructs a comprehensive dynamic parameter model. The model is applied to analyze factors affecting the ethanol conversion rate and C4 olefin selectivity, including the mass of Co/SiO2, the ratio of Co to SiO2 weights, the mass of HAP, the ethanol concentration, and the temperature. A comparison with the experimental results of the traditional gray correlation model is presented, and improvements are made to enhance the accuracy of the data.
2. Ethanol Coupling Experiment for the Preparation of C4 Olefins
In the process of converting ethanol to C4 olefins, the reaction mechanisms of different catalysts are diverse and intricate. Among these, the Prins reaction mechanism [8] for the production of butadiene from ethanol has received more extensive research attention (Figure 1). It is postulated that ethanol, as the reactant, undergoes dehydrogenation to form acetaldehyde [9] facilitated by the presence of a basic site catalyst.
According to the proposed reaction mechanism, the dehydrogenated acetaldehyde is subsequently dehydrated to ethylene through the catalytic action of an acidic site. Alternatively, ethylene may be generated through the formation of an ether intermediate. Subsequently, the acetaldehyde and ethylene produced react via nucleophilic [10] addition to yield.

Table 1 shows the process parameters for the preparation of C4 olefin by ethanol coupling. The main factors affecting the ethanol conversion [11] and selectivity of C4 olefin [12] are Co loading (mass ratio of $\mathrm{Co}$ to $\mathrm{SiO}_2$), $\mathrm{Co} / \mathrm{SiO}_2$ and $\mathrm{HAP}$ loading ratio, ethanol concentration, and temperature.
Temperature(℃) | Co Loading | Co/SiO2 Mass (mg) | HAP Mass (mg) | Ethanol Concentration(%) | Ethanol Conversion(%) | C4 Olefin Selectivity(%) |
250 | 1:50 | 200 | 200 | 1.68 | 4.0 | 9.62 |
275 | 1:100 | 50 | 50 | 0.9 | 8.8 | 8.85 |
300 | 1:100 | 100 | 100 | 0.9 | 11.7 | 12.86 |
350 | 1:200 | 200 | 200 | 1.68 | 36.8 | 18.75 |
400 | 1:500 | 50 | 500 | 2.1 | 28.6 | 10.29 |
3. Catalytic Improvements
Metal oxides are the main catalysts for the reaction of C4 olefins preparation from ethanol. Mixed metal oxides have been applied to the catalytic preparation of low-carbon olefins from ethanol, and metal oxides with suitable acid and base pairs have been used to generate acetaldehyde and acetone intermediates by catalyzing the conversion of ethanol to butene and isobutene with high-selectivity (>60%, in zeolites <30%). Although the reaction mechanism is still unclear, metal oxides can also catalyze the conversion of ethanol to 1,3-butadiene. A SiO2-HAP catalyst with both acid and base active sites was designed and synthesized, and Co metal with dehydrogenation activity was loaded on its surface, and the acidity and alkalinity on the catalyst surface were adjusted by varying the amount of Co loading to catalyze the preparation of C4 olefins from ethanol selectively. At the same time, the conditions such as the mass of SiO2-HAP, the concentration of ethanol, and the reaction temperature were optimized to improve the selectivity of C4 olefins.
An aqueous cobalt nitrate solution [13] of $5 \mathrm{mg} \mathrm{Co} / 50 \mu \mathrm{L}$ was prepared from cobalt hexahydrate-cobalt nitrate, and $\mathrm{x} \mathrm{Co} / \mathrm{SiO}_2$ catalysts with different cobalt loadings were prepared by impregnation, and then mixed with commercial HAP to obtain the desired catalysts. The performance of ethanol was tested using a fixed-bed reaction device built in-house in the laboratory, and the process flow diagram of the device is shown in Figure 2. The reaction was carried out at atmospheric pressure, and the catalyst was sieved through 40-60 flakes and filled in a quartz tube with an inner diameter of 8 $\mathrm{mm}$, an outer diameter of $14 \mathrm{~mm}$ and a length of $360 \mathrm{~mm}$. The ethanol flowed into the pipeline of $\Phi$ $=3 \mathrm{~mm}$ by bubbling method and then entered into the gas mixing chamber after complete vaporization in the vaporization chamber at a constant temperature of $100^{\circ} \mathrm{C}$. Nitrogen flowed into the gas mixing chamber as the carrier gas through the Mass Flow Controller (MFC) [14], and was mixed with the ethanol gas at a set molar ratio. The actual temperature of the catalyst bed is detected and controlled by an intelligent temperature control system. The gas mixture after the reaction was fed into a gas chromatograph for product analysis by FID and TCD.
The products of this experiment mainly contain C2-C4 olefins, C2-C12 alcohols, and other high-carbon alcohols, as well as ethylene, ether, and other dehydration products.
The conversion of ethanol and the selectivity of the products were calculated using the normalization method [15]:
$\mathrm{A}_i=f_r \times C_n \times \mathrm{A}_i^{\prime}$
Selectivity $i \%=\frac{\mathrm{A}_i}{\sum \mathrm{A}_i} \times 100 \%$
Conversion $\mathrm{C}_2 \mathrm{H}_6 \mathrm{O} \%=\frac{\sum \mathrm{A}_i}{\sum \mathrm{A}_i+\mathrm{A}_{\mathrm{C}_2 \mathrm{H}_6 \mathrm{O} \text { in products }}} \times 100 \%$
The yield of the product was calculated according to the following equation:
Yield $i \%=$ Selectivity $i \times$ Conversion $\mathrm{C}_2 \mathrm{H}_6 \mathrm{O} \times 100 \%$
Notes:
$\mathrm{A}_i$ : The corrected peak area of product $i$.
$\mathrm{A}^{\prime} i$ : The peak area of the product $i$ obtained by the accumulation peak in the chromatography.
$\mathrm{C}_n$ : The number of carbon atoms of the reactant or product.
$f_r$ : relative molar correction factor.
4. Algorithmic Measurements
The catalytic conversion of ethanol is influenced by the reaction conditions. By carefully screening the appropriate reaction conditions, both the conversion of ethanol and the selectivity of the products can be increased. To achieve optimal catalytic performance, it is important to identify the main and secondary factors among the process parameters that affect the conversion of ethanol and the selectivity of C4 olefins. In this study, gray correlation analysis was employed to determine the degree of influence of the process parameters on the conversion of ethanol and the selectivity of C4 olefins. A total of 7 sets of data were selected, representing 4 types of process parameters, and the selectivity of C4 olefin was compared with the corresponding process parameters. The gray correlation analysis involved varying the resolution coefficient. Sub-factors including Co loading, charge ratio of $\mathrm{Co} / \mathrm{SiO}_2$ and HAP, ethanol concentration, and temperature were considered, while ethanol conversion and C4 olefin selectivity served as parent factors. By adjusting the resolution coefficients, the gray correlation between each factor and C4 olefin selectivity was calculated.
The Degree of Correlation Between Ethanol Conversion Rate and Various Factors | The Degree of Correlation Between C4 Olefin Selectivity and Various Factors |
 |  |
Regardless of variations in the resolution factor, as depicted in Table 2, there are no significant disparities in the gray correlation effect when it comes to the ranking of the correlation magnitude between ethanol conversion rate and C4 olefin selectivity. Increasing the resolution coefficient corresponds to an increase in the correlation degree for each factor, indicating a positive relationship. Notably, the correlation degree undergoes notable changes within the 0.1-0.3 range of the resolution coefficient. However, it tends to stabilize. The resolution coefficient falls between 0.4-0.9. Based on this analysis, a resolution coefficient of 0.5 satisfactorily meets the requirements. Therefore, the traditional algorithm employed requires improvement to address errors in the analysis of the sorting influence degree.
With a resolution coefficient of 0.5, the correlation is not only stable but also more significant in distinguishing the intervals between the process parameters.
The gray correlation analysis method, as currently employed, solely takes into account the disparities in the absolute position of the process parameters, neglecting the variations in the rate of change between data. Consequently, there is a need to develop a new model that incorporates both factors for more comprehensive analysis and calculation. This new model would provide a more accurate assessment by considering not only the absolute differences but also the relative changes in the data.
Improved gray correlation coefficient $\delta\left(x_0(k), x_i(k)\right)$:
\begin{align*} \delta\left(x_0(k), x_i(k)\right) =\frac{1+\xi \max_i \left|\Delta x_{0 i}(k)\right|+\eta_1 \max_i \max_k \left|\Delta r_{0 i}^{(1)}(k)\right|+\cdots+\eta_{k-2} \max_i \max_k \left|\Delta r_{0 i}^{(k-2)}(k)\right|}{1+\lambda_1\left|\Delta x_{0 i}(k)\right|+\lambda_2\left|\Delta x_{0 i}^{(1)}(k)\right|+\cdots+\lambda_{k-1}\left|\Delta x_{0 i}^{(k-2)}(k)\right|+\xi \max_i \max_k \left|\Delta x_{0 i}(k)\right|+\eta_1 \max_i \max_k \left|\Delta x_{0 i}^{(1)}(k)\right|+\cdots+\eta_{k-2} \max_i \max_k \left|\Delta x_{0 i}^{(k-2)}(k)\right|} \end{align*}
In the formula, $\lambda_1, \lambda_2, \cdots \lambda_{\mathrm{k}-1} \geq 0$ and $\lambda_1+\lambda_2+\cdots+\lambda_{k-1}=1, \lambda_1$ are the weights of absolute positional difference, and $\lambda_2, \cdots \lambda_{k-1}$ is the weight of rate of change difference. $\xi(0 \leq \xi \leq 1)$ is the coefficient of absolute positional difference resolving, and $\xi=0.5$ for reference to the gray correlation model. $\eta_{1,}, \cdots \eta_{k-2}$ is the resolution coefficient of the rate of change difference from the first order to the ${ }^k-2$ nd order, $\eta_1, \eta_2, \cdots \eta_{k-2}>0$ and $\eta_1+\eta_2+\cdots+\eta_{k-2}=1$, respectively.
$\Delta \mathrm{x}_{o i}(k)=x_0(k)-x_i(k)$ is the absolute position difference between the sequences $x_0(k)$ and $x_i(k)$ at the point $k. \Delta \mathrm{x}_{\mathrm{oi}}^{(1)}(k)=\mathrm{x}_0^{(1)}(k)-\mathrm{x}_{\mathrm{i}}^{(1)}(k)$ is the difference in the rate of change of the first order sequence, and $\Delta \mathrm{x}_{o i}^{(k-2)}(k)=\mathrm{x}_0^{(k-2)}(k)-\mathrm{x}_1^{(k-2)}(k)$ is the difference in the rate of change of the -2nd order sequence. $k x_i^{(1)}(k)=x_i(k)-x_i(k-1)$ is the rate of change of the first order sequence and $\mathrm{x}_i^{(k-2)}(k)=\mathrm{x}_i^{(k-3)}(k)-\mathrm{x}_i^{(k-3)}(k-1)$ is the rate of change of the $k-2$ nd order sequence. $i=0,1,2, \cdots, n, k=2,3, \cdots, m$.
The smaller $\left|\Delta \mathrm{x}_{o i}(k)\right|$ is, the more similar the two sequence curves are at this moment. The smaller $\left|x_i^{(1)}(k)-x_0^{(1)}(k)\right|$ is, the more the two sequence curves tend to develop at the same rate at this moment; and the smaller $\left|x_i^{(2)}(k)-x_0^{(2)}(k)\right|$ is, the more they tend to develop at the same rate of change.
Calculate the gray correlation formula: $\gamma_i=\frac{1}{n} \sum_{k=1}^n \delta\left(x_0(k), x_i(k)\right)$
The aforementioned formulas represent a novel gray relational quantitative model, which has been rigorously tested and verified to meet the criteria of standardization, integrity, even pair symmetry, and proximity in terms of gray relational degree. The model has successfully undergone verification procedures to ensure its conformity to these specified requirements.
Advantages of the formula:
(1) Standardization:
Obviously, $0<\delta\left(x_0(k), x_i(k)\right) \leq 1$, for $\lambda_1, \lambda_2, \cdots \lambda_{\mathrm{k}-1}>0$ $\delta\left(x_0(k), x_i(k)\right)=1 \Leftrightarrow\left|\Delta x_{o i}^{(k-2)}(k)\right|=0, k=2,3, \cdots, m \Leftrightarrow\left|\Delta x_{o i}^{(k-2)}(k)\right|=\left|x_0^{(k-2)}(k)-x_1^{(k-2)}(k)\right|=0$ $k=2,3, \cdots, m \Leftrightarrow x_0^{(k-2)}(k)-x_i^{(k-2)}(k)=\cdots=x_0(k)-x_i(k)=0$ $\Leftrightarrow x_0(k)=x_{\mathrm{i}}(k), k=2,3, \cdots, m$, namely, $0<\delta\left(x_0(k), x_i(k)\right) \leq 1$ and $\delta\left(x_0(k), x_i(k)\right)=1$ $\Leftrightarrow X_i=X_0,\ X_i=\left\{x_i(k), k=2,3 \cdots m, i=1,2 \cdots n\right\},\ X_0=\left\{x_0(k), k=2, \cdots m\right\}$, it means sequences $X_i$ and $X_0$ are parallel.
(2) Integrity
If $X_i^*=\left\{x_i(k), k=2, \cdots m, i=0,2 \cdots n\right\}, X_0^*=\left\{x_1(k), k=2, \cdots m\right\}$.
Then, $\delta\left(x_0(k), x_i(k)\right) \neq \delta\left(x_0^*(k), x_0^*(k)\right)$.
(3) Even pair symmetry
Obviously, $\delta\left(x_0(k), x_i(k)\right)=\delta\left(x_i(k), x_0(k)\right) i=1,2 \cdots n$
(4) Proximity
When the denominator of the novel model $\left|\Delta x_{o i}(k)\right|=\left|x_0(k)-x_{\mathrm{i}}(k)\right|$ decreases, $\delta\left(x_0(k), x_i(k)\right)$ becomes larger. So the novel model can be called a novel gray relational quantitative model.
5. Experimental Results and Analysis
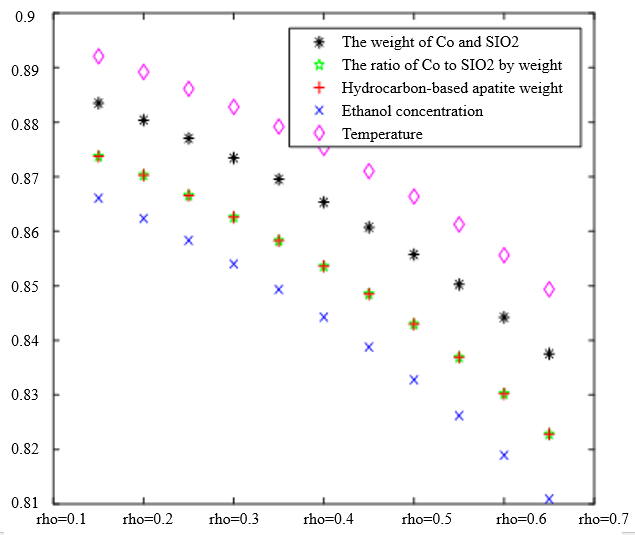
$\begin{aligned} & \xi_{\text {from } 0 \text { to } 1 \text {, and }} \eta_1 \text { varying from } 1 \text { to } 0 \text {. The three cases } \lambda_1=0.4 \text { and } \lambda_2=0.6, \lambda_1=0.5 \text { and } \\ & \lambda_2=0.5, \lambda_1=0.6 \text { and } \lambda_2=0.4 \text { were selected. }\end{aligned}$
$\begin{aligned} & x_1(k)=\left\{\text {The mass of } \mathrm{Co} \text { and } \mathrm{SiO}_2 \text { is } 1,2,3, \ldots \mathrm{N}\right\}, \\ & x_2(k)=\left\{\text {The mass ratio of Co to } \mathrm{SiO}_2 \ 1,2,3 \ldots \mathrm{N}\right\},\end{aligned}$
$\begin{aligned} & x_3(k)=\{\text {The masses of HAP is } 1,2,3 \ldots \mathrm{N}\}, \\ & x_4(k)=\{\text {The ethanol concentration is } 1,2,3 \ldots \mathrm{N}\}, \\ & x_5(k)=\{\text {Temperature is } 1,2,3 \ldots \mathrm{N}\}, \\ & x_{01}(k)=\{\text {Ethanol conversion is } 1,2,3 \ldots \mathrm{N}\} . \\ & x_{02}(k)=\{\mathrm{C} 4 \text { olefin selectivity is } 1,2,3 \ldots \mathrm{N}\} .\end{aligned}$
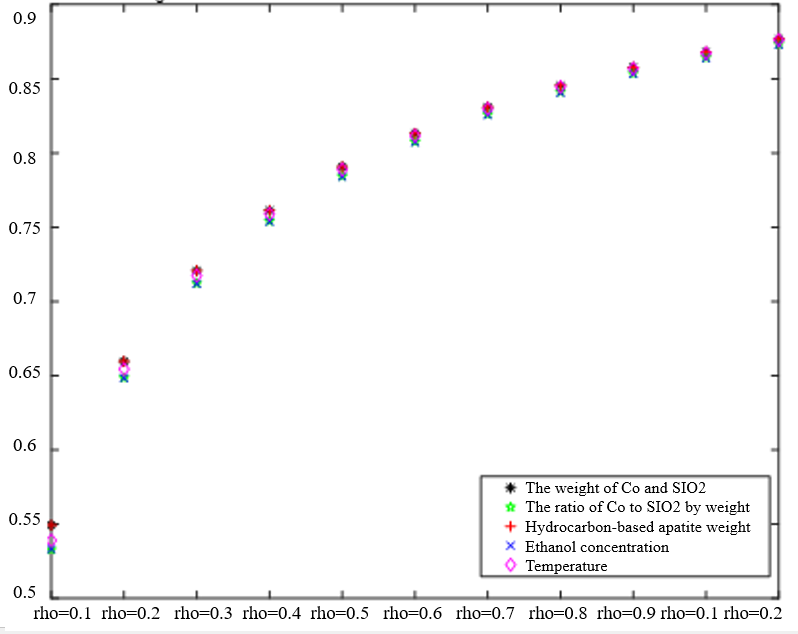
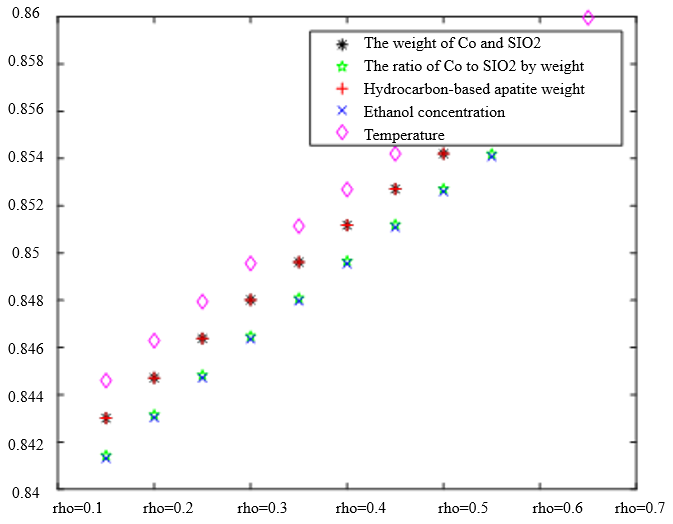
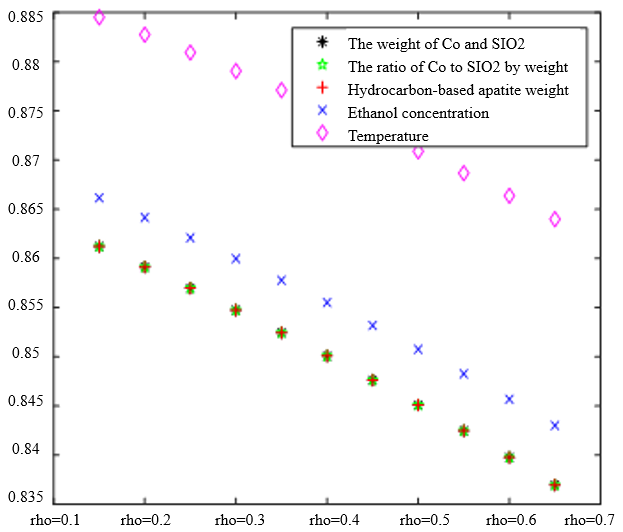
In Table 3, the improved gray correlation ordering of C4 olefin selectivity and ethanol conversion is consistent with the traditional gray correlation algorithm ordering, and the differences in gray correlation intervals of the five process parameters in the figure are not significant, with the mass of $\mathrm{Co} / \mathrm{SiO}_2$, Co loading, HAP mass, ethanol concentration, and temperature being a little bit more different for $\lambda_1=0.5$ and $\lambda_2=0.5$ compared to the other several cases. When the experimental data (16 groups) were consistent, the changes in $\xi \eta_1$ and were not significant for the classification results. Considering that the resolution coefficients of the traditional model of gray correlation are generally taken as intermediate values, the parameters $\xi=0.5, \eta_1=0.5$ were selected.
The Degree of Correlation Between Ethanol Conversion Rate and Various Factors | The Degree of Correlation Between C4 Olefin Selectivity and Various Factors |
|---|---|
 |  |
$\xi=0, \eta_1=1 ; \quad \xi=0.5, \eta_1=0.5 ; \quad \xi=1, \eta_1=0 ; \quad \xi=0, \eta_1=0.5 ; \quad \xi=1, \eta_1=0$ (a) $\lambda_1=0.38, \lambda_2=0.6$ | |
 |  |
$\xi=0, \eta_1=1 ; \quad \xi=0.5, \eta_1=0.5 ; \quad \xi=1, \eta_1=0 ; \quad \xi=0, \eta_1=1 ; \quad \xi=0.5, \eta_1=0.5 ; \quad \xi=1, \eta_1=0$ (b) $\lambda_1=0.5, \lambda_2=0.5$ | |
 |  |
$\xi=0, \eta_1=1 ; \quad \xi=0.5, \eta_1=0.5 ; \quad \xi=1, \eta_1=0 ; \quad \xi=0, \eta_1=1 ; \quad \xi=0.5, \eta_1=0.5 ; \quad \xi=1, \eta_1=0$ (c) $\lambda_1=0.6, \lambda_2=0.38$ | |
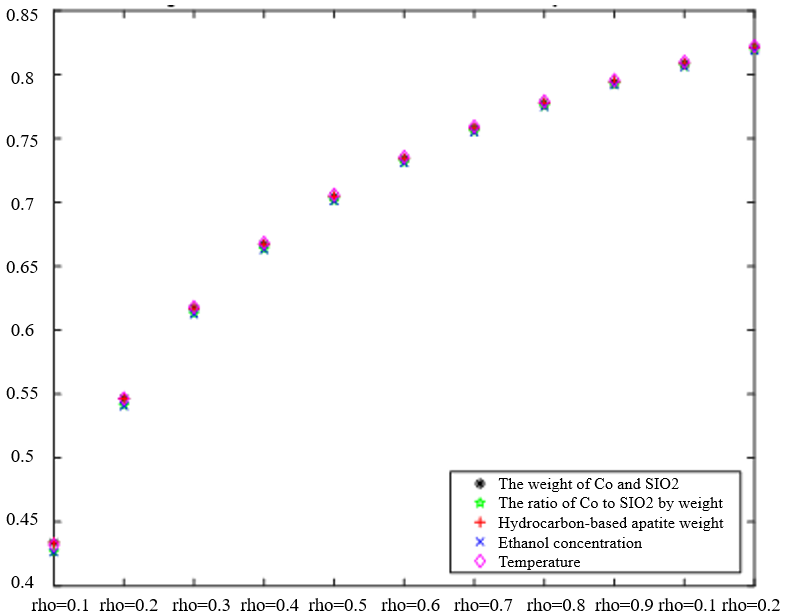
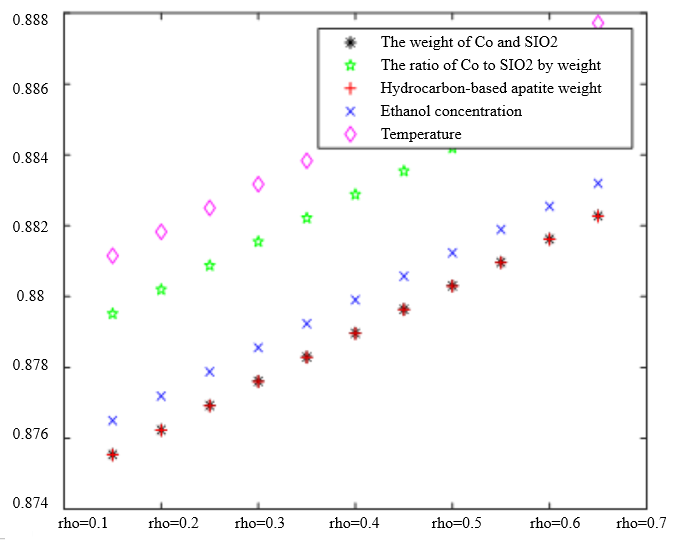
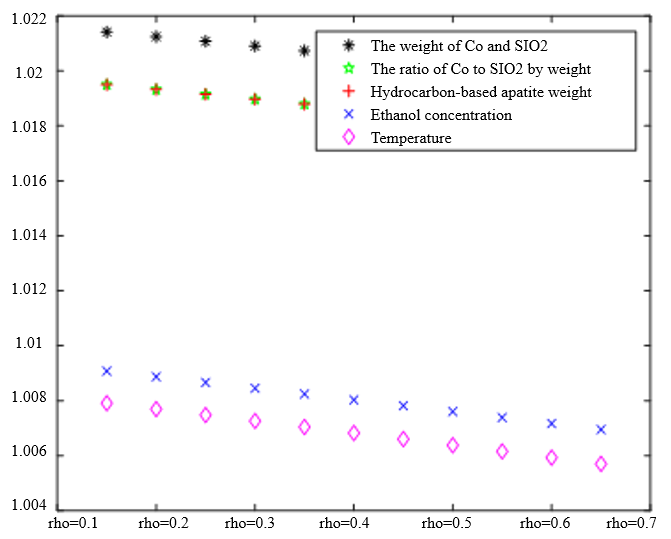
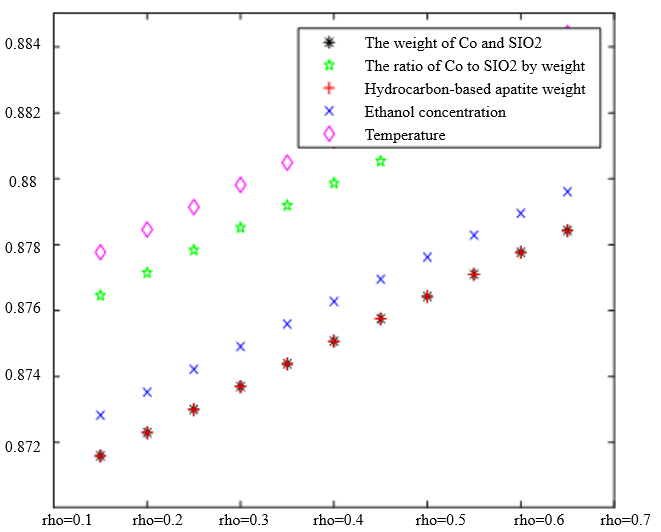
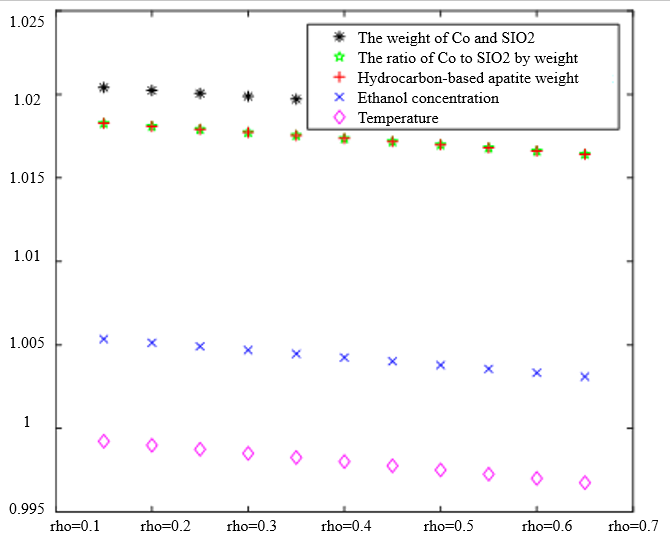
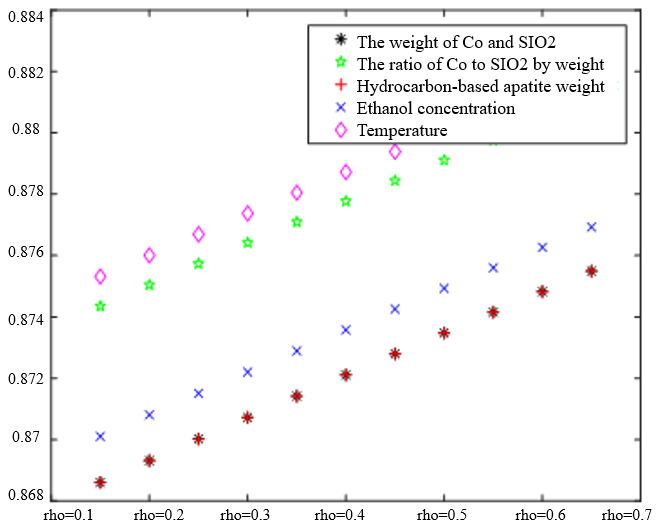
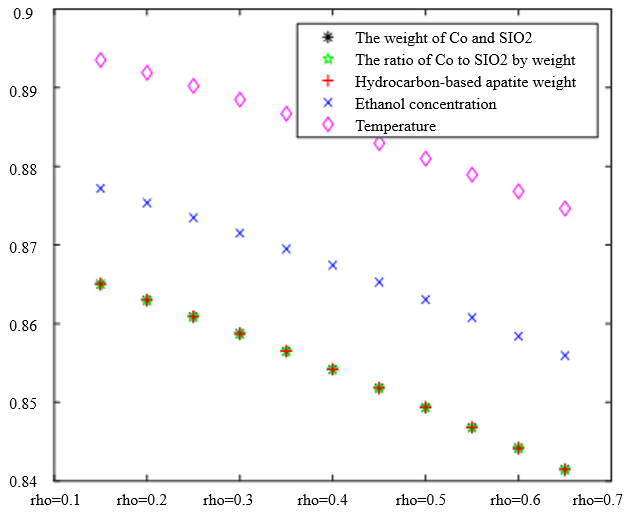
In the analysis of the previous section, it is initially obtained that the sorting classification effect is better when $\lambda_1=0.5$ and $\lambda_2=0.5$. To further seek the optimal parameters of the improved model $\lambda_1, \lambda_2$, by changing the length of the experimental data, orthogonal data were extracted from 3, 5, 7, and 9 groups of data, fixed parameters $\xi=0.5, \eta_1=0.5$, respectively, change $\lambda_1$ and $\lambda_2$, the results of the experiment are shown in Table 4:
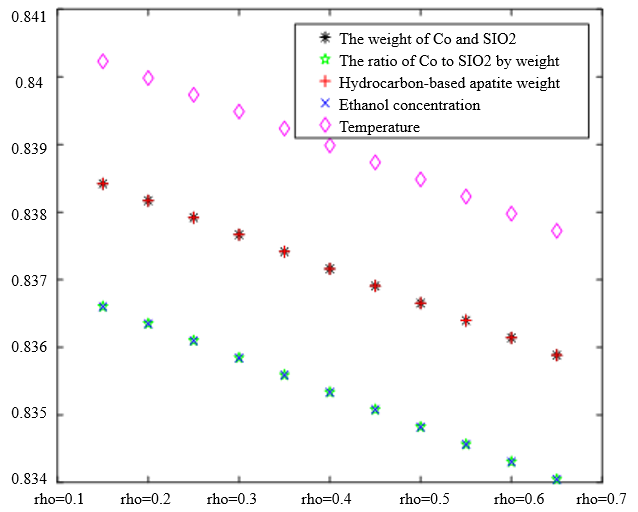 | 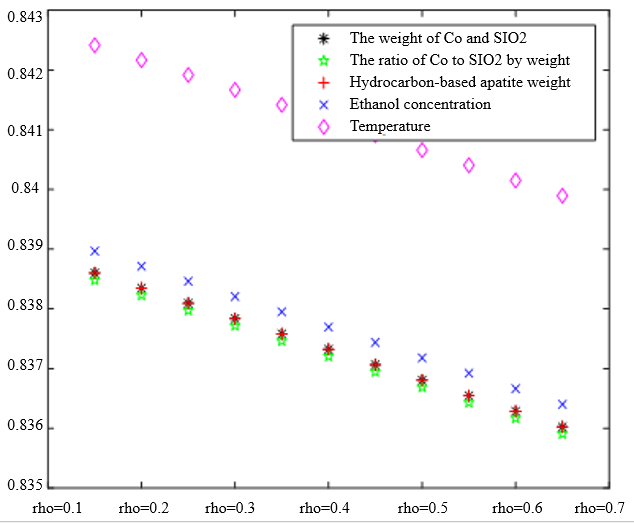 |
|---|---|
(1) $\lambda_1=0, \lambda_2=1 ; \lambda_1=0.5, \lambda_2=0.5 ;\lambda_1=1, \lambda_2=0 ; \lambda_1=0, \lambda_2=1 ; \lambda_1=0.5, \lambda_2=0.5 ; \lambda_1=1, \lambda_2=0$ | |
 |  |
(2) $\lambda_1=0, \lambda_2=1 ; \lambda_1=0.5, \lambda_2=0.5;\lambda_1=1, \lambda_2=0 ; \lambda_1=0, \lambda_2=1 ; \lambda_1=0.5, \lambda_2=0.5 ;\lambda_1=1, \lambda_2=0$ | |
 |  |
(3)$\lambda_1=0, \lambda_2=1 ; \lambda_1=0.5, \lambda_2=0.5 ;\lambda_1=1, \lambda_2=0 ; \lambda_1=0, \lambda_2=1 ; \lambda_1=0.5, \lambda_2=0.5 ; \lambda_1=1, \lambda_2=0$ | |
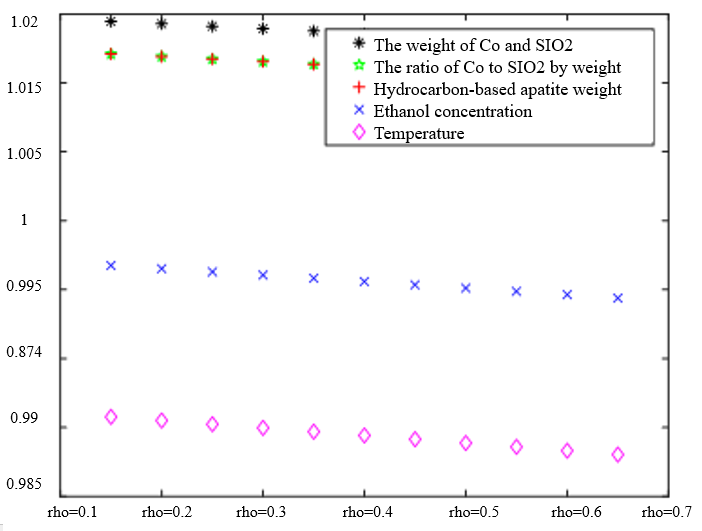
 |  |
(4) $\lambda_1=0, \lambda_2=1 ; \lambda_1=0.5, \lambda_2=0.5 ;\lambda_1=1, \lambda_2=0 ; \lambda_1=0, \lambda_2=1 ; \lambda_1=0.5, \lambda_2=0.5 ; \lambda_1=1, \lambda_2=0$ | |
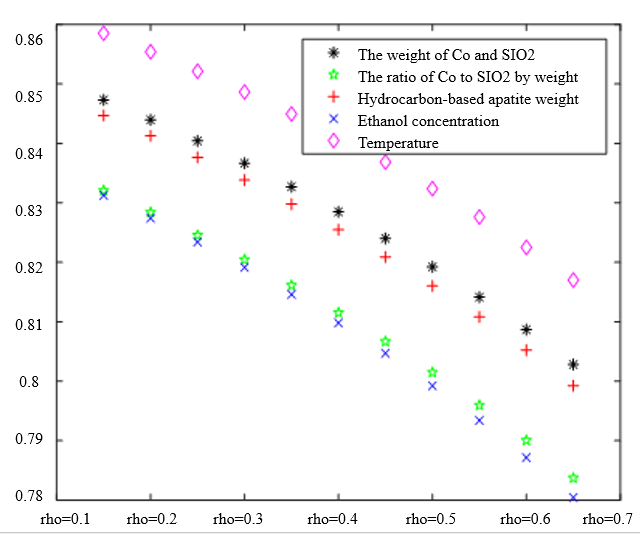
According to the observation, there is a special catalyst combination [16] A11 (50mg1wt% $\mathrm{Co} / \mathrm{SiO}_2+90 \mathrm{mg}$ quartz sand - ethanol concentration $1.68 \mathrm{ml} / \mathrm{min}$, no HAP) containing quartz sand [17] in the group of Table 4(4), which will bring some errors if it is used as experimental data, so seven groups of data other than it was selected for the gray correlation analysis, and the results are shown in Table 4(1)-(3).
In Table 4, as the values of $\lambda_1 \lambda_2$ and keep changing, most of the C4 olefin selectivity and ethanol conversion degree correlation size rankings are always in the same order as the original gray correlation algorithm [18]: temperature $>$ ethanol concentration [19] $>\mathrm{HAP}$ mass $>\mathrm{Co} / \mathrm{SiO}_2$ mass and Co loading. Combined with the results of the analysis in section 5.1, the differences in the rate of change of the data are generally not particularly significant. Therefore, $\lambda_1=0.5$ and $\lambda_2=0.5$ were chosen as the most appropriate.
Thus we conclude that temperature has the greatest effect on olefin selectivity and ethanol conversion.
50, 60, 70, 80, 90 and 100 groups of data were randomly selected from the database, respectively, and each group was further divided into 10 groups equally (non-orthogonal data). They were analyzed by the traditional gray correlation algorithm $(\xi=0.5)$ and improved gray correlation algorithm ($\xi$ $\left.=0.5, \eta_1=0.5, \lambda_1=0.5, \lambda_2=0.5\right)$, respectively, and were compared using the group shifting method.
A, B, C, D, E, and F represent $\mathrm{a}>\mathrm{b}, \mathrm{a}>\mathrm{c}, \mathrm{a}>\mathrm{d}, \mathrm{b}>\mathrm{c}, \mathrm{b}>\mathrm{d}$, and $\mathrm{c}>\mathrm{d}$, respectively, where a represents Co loading, b represents $\mathrm{Co} / \mathrm{SiO}_2$ to HPA loading ratio, c represents ethanol concentration, and $\mathrm{d}$ represents temperature.
The process parameters were judged based on Level 2 accuracy, and to explore the relationship between the different process parameters, the data for Level 1 accuracy were also counted. Level 1 of accuracy is defined as the ratio of the number of correct cases to the total number of cases A to F. Level 2 of accuracy is defined as the ratio of the correct quantity to the total quantity in the case of $\mathrm{a}>\mathrm{b}>\mathrm{c}>\mathrm{d}$ (denoted by the letter $\mathrm{T}$ ).
Figure 3 and Figure 4 show the comparison of C4 olefin selectivity and ethanol conversion detection accuracy [20]. The green bars represent the improved algorithm and the yellow bars represent the conventional algorithm.
Table 5 shows the traditional accuracy and improved accuracy of 6 sets of sample data under different states of Level 1 detection and Level 2 detection. Table 6 shows the average accuracy improvement rate of 6 groups of sample data under different states of Level 1 detection and Level 2 detection. Table 7 shows the ethanol conversion rate measurement accuracy data and Table 8 shows the improved detection rate.
50 Sets of Data as a Sample | 60 Sets of Data as a Sample | ||||||
Detection Level | State | Traditional Accuracy | Improved Accuracy | Detection Level | State | Traditional Accuracy | Improved Accuracy |
Level 1 detection | A | 0.4 | 0.7 | Level 1 detection | A | 0.6 | 0.9 |
B | 0.5 | B | 0.5 | 0.8 | |||
C | 0.6 | C | 0.3 | 0.8 | |||
D | 0.4 | D | 0.5 | 0.7 | |||
E | 0.5 | E | 0.4 | 0.7 | |||
F | 0.3 | F | 0.6 | 1 | |||
Level 2 detection | T | 0 | 0.4 | Level 2 detection | T | 0 | 1 |
70 Sets of Data for the Sample | 80 Sets of Data as a Sample | ||||||
Detection Level | State | Traditional Accuracy | Improved Accuracy | Detection Level | State | Traditional Accuracy | Improved Accuracy |
Level 1 detection | A | 0.7 | 0.8 | Level 1 detection | A | 0.7 | 0.9 |
B | 0.6 | B | 0.5 | 0.5 | |||
C | 0.6 | C | 0.5 | 0.5 | |||
D | 0.6 | D | 0.5 | 0.4 | |||
E | 0.5 | E | 0.3 | 0.4 | |||
F | 0.7 | F | 0.5 | 1 | |||
Level 2 detection | T | 0.3 | 0.5 | Level 2 detection | T | 0.2 | 0.4 |
90 Sets of Data for the Sample | 100 Sets of Data as a Sample | ||||||
Detection Level | State | Traditional Accuracy | Improved Accuracy | Detection Level | State | Traditional Accuracy | Improved Accuracy |
Level 1 detection | A | 0.7 | 0.9 | Level 1 detection | A | 0.9 | 0.9 |
B | 0.5 | B | 0.6 | 0.7 | |||
C | 0.5 | C | 0.7 | 0.7 | |||
D | 0.5 | D | 0.7 | 0.7 | |||
E | 0.3 | E | 0.7 | 0.7 | |||
F | 0.5 | F | 0.4 | 0.7 | |||
Level 2 detection | T | 0 | 0.6 | Level 2 detection | T | 0.4 | 0.7 |
Detection Level | Level 1 Detection | Level 2 Detection | |||||
State | A | B | C | D | E | F | T |
6 sets of data average value | 0.18 | 0.13 | 0.13 | 0.05 | 0.1 | 0.1 | 0.45 |
50 Sets of Data as a Sample | 60 Sets of Data as a Sample | ||||||
Detection Level | State | Traditional Accuracy | Improved Accuracy | Detection Level | State | Traditional Accuracy | Improved Accuracy |
Level 1 | A | 1 | 1 | Level 1 | A | 0.9 | 1 |
B | 0.6 | 0.9 | B | 0.4 | |||
C | 0.9 | 0.7 | C | 0.7 | |||
D | 0.4 | 0.5 | D | 0.3 | |||
E | 0.2 | 0.4 | E | 0.6 | |||
F | 0.5 | 0.3 | F | 0.7 | |||
Level 2 | T | 0.1 | 0.1 | Level 2 | T | 0 | 0 |
70 Sets of Data for the Sample | 80 Sets of Data as a Sample | ||||||
Detection Level | State | Traditional Accuracy | Improved Accuracy | Detection Level | State | Traditional Accuracy | Improved Accuracy |
Level 1 | A | 1 | 1 | Level 1 | A | 1 | 1 |
B | 0.4 | B | 0.6 | 0.8 | |||
C | 0.9 | C | 0.9 | 0.9 | |||
D | 0.4 | D | 0.6 | 0.5 | |||
E | 0.7 | E | 0.7 | 0.8 | |||
F | 0.8 | F | 0.7 | 0.7 | |||
Level 2 | T | 0.2 | 0.2 | Level 2 | T | 0.3 | 0.2 |
90 Sets of Data for the Sample | 100 Sets of Data as a Sample | ||||||
Detection Level | State | Traditional Accuracy | Improved Accuracy | Detection Level | State | Traditional Accuracy | Improved Accuracy |
Level 1 | A | 0.9 | 1 | Level 1 | A | 1 | 1 |
B | 0.6 | B | 0.7 | 0.6 | |||
C | 0.7 | C | 0.8 | 0.9 | |||
D | 0.4 | D | 0.7 | 0.5 | |||
E | 0.5 | E | 0.8 | 0.6 | |||
F | 0.5 | F | 0.5 | 0.7 | |||
Level 2 | T | 0 | 0.2 | Level 2 | T | 0.2 | 0.2 |
| Increased Detection Rate | |||||||
| Detection Level | Level 1 Detection | ||||||
| State | A | B | C | D | E | F | Level 2 Detection |
| 6 Sets of Data | 0.02 | 0.12 | -0.05 | -0.02 | -0.03 | -0.08 | T |
| Average Value | 0.02 | ||||||
The improved algorithm demonstrates a substantial improvement over the conventional algorithm, achieving a remarkable 60% increase in accuracy for both level 1 and level 2 detection of C4 olefin selectivity. Specifically, when considering the influence of temperature and Co loading, the improved algorithm achieves detection accuracies of 100% and 70-90% respectively, surpassing the performance of the conventional algorithm by a significant margin.
However, in terms of the ethanol conversion rate, the accuracy of level 2 detection is not high for both algorithms. Additionally, it is observed that the advantage of the improved algorithm diminishes as the number of data groups exceeds 70, indicating that excessive data leads to redundancy and reduces the effectiveness of the algorithm.
6. Conclusion
In the process of ethanol coupling to prepare C4 olefins, temperature has a great influence on the selectivity and ethanol conversion of C4 olefins. In the conventional literature, the influence of process parameters Co loading, Co/SiO2 and HPA charging ratio, ethanol concentration, time and temperature is studied by using a single factor test method (i.e., fixing other process parameters, changing a certain parameter, and observing the law of temperature change with the process parameters is more suitable for experimental data research). In this paper, the grey correlation improvement model is used to observe the changes in the selectivity and ethanol conversion of C4 olefins at the same time by multiple process parameters, which is more applicable to the actual data. The proposed improved grey correlation algorithm takes into account the absolute position difference of the data and the difference in the change rate between the data, and the detection accuracy of the ethanol conversion rate is better than that of the traditional grey correlation algorithm and the correlation algorithm, but the overall detection accuracy is not high for the selectivity of C4 olefins, although the improved grey correlation algorithm also has certain advantages. Therefore, it is necessary to find a more suitable algorithm to study the effects of process parameters Co loading, Co/SiO2 and HPA charge ratio, ethanol concentration, time and temperature on the selectivity and ethanol conversion of C4 olefins.
In this design, a more accurate value of the influence degree of process parameters is obtained by improving the model, and various process parameters can be adjusted according to whether the actual C4 olefin selectivity and ethanol conversion meet the standard, if the difference between the selectivity and ethanol conversion rate of C4 olefin and the standard range is large, it is necessary to adjust the temperature range (350°C-400°C) to achieve rapid adjustment, if the selectivity of C4 olefin and ethanol conversion and the standard deviation range are small, the Co loading, Co/SiO2 and HPA charge ratios, ethanol concentration, time and temperature, or one or more of these parameters.
The data used to support the research findings are available from the corresponding author upon request.
The authors declare no conflict of interest.