Strategic Assessment of Port Logistics Information Systems Using Fuzzy FUCOM–Fuzzy RAWEC: A Case from the Black Sea Region
Abstract:
In view of growing global trade complexities and increasing pressure on maritime infrastructure, the strategic implementation of Logistics Information Systems (LIS) has emerged to be a critical enabler of port efficiency and competitiveness. This study aims to evaluate and rank the alternatives to LIS for enhancing port operation in the Black Sea region of Türkiye by employing a hybrid multi-criteria decision-making (MCDM) approach, which integrates fuzzy Full Consistency Method (fuzzy FUCOM) and fuzzy Rough Analytical Weighted Evaluation Criteria (fuzzy RAWEC). Six key evaluation criteria including operational efficiency, cost effectiveness, technological competence, regulatory support, user compatibility, and sustainability impact were determined by expert consultation and literature synthesis. Based on these criteria, assessment were conducted on five LIS alternatives, involving Port Community Systems, Terminal Operating Systems, Blockchain-Based Platforms, IoT-Supported Smart Port Systems, and Cloud-Based Logistics Management Systems. Fuzzy FUCOM method was employed to derive consistent criterion weights under uncertainty, while fuzzy RAWEC facilitated the ranking of alternatives with enhanced sensitivity to expert evaluations. Validation of the results was processed via three methods: sensitivity analysis, benchmarking with five other fuzzy MCDM techniques, and rank reversal test. Terminal Operating Systems was consistently proved to be the most preferred alternative, demonstrating robustness across all validation procedures. The findings highlighted the effectiveness of the proposed hybrid model in handling uncertainty and advocating strategic digital transformation in port management. This research offered both methodological contributions to fuzzy MCDM literature and practical insights, targeting port authorities and policymakers to modernize logistics infrastructure in the Black Sea region.
1. Introduction
Efficient port operation is a cornerstone of global and regional trade, influencing supply chain performance, trade facilitation, and economic competitiveness (Adabere et al., 2021; Wang et al., 2022a). In this context, ports function not merely as points of cargo transfer but complex logistical ecosystems. Their performance impacts transit times, reliability, and the overall cost structure of international logistics chains. The Black Sea region, which includes Türkiye, Romania, Bulgaria, Ukraine, Russia, and Georgia, is of particular strategic importance due to its geographic location linking Europe and Asia through Eurasian corridors. It serves as a maritime gateway for energy exports, containerized trade, and bulk cargo movements (Popović et al., 2022; Zhelev, 2025). Despite its geopolitical and economic significance, systematic and comparative studies on port efficiency in the Black Sea context remain relatively limited, thus emphasizing a need for more targeted research in the region (Sunitiyoso et al., 2022).
Efficient port performance could critically facilitate the deployment of Logistics Information Systems (LIS), the digital platforms that integrate, process, and distribute logistics-related information to stakeholders across the supply chain. In port settings, LIS support real-time coordination of cargo flows, vessel scheduling, customs processing, inventory tracking, and intermodal logistics, thereby reducing bottlenecks and enhancing operational throughput. Tools such as Port Community Systems (PCS) and Terminal Operating Systems (TOS) have been widely implemented to streamline communication and automate core port processes (Sahraoui et al., 2023; World Bank, 2023). As ports in the Black Sea region endeavor to modernize, LIS represent a key strategic tool to bridge the performance gap with leading global ports, enhance integration with transnational corridors, and meet the increasing demands of digital trade and environmental compliance.
The emergence of the “smart port” paradigm characterized by Internet of Things (IoT) infrastructure, data analytics, automation, and AI-supported decision-making, further illustrates how LIS could propel not only operational efficiency but also sustainability, resilience, and digital transformation in port ecosystems (Min, 2022; Sim et al., 2024). These systems are essential to boost the competitiveness of modern ports as they provide visibility across the supply chain, enable predictive maintenance of port equipment, optimize berth allocation, and facilitate environmental monitoring.
Port operation and the implementation of LIS involve numerous, often conflicting criteria ranging from cost, reliability, throughput, interoperability, to sustainability. As a result, Multi-Criteria Decision-Making (MCDM) approaches become indispensable for structured evaluation across multiple dimensions under uncertainty (Wang et al., 2022a). Fuzzy-based MCDM methods, which accommodate vagueness in expert judgment, allow more nuanced decision-making.
Along with the emergence of Full Consistency Method (FUCOM) and Rough Analytical Weighted Evaluation Criteria (RAWEC) in the literature of decision science, their direct application in port LIS has yet to be documented in peer review. However, frameworks such as grey FUCOM-strengths, weaknesses, opportunities, and threats (SWOT) have demonstrated the capability to handle uncertainty in logistics decision contexts (Popović et al., 2022). In a similar vein, hybrid fuzzy MCDM approaches have been successfully applied in the evaluation of container port service performance (Wang et al., 2022b; Yılmaz & Kabak, 2020). These precedents suggested that fuzzy FUCOM and fuzzy RAWEC could provide rigorous and uncertainty-aware methodologies for port-related evaluations.
Implementing LIS across Black Sea ports faces several challenges like fragmented digital infrastructure, organizational silos, variable governance frameworks, and limited interoperability among stakeholders. Historical studies of port logistics, such as Port of Santos in Brazil, have identified deficiencies in information flows as a critical barrier to efficiency (O Connor & Vega, 2019; Pamucar & Görçün, 2022; Vieira et al., 2015), a finding likely to be mirrored in similar regional contexts.
Conversely, opportunities for advancement exist. The global momentum toward smart port infrastructure emphasizes digital standardization, real-time data sharing, and coordinated decision-making (Ferreira et al., 2025; Said et al., 2014; Yılmaz & Kabak, 2020). Regional cooperation frameworks, including EU-supported trade corridors and pan-Black Sea initiatives, offer further institutional pathways for harmonizing digital logistics systems. Moreover, the imperatives of sustainability provide additional incentives; smart and green port models exemplify that digitalization can simultaneously promote environmental objectives and operational effectiveness (Alzate et al., 2024; Elhussieny, 2025; Su et al., 2024).
Despite the recognized importance of LIS for port efficiency and the potential of fuzzy MCDM approaches, there remains a research gap. There is no extant study that has systematically applied fuzzy FUCOM and fuzzy RAWEC to evaluate the implementation of LIS across Black Sea ports. Existing literature often relied on conventional MCDM models, or qualitative assessments, without incorporating the advanced uncertainty management offered by fuzzy methods.
The present study addressed this gap by:
1. Identifying key performance criteria for the effectiveness of LIS in port operation through expert elicitation and literature synthesis;
2. Applying fuzzy FUCOM to determine consistent criteria weights under uncertainty;
3. Utilizing fuzzy RAWEC to rank alternative LIS configurations or levels of implementation across port environments in the Black Sea region;
4. Deriving implementable insights for port authorities and policymakers to enhance LIS-driven operational efficiency, competitiveness, and regional interoperability.
The novelty of this research lied in the methodological integration of two fuzzy MCDM frameworks, which were srategically applied in a vital and underexamined maritime region. The findings will contribute both to scholarly discourse on decision analysis in port logistics and to practical strategies for the development of regional digital infrastructure.
2. Previous Studies
Multi‑criteria decision-making (MCDM) techniques have been widely applied to evaluate complex logistics and port-related decisions, especially under uncertainty.
· Fuzzy AHP and Quality of Port Services
Nguyen et al. (2022) employed an integrated Fuzzy Analytic Hierarchy Process (F‑AHP) with Importance‑Performance Analysis (IPA) to assess the quality of port services in Vietnam. They revealed that “empathy” and “tangibles” were the most highly weighted dimensions in improving port competitiveness.
· Fuzzy ANP and Port Capacity Upgrades
In a Taiwanese context, Wang & Chao (2022) proposed a Fuzzy Analytic Network Process (F‑ANP) combined with Weighted Aggregated Sum Product Assessment (WASPAS) to support decision-making in port capacity upgrade projects. Their model demonstrated enhanced decision support under fuzzy environments.
· Fuzzy TOPSIS for Intangible Resources
Pak et al. (2015) utilized a Fuzzy Technique for Order Preference by Similarity to an Ideal Solution (TOPSIS) approach to evaluate intangible port resources influencing service quality, identifying and ranking key intangibles that affect performance.
· Interval‑Valued Fuzzy Hybrid (QFD‑TOPSIS)
Wang et al. (2022b) combined Quality Function Deployment (QFD) with Fuzzy TOPSIS under an interval-valued fuzzy environment (IVFE) to evaluate service performance of international container ports. Their hybrid IVFE method proved effective in handling dependent evaluation criteria and dynamic challenges, such as the disruption of COVID‑19.
These studies collectively established that fuzzy-based MCDM methodologies were appropriate for evaluating port logistics by enabling nuanced treatment of both qualitative and quantitative criteria.
Recent advances in MCDM highlighted the use and versatility of FUCOM and its fuzzy variants, particularly in risk-sensitive environments.
· F‑FUCOM for Logistics Platform Location
Ayadi et al. (2021) developed a logistics platform location selection framework that employed F‑FUCOM to calculate the weights of criteria, followed by Fuzzy MultiAtributive Ideal-Real Comparative Analysis (F‑MAIRCA) and Fuzzy Preference Ranking Organization Method for Enrichment Evaluation (F‑PROMETHEE) to rank alternatives with sustainability considerations. Their findings underscored the predominance of economic sustainability in location decision-making.
· Spherical Fuzzy‑FUCOM-ARTASI in Maritime Ergonomic Risks
Tatar et al. (2025) applied a spherical fuzzy‑FUCOM‑Alernative Ranking Technique Based on Adaptative Standardized Intervals (ARTASI) hybrid approach to assess ergonomic risks among port workers. This methodology enabled comprehensive risk modeling across multidimensional ergonomic criteria.
· FUCOM in Cybersecurity Risk Analysis
Kayişoğlu et al. (2024) adopted the fuzzy‑FUCOM method to rank cyber risks affecting Electronic Chart Display and Information Systems (ECDIS) aboard vessels. The study identified “malware infection via internet/intranet” as the primary threat and utilized a bow-tie framework for systemic risk visualization.
· FUCOM in the Prioritization of Green Logistics Solutions
Derse (2024) integrated Fuzzy Decision Making Trial and Evaluation Laboratory (DEMATEL), FUCOM, and Step-Wise Weight Assessment Ratio Analysis (SWARA) to evaluate problem-solving strategies for green and reverse logistics barriers. The comparative analysis across methods produced consistent priority rankings and reinforced the reliability of FUCOM in strategic decision-making.
These studies demonstrated both the methodolAogical maturity of fuzzy-FUCOM variants and their practical applicability in decision-making domains rife with uncertainty, such as ergonomics, cybersecurity, and sustainable logistics.
Beyond pure decision‑analysis techniques, the literature acknowledged broader trends in port digitalization and system integration.
· “Port of the Future” and Standardization of Digital Services
Pagano et al. (2022) proposed the C‑Ports framework, a standardized package of digital services for “Port of the Future”. Their conceptual vector included vessels & navigation, e‑freight and intermodal logistics, passenger transport, and environmental sustainability, with a case study based on the Port of Livorno.
· Business Process Management Systems in Port Processes
Martín-Navarro et al. (2020) performed a systematic literature review on the use of Business Process Management Systems (BPMS) in ports. They concluded that applications of BPMS were notably scarce, resulting in a significant gap and area for future exploration.
· Digital Twins in Ports from Cross‑Domain Insights
Klar et al. (2023) reviewed digital twin frameworks across smart cities and supply chains and identified their potential application in ports. They emphasized three core requirements for port digital twins: situational awareness, data analytics for decision-making, and interfaces supporting multi-stakeholder governance.
These studies established the context of ongoing digital transformation and operational modernization in port environments, which was directly relevant to the adoption and evaluation of LIS.
The reviewed literature demonstrated that:
1. Fuzzy MCDM methods (e.g., F‑AHP, F‑ANP, fuzzy TOPSIS, IVFE hybrids) were aptly applied in the assessments of port performance, service quality, capacity upgrades, and intangible resources;
2. F‑FUCOM and its variants have been successfully employed in logistics platform location selection, ergonomic risk, and cyber risk assessments under uncertainty;
3. Conceptual and process modernization frameworks for ports (e.g., digital service standardization, BPMS, digital twins) are emerging but still underutilized empirically;
4. No study to date has combined or applied fuzzy‑FUCOM with fuzzy RAWEC to systematically evaluate LIS in port operation, particularly in the Black Sea region.
These lacunae suggested obvious methodological and contextual gaps, namely: (a) the absence of dual fuzzy‑MCDM techniques (i.e., FUCOM and RAWEC) in the evaluation of port logistics systems; and (b) the lack of regionally focused empirical research on the effectiveness of LIS in Black Sea ports.
An overview of the thematic synthesis of fuzzy MCDM and port digitalization studies is presented in Table 1.
Theme | Representative Studies | Key Contributions |
Fuzzy MCDM in Ports | Nguyen et al. (2022); Wang & Chao (2022); Pak et al. (2015); Wang et al. (2022b) | Methodological use of F‑AHP, F‑ANP, fuzzy TOPSIS, and IVFE hybrids for port service/performance evaluation |
Fuzzy‑FUCOM Innovations | Ayadi et al. (2021); Tatar et al. (2025); Kayişoğlu et al. (2024); Derse (2024) | Application of F‑FUCOM in logistics platform location, ergonomic risk, cybersecurity, and green solutions |
Port Digitalization and Systems | Pagano et al. (2022); Martín-Navarro et al. (2020); Klar et al. (2023) | Conceptual frameworks for smart ports, process management, and digital twins |
Gaps for the Current Study | — | No research combining fuzzy‑FUCOM and RAWEC to evaluate LIS in the context of Black Sea ports |
The preceding literature review underscored the relevance of fuzzy-based MCDM techniques for evaluating complex logistical systems under uncertainty. It did not only highlight significant progress in applying such methods to port operation, but also revealed notable gaps. Indeed, there was a lack of integrated application of F‑FUCOM and fuzzy RAWEC, and a striking deficiency in regional studies on the performance of LIS in the Black Sea context. Addressing these gaps, the present study pioneered the application of dual fuzzy MCDM methods, FUCOM and RAWEC, to evaluate the effectiveness of LIS in enhancing port operational efficiency across the Black Sea region.
3. Methodology
The section of methodology consists of two parts, with F-FUCOM and its calculation steps stated in the first part, and fuzzy RAWEC explained in the second.
Full Consistency Method (FUCOM) proposed by Pamucar et al. (2018) considers the weight coefficients related to criteria in terms of specified hierarchy and takes consistency into account with respect to comparison. FUCOM applies simple algorithm including smaller number of binary comparisons in order to obtain the criteria weights (Demir et al., 2022). Consider that there are $n$ evaluation criteria represented as $w_j, j=1,2, \ldots, n$ and their weight coefficients need to be computed for an MCDM problem. According to the subjective models, decision makers need to identify the degree of impact of criterion $i$ over criterion $j$ which is stated as the value of comparison $\left(a_{i j}\right)$ with respect to acquire the weights of criteria based on binary comparison. The obtained $a_{i j}$ values are not solely based on precise measurements. The fuzzy numbers will be applied to address the uncertainties occurred in terms of subjective estimates. For this purpose, a fuzzy linguistic scale consisting of triangular fuzzy numbers, in Table 2, is taken into account for presenting the preferences of decision makers in terms of F-FUCOM (Demir et al., 2022; Pamucar & Ecer, 2020).
Linguistic Values | Triangular Fuzzy Numbers |
Equally important (EI) | (1,1,1) |
Weakly important (WI) | (2/3,1,3/2) |
Fairly important (FI) | (3/2,2,5/2) |
Very important (VI) | (5/2,3,7/2) |
Absolutely important (AI) | (7/2,4,9/2) |
The algorithm related to F-FUCOM can be summarized in the following four steps (Demir et al., 2022; Pamucar & Ecer, 2020):
Step 1. Determining the criteria: Consider that there are $n \;(j=1,2, \ldots, n)$ evaluation criteria that are shown by $C_j=\left\{C_1, C_2, \ldots, C_n\right\}$.
Step 2. Ranking the criteria: Criteria are ranked according to the preferences of decision makers. Decision makers assign the first rank to a criterion that is expected to have the highest value related to the weight coefficient. Accordingly, the last place are assigned by decision makers to a criterion that is expected to have the lowest value in terms of weight coefficient. Thus the criteria ranking is acquired according to Eq. (1).
where, the rank related to the evaluated criterion shown as $k$. If two or more criteria have the same rankings, the “ = ” sign is placed between the criteria instead of “ > ”.
Step 3. Making comparisons related to the criteria via triangular fuzzy numbers: Comparisons related to the criteria are made by using Table 1. The comparison is made in terms of the first-ranked (most important) criterion. Thus, the significance related to fuzzy criterion $\left(\widetilde{\omega}_{c_{j(k)}}\right)$ is acquired for all the criteria that are ranked in Step 2. Since the first-ranked criterion is compared to itself (its importance $\widetilde{\omega}_{C_{j(1)}}:$ equally important), the $n-1$ comparisons related to the remaning criteria need to be made. According to the identified significance with respect to criteria, fuzzy comparative significance $\left(\tilde{\varphi}_{k /(k+1)}\right)$ is obtained via Eq. (2).
Thus, a fuzzy vector related to the comparative significance for the evaluation criteria is acquired via Eq. (3).
where, $\tilde{\varphi}_{k /(k+1)}$ shows the significance in terms of the rank of criterion $C_{j(k)}$ with respect to criterion $C_{j(k+1)}$.
Step 4. Computing the optimum fuzzy weights: The final values related to the fuzzy weight coefficients for the criteria $\left(\widetilde{w}_1, \widetilde{w}_2, \ldots, \widetilde{w}_n\right)^T$ are computed. The final values related to the weight coefficients need to satisfy the conditions stated as Eqs. (4) and (5).
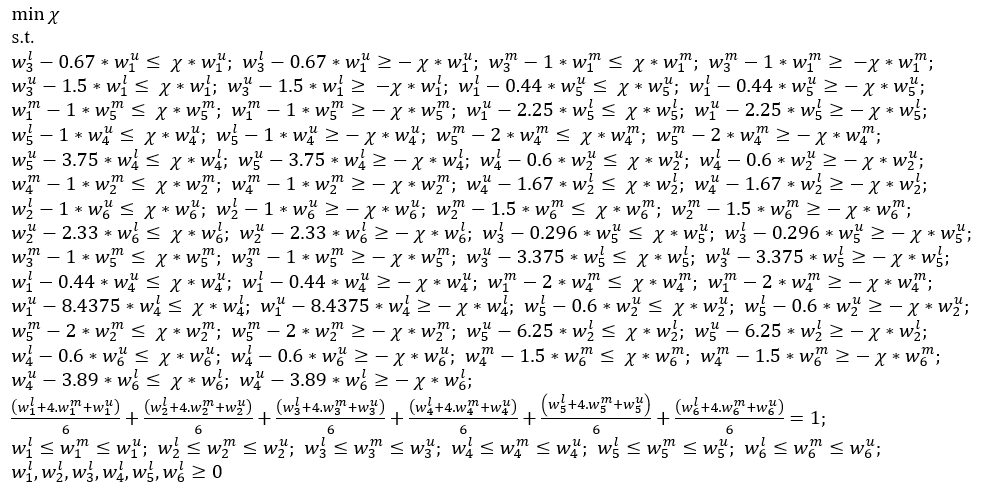
In order to satisfy the aforementioned conditions, the values related to the weight coefficients $\left(\widetilde{w}_1, \widetilde{w}_2, \ldots, \widetilde{w}_n\right)^T$ need to meet the states of $\left|\frac{\tilde{w}_k}{\tilde{w}_{k+1}}-\tilde{\varphi}_{k /(k+1)}\right| \leq \chi$ and $\left|\frac{\tilde{w}_k}{\tilde{w}_{k+2}}-\tilde{\varphi}_{k /(k+1)} \otimes \tilde{\varphi}_{(k+1) /(k+2)}\right| \leq \chi$ with minimizing the value of $\chi$. The maximum consistency requirement is executed by this way. According to the identified settings, the final nonlinear model for determining the optimal fuzzy values related to the weight coefficients of the evaluation criteria $\left(\widetilde{w}_1, \widetilde{w}_2, \ldots, \widetilde{w}_n\right)^T$ can be shown as Eq. (6).
where, $\widetilde{w}_j=\left(w_j^l, w_j^m, w_j^u\right)$ and $\tilde{\varphi}_{k /(k+1)}=\left(\mid \varphi_{k /(k+1)}^l, \varphi_{k /(k+1)}^m, \varphi_{k /(k+1)}^u\right)$.
The model given in Eq. (6) can be converted into a fuzzy linear model shown as Eq. (7).
where, $\widetilde{w}_j=\left(w_j^l, w_j^m, w_j^u\right)$ and $\tilde{\varphi}_{k /(k+1)}=\left(\varphi_{k /(k+1)}^l, \varphi_{k /(k+1)}^m, \varphi_{k /(k+1)}^u\right)$.
Rough Analytical Weighted Evaluation Criteria (RAWEC) proposed by Puška et al. (2024a) aims to rank the alternatives according to the weighted deviations. RAWEC method has simple and less computational procedure and considers double normalization approach by acquiring benefit and cost criteria separately in order to provide balanced data treatment. Besides, RAWEC can be adaptable to dynamic data, maintain rank consistency by preventing rank reversal problems and proves robust in sensitivity analysis despite changes in criteria weights. Qualitative and quantitative criteria types are suuported by RAWEC method and the obtained results vary between -1 and 1 (Demir & Chatterjee, 2025). In order to handle imprecise, vague and uncertain information related to decision makers’ judgements and address real-world decision-making problems, fuzzy extension of RAWEC was developed by Nedeljković et al. (2024). The steps of fuzzy RAWEC can be stated as follows (Demir & Chatterjee, 2025; Katrancı et al., 2025; Nedeljković et al., 2024; Puška et al., 2024b):
Step 1: Alternatives are assessed by decision makers according to the linguistic values given in Table 3.
Following to that evaluation matrices are formed by transforming the linguistic values into the corresponding fuzzy numbers in terms of each decision maker’s judgement. Then the average fuzzy decision matrix $(\tilde{X})$ is acquired by averaging the values in evaluation matrices and can be seen in Eq. (8).
$\tilde{x}_{i j}=\left(x_{i j}^l, x_{i j}^m, x_{i j}^u\right)$ shows the average fuzzy value for jth criterion related to ith alternative.
Linguistic Values | Fuzzy Numbers |
Very bad (VB) | (0,0,1) |
Bad (B) | (0,1,3) |
Medium bad (MB) | (1,3,5) |
Medium (M) | (3,5,7) |
Medium good (MG) | (5,7,9) |
Good (G) | (7,9,10) |
Very good (VG) | (9,10,10) |
Step 2: The two types of normalization consisting of maximum and minimum are applied for normalizing the average fuzzy decision matrix $(\tilde{X})$. Maximum normalization is performed for benefit and cost criteria via Eqs. (9) and (10) respectively.
Accordingly, minimum normalization is carried out for benefit and cost criteria by using Eqs. (11) and (12).
where, $x_{j \min }$ represents the minimum value related to a given criterion, $x_{j \max }$ denotes the maximum value for a given criterion.
Step 3: By using the weights acquired from the fuzzy FUCOM, the deviation value from these weights is computed via Eqs. (13) and (14). This process consists of summing the deviations related to all alternatives.
Step 4: The fuzzy numbers are transformed into crisp numbers via Eqs. (15) and (16) in terms of the defuzzification of the deviation from the criterion weight.
Step 5: Final value related to the RAWEC method $\left(Q_i\right)$ which takes value between -1 and 1 is acquired according to Eq. (17).
While the best alternative has a value closest to 1, the worst alternative takes a value closest to -1. According to these values, alternatives are ranked in descending order.

Figure 1 illustrates the integrated fuzzy FUCOM–RAWEC framework used in this study. FUCOM determines the relative importance of evaluation criteria, while RAWEC processes expert assessments to rank alternatives under uncertainty. Validation is proceeded with sensitivity, comparison, and rank-reversal analyses.
4. Case Study
The related information of criteria and alternatives considered for the case study is presented in Table 4 and Table 5, respectively.
Linguistic judgements related to the criteria are determined by decision makers (DMs) in Table 6.
In order to show the computational steps of fuzzy FUCOM method, calculations related to fuzzy weight coefficients of the criteria for DM1 are taken into account. According to Eq. (2), fuzzy comparative significance related to the criteria is determined as follows:
$\begin{aligned} & \tilde{\varphi}_{C 3 / C 1}=\frac{\tilde{w}_{C 3}}{\tilde{w}_{C 1}}=\frac{\left(\frac{2}{3}, 1, \frac{3}{2}\right)}{(1,1,1)}=(0.67,1,1.5) \\ & \tilde{\varphi}_{C 1 / C 5}=\frac{\tilde{w}_{C 1}}{\tilde{w}_{C 5}}=\frac{\left(\frac{2}{3}, 1, \frac{3}{2}\right)}{\left(\frac{2}{3}, 1, \frac{3}{2}\right)}=(0.44,1,2.25) \\ & \tilde{\varphi}_{C 5 / C 4}=\frac{\tilde{w}_{C 5}}{\tilde{w}_{C 4}}=\frac{\left(\frac{3}{2}, 2, \frac{5}{2}\right)}{\left(\frac{2}{3}, 1, \frac{3}{2}\right)}=(1,2,3.75) \\ & \tilde{\varphi}_{C 4 / C 2}=\frac{\tilde{w}_{C 4}}{\tilde{w}_{C 2}}=\frac{\left(\frac{3}{2}, 2, \frac{5}{2}\right)}{\left(\frac{3}{2}, 2, \frac{5}{2}\right)}=(0.6,1,1.67) \\ & \tilde{\varphi}_{C 2 / C 6}=\frac{\tilde{w}_{C 2}}{\tilde{w}_{C 6}}=\frac{\left(\frac{5}{2}, 3, \frac{7}{2}\right)}{\left(\frac{3}{2}, 2, \frac{5}{2}\right)}=(1,1.5,2.33) \end{aligned}$
The vector of comparative significance is identified based on Eq. (3) below:
$\widetilde{\Phi}=((0.67,1,1.5),(0.44,1,2.25),(1,2,3.75),(0.6,1,1.67),(1,1.5,2.33))$
The relationship is acquired from four restrictions in terms of transitivity via Eq. (5).
$\begin{aligned} & \frac{\tilde{w}_{C 3}}{\tilde{w}_{C 5}}=(0.67,1,1.5) \otimes(0.44,1,2.25)=(0.296,1,3.375) \\ & \frac{\tilde{w}_{C 1}}{\tilde{w}_{C 4}}=(0.44,1,2.25) \otimes(1,2,3.75)=(0.44,2,8.4375) \\ & \frac{\tilde{w}_{C 5}}{\tilde{w}_{C 2}}=(1,2,3.75) \otimes(0.6,1,1.67)=(0.6,2,6.25) \\ & \frac{\tilde{w}_{C 4}}{\tilde{w}_{C 6}}=(0.6,1,1.67) \otimes(1,1.5,2.33)=(0.6,1.5,3.89)\end{aligned}$
Criteria | Code | Descriptions | References |
Operational efficiency | C1 | The degree to which port operation (e.g. cargo handling, berth and quay operation, turnaround times, throughput, reliability of operations, etc.) were carried out with minimal delay, high productivity, and optimal utilization of resources such as equipment, labour, space, and time. | Wang et al., (2022b); Danladi et al., (2024) |
Cost effectiveness | C2 | The extent to which LIS or port operation delivered value for money: minimizing costs (capital, operating), maximizing return on investment, reducing unnecessary expenditures on operation, maintenance, and delay, as well as considering the total cost of ownership. | Fahim et al., (2022); Sooprayen et al., (2024) |
Technological competence | C3 | Port’s ability to deploy, integrate, maintain, and update information systems and technologies, including the maturity of IT infrastructure, digital tools, automation, data management, technological innovation, compatibility with new technologies. | Fahim et al., (2022); Klar et al., (2023) |
Regulatory/adaptation support | C4 | The extent to which regulatory environment, policy, institutional frameworks, standards, compliance, and adaptability (ability of a system to respond to regulatory changes) supported the implementation and use of LIS in port operation. | Alamoush et al., (2021); Su et al., (2024) |
User compatibility/adaptability | C5 | The degree to which LIS was compatible with users’ needs (port staff, shipping lines, hinterland partners, customs, etc.), ease of adaptation, usability, flexibility, integration with existing workflows, and adaptability to changing demands or context. | Martín-Navarro et al., (2020) |
Sustainability effect | C6 | Environmental, social, and economic sustainability impacts of the usage of LIS: reduction in emissions, energy savings, social welfare, long‑term viability, alignment with global goals (e.g., the UN SDGs), resilience, and ecological impact. | Vaca-Cabrero et al., (2025); Lim et al., (2019) |
Following to this fuzzy linear model created for obtaining fuzzy values related to the weight coefficients of the criteria and presented below in accordance with Eq. (7). $l, m$ and $u$ triangles in the following equation show the lower, middle, and upper values related to fuzzy number respectively.
Similar calculations are made for other DMs (DM2-DM8). The aforementioned fuzzy linear model is solved via LINGO 21.0 software and the obtained fuzzy weights related to the criteria are presented in Table 7.
Alternatives | Code | Descriptions | References |
Port community systems | A1 | Integrated information platforms that facilitated data exchange among all stakeholders such as port authorities, shipping lines, terminal operators, customs, and hinterland transport to streamline maritime trade and port operation; they helped cargo manifests, customs clearance, scheduling, and communication among various parties. | Caldeirinha et al., (2022) |
Terminal operating systems | A2 | Systems used at the port terminal level to manage operation such as yard management, gating, equipment deployment (cranes, trucks), vessel berthing, yard planning, and container stacking; TOS aimed to optimize resource usage, reduce delay and improve throughput. | Hervás-Peralta et al., (2019); Sahraoui et al., (2023) |
Blockchain based commercial platforms | A3 | Use of blockchain distributed ledger technologies (commercial or consortia platforms) in port logistics to enable secure, transparent, tamper‑proof transaction recording, smart contracts, tracing, and digital trust among stakeholders. | Durán et al., (2024); Liu et al., (2023); Ahmad et al., (2021) |
Internet of things (IoT) supported smart port systems | A4 | Systems leveraging sensors, devices, connectivity, data analytics to monitor and control port infrastructure and operation in real time (e.g. equipment status, environmental conditions, asset tracking, energy usage, etc.), contributing to operational visibility, predictive maintenance, and automation. | Min, (2022); Yang & Hsieh, (2024). |
Cloud supported logistic management systems | A5 | Logistics management systems delivered via cloud platforms; these included software/services for managing logistics processes (inventory, transport, scheduling, data sharing) accessible via cloud computing; offered scalability, remote accessibility, faster deployment, and lower infrastructure requirements. | Choudary et al., (2019) |
Decision Makers (DMs) | Rank (R) and Comparisons (C) | Criteria |
DM1 | R C | C3 > C1 > C5 > C4 > C2 > C6 EI, WI, WI, FI, FI, VI |
DM2 | R C | C1 > C3 > C4 > C5 > C2 > C6 EI, WI, FI, VI, VI, AI |
DM3 | R C | C5 > C1 > C3 > C6 > C2 > C4 EI, FI, VI, VI, VI, AI |
DM4 | R C | C4 > C6 > C5 > C1 > C2 > C3 EI, WI, WI, VI, VI, VI |
DM5 | R C | C3 > C1 > C4 > C5 > C6 > C2 EI, WI, WI, FI, FI, VI |
DM6 | R C | C3 > C2 > C5 >C4 >C1 >C6 EI, WI, FI, VI, AI, AI |
DM7 | R C | C4 > C2 > C5 > C3 > C1 > C6 EI, WI, FI, FI, VI, AI |
DM8 | R C | C3 > C1 > C6 > C2 > C4 > C5 EI, WI, FI, VI, VI, AI |
C1 | C2 | C3 | C4 | C5 | C6 | $\chi$ | |
DM1 | 0.156,0.300,0.442 | 0.049,0.057,0.100 | 0.300,0.300,0.365 | 0.058,0.106,0.123 | 0.143,0.164,0.266 | 0.039,0.046,0.046 | 0.008 |
DM2 | 0.155,0.308,0.341 | 0.044,0.125,0.125 | 0.156,0.307,0.307 | 0.069,0.114,0.114 | 0.038,0.092,0.092 | 0.050,0.141,0.141 | 0.006 |
DM3 | 0.201,0.201,0.284 | 0.105,0.105,0.120 | 0.105,0.108,0.173 | 0.064,0.064,0.090 | 0.322,0.329,0.577 | 0.098,0.108,0.186 | 0.003 |
DM4 | 0.074,0.074,0.162 | 0.070,0.070,0.123 | 0.057,0.057,0.057 | 0.001,0.027,0.639 | 0.258,0.258,0.457 | 0.266,0.266,0.812 | 0.008 |
DM5 | 0.120,0.267,0.339 | 0.030,0.141,0.147 | 0.154,0.279,0.279 | 0.110,0.204,0.204 | 0.044,0.094,0.094 | 0.037,0.097,0.097 | 0.008 |
DM6 | 0.031,0.085,0.101 | 0.137,0.281,0.281 | 0.151,0.295,0.307 | 0.035,0.079,0.079 | 0.062,0.107,0.107 | 0.050,0.133,0.723 | 0.007 |
DM7 | 0.040,0.086,0.086 | 0.157,0.308,0.308 | 0.055,0.122,0.122 | 0.176,0.344,0.344 | 0.069,0.130,0.130 | 0.034,0.093,0.128 | 0.006 |
DM8 | 0.156,0.307,0.307 | 0.038,0.092,0.092 | 0.155,0.308,0.341 | 0.044,0.125,0.125 | 0.050,0.141,0.141 | 0.069,0.114,0.114 | 0.006 |
After solving the constrained fuzzy linear model stated in Eq. (7) for each decision maker’s preference, the weight values for the criteria are aggregated via the Triangular Fuzzy Dombi-Bonferroni mean (TFDBM) operator. Consider $\tilde{E}_j=\left(e l_j, e m_j, e u_j\right) ;(j=1,2, \ldots, n)$ as a set of TFNs in $\Re$. Then, TFDBM operator is stated according to Eq. (18) (Pamucar et al., 2020):
The fuzzy function is shown by $\operatorname{TFDBM} M^{p, q, \rho}\left(\tilde{E}_1, \tilde{E}_2, \ldots, \tilde{E}_n\right)= where f\left(\tilde{E}_j\right)=\left(f\left(e l_j\right), f\left(e m_j\right), f\left(e u_j\right)\right)= \left(\frac{e l_j}{\sum_{i=1}^n e l_j}, \frac{e m_j}{\sum_{i=1}^n e m_j}, \frac{e u_j}{\sum_{i=1}^n e u_j}\right)$.
Following to that, the aggregated fuzzy numbers are defuzzified. In order to obtain the crisp weight values for criteria, the graded mean integration representation (GMIR) is taken into account. Suppose $\tilde{M}_j=\left(l_j, m_j, u_j\right)$ and the GMIR $R\left(\tilde{M}_j\right)$ of TFN $\tilde{M}_j$ is computed according to Eq. (19) (Chou, 2003; Pamucar et al., 2020):
The aggregated fuzzy weights and crisp weight values related to the criteria are presented in Table 8.
According to Table 7, while technological competence (C3) was found as the most significant criterion with the value of 0.2088, cost effectiveness (C2) was acquired as the least essential one with the value of 0.1387. The ranking of other criteria can be stated as operational efficiency (C1) > user compatibility/adaptability (C5) > sustainability effect (C6) > regulatory/adaptation support (C4).
After obtaining the fuzzy weights of the criteria, these weights are utilized in fuzzy RAWEC to acquire the ranking results related to the alternatives.
Criteria | Aggregated Fuzzy Weights | Crisp Weights | Ranking |
C1 | 0.3490, 0.6076, 0.7678 | 0.1955 | 2 |
C2 | 0.2387, 0.4481, 0.4852 | 0.1387 | 6 |
C3 | 0.4251, 0.6598, 0.7237 | 0.2088 | 1 |
C4 | 0.2149, 0.4100, 0.6803 | 0.1397 | 5 |
C5 | 0.3883, 0.4921, 0.7228 | 0.1697 | 3 |
C6 | 0.2610, 0.3739, 0.9179 | 0.1474 | 4 |
In terms of fuzzy RAWEC, the initial linguistic decision matrix for alternatives is constructed by taking Table 2 into account and presented below. The aggregated language assessments provided by the expert panel were compiled into a fuzzy language matrix (see Table 9). These assessments were then converted into fuzzy numbers and processed in the fuzzy RAWEC framework for further analysis.
DM1 | C1 | C2 | C3 | C4 | C5 | C6 |
A1 A2 A3 A4 A5 | G G M VG G | M MB MB MG G | G G G VG VG | MB M M VG G | M M MG G VG | M MB M M M |
DM2 | C1 | C2 | C3 | C4 | C5 | C6 |
A1 A2 A3 A4 A5 | G VG G MG MG | MG G MG M VG | B MB B VB M | VG VG G MG MG | G VG G MG M | MB M MB B MG |
DM3 | C1 | C2 | C3 | C4 | C5 | C6 |
A1 A2 A3 A4 A5 | G VG G MG VG | G VG G MG M | MG G MG M VG | MG G MG M VG | MG G MG M VG | M MG M MB G |
DM4 | C1 | C2 | C3 | C4 | C5 | C6 |
A1 A2 A3 A4 A5 | G VG G MG VG | M MG M MB G | MB M MB B MG | MG G MG M VG | VG VG VG G MG | B MB B VB M |
DM5 | C1 | C2 | C3 | C4 | C5 | C6 |
A1 A2 A3 A4 A5 | MG G MG M VG | B MB B VB M | M MG M MB G | VG VG VG G MG | G VG G MG M | MB M MB B MG |
DM6 | C1 | C2 | C3 | C4 | C5 | C6 |
A1 A2 A3 A4 A5 | VG G VG VG MG | B MB B VB M | VG VG VG G MG | MG G MG M VG | MB M MB B MG | M MG M MB G |
DM7 | C1 | C2 | C3 | C4 | C5 | C6 |
A1 A2 A3 A4 A5 | VG VG G VG MG | VG VG VG G MG | MB M MG MB B | M MG M G MB | MG G MG M MB | VB B VB VB MB |
DM8 | C1 | C2 | C3 | C4 | C5 | C6 |
A1 A2 A3 A4 A5 | G MG G VG M | MB M MB B MG | MG G MG M MB | VG VG VG G MG | M MG M MB G | VG VG VG G MG |
Following to that, the average fuzzy decision matrix is obtained in Eq. (8) and given in Table 10.
| C1 | C2 | C3 | C4 | C5 | C6 |
A1 | 7.25,9,9.875 | 3.5,5.125,6.75 | 3.875,5.625,7.25 | 5.75,7.375,8.625 | 5,6.875,8.375 | 25,4,5.625 |
A2 | 7.75,9.25,9.875 | 4.5,6.25,7.625 | 5.25,7.125,8.5 | 7,8.625,9.5 | 6.5,8.125,9.125 | 3.375,5.125,6.875 |
A3 | 6.5,8.375,9.5 | 3.25,4.875,6.5 | 4.375,6.125,7.75 | 5.75,7.5,8.875 | 5.25,7.125,8.625 | 2.5,4,5.625 |
A4 | 6.75,8.25,9.25 | 2.625,4,5.625 | 3,4.5,6 | 5.5,7.375,8.75 | 3.875,5.75,7.5 | 1.5,2.75,4.375 |
A5 | 6.5,8.125,9.25 | 5.25,7.125,8.625 | 4.875,6.5,7.875 | 6.25,7.875,9 | 5.25,7,8.375 | 4.5,6.5,8.25 |
Min | 6.5,8.125,9.25 | 2.625,4,5.625 | 3,4.5,6 | 5.5,7.375,8.625 | 3.875,5.75,7.5 | 1.5,2.75,4.375 |
Max | 7.75,9.25,9.875 | 5.25,7.125,8.625 | 5.25,7.125,8.5 | 7,8.625,9.5 | 6.5,8.125,9.125 | 4.5,6.5,8.25 |
After the normalization process of forming the average fuzzy decision matrix is performed. Since all criteria are benefit-based, the maximum normalization matrix is obtained via Eq. (9) and presented in Table 11.
| C1 | C2 | C3 | C4 | C5 | C6 |
A1 | 0.734,0.911,1 | 0.405,0.594,0.782 | 0.455,0.661,0.852 | 0.605,0.776,0.907 | 0.547,0.753,0.917 | 0.303,0.484,0.681 |
A2 | 0.784,0.936,1 | 0.521,0.724,0.884 | 0.617,0.838,1 | 0.736,0.907,1 | 0.712,0.890,1 | 0.409,0.621,0.833 |
A3 | 0.658,0.848,0.962 | 0.376,0.565,0.753 | 0.514,0.720,0.911 | 0.605,0.789,0.934 | 0.575,0.780,0.945 | 0.303,0.484,0.681 |
A4 | 0.683,0.835,0.936 | 0.304,0.463,0.652 | 0.352,0.529,0.705 | 0.578,0.776,0.921 | 0.424,0.630,0.821 | 0.181,0.333,0.530 |
A5 | 0.658,0.822,0.936 | 0.608,0.826,1 | 0.573,0.764,0.926 | 0.657,0.828,0.947 | 0.575,0.767,0.917 | 0.545,0.787,1 |
Accordingly, the minimum normalization matrix is acquired by applying Eq. (11) and given in Table 12.
| C1 | C2 | C3 | C4 | C5 | C6 |
A1 | 0.658,0.722,0.896 | 0.388,0.512,0.750 | 0.413,0.533,0.774 | 0.637,0.745,0.956 | 0.462,0.563,0.775 | 0.266,0.375,0.600 |
A2 | 0.658,0.702,0.838 | 0.344,0.420,0.583 | 0.352,0.421,0.571 | 0.578,0.637,0.785 | 0.424,0.476,0.596 | 0.218,0.292,0.444 |
A3 | 0.684,0.776,1 | 0.403,0.538,0.807 | 0.387,0.489,0.685 | 0.619,0.733,0.956 | 0.449,0.543,0.738 | 0.266,0.375,0.600 |
A4 | 0.702,0.787,0.962 | 0.466,0.656,1 | 0.500,0.666,1 | 0.628,0.745,1 | 0.516,0.673,1 | 0.342,0.545,1 |
A5 | 0.702,0.800,1 | 0.304,0.368,0.500 | 0.380,0.461,0.615 | 0.611,0.698,0.880 | 0.462,0.553,0.738 | 0.181,0.230,0.333 |
Then, deviations from the maximum criterion weights are computed via Eq. (13) and presented in Table 13.
| C1 | C2 | C3 | C4 | C5 | C6 |
A1 | 0,0.053,0.204 | 0.051,0.181,0.288 | 0.062,0.223,0.393 | 0.019,0.091,0.268 | 0.031,0.121,0.326 | 0.083,0.192,0.639 |
A2 | 0,0.038,0.165 | 0.027,0.123,0.232 | 0,0.106,0.276 | 0,0.037,0.179 | 0,0.053,0.207 | 0.043,0.141,0.542 |
A3 | 0.013,0.092,0.262 | 0.058,0.194,0.302 | 0.037,0.184,0.351 | 0.014,0.086,0.268 | 0.021,0.107,0.306 | 0.083,0.192,0.639 |
A4 | 0.022,0.099,0.243 | 0.083,0.240,0.337 | 0.125,0.310,0.468 | 0.016,0.091,0.286 | 0.069,0.182,0.415 | 0.122,0.249,0.751 |
A5 | 0.022,0.107,0.262 | 0,0.077,0.189 | 0.031,0.155,0.308 | 0.011,0.070,0.232 | 0.031,0.114,0.306 | 0,0.079,0.417 |
Similarly, deviations from the minimum criterion weights are obtained by using Eq. (14) and given in Table 14.
| C1 | C2 | C3 | C4 | C5 | C6 |
A1 | 0.036,0.168,0.262 | 0.059,0.218,0.296 | 0.095,0.307,0.424 | 0.009,0.104,0.246 | 0.087,0.214,0.388 | 0.104,0.233,0.673 |
A2 | 0.056,0.180,0.262 | 0.099,0.259,0.318 | 0.182,0.382,0.468 | 0.046,0.148,0.286 | 0.156,0.257,0.415 | 0.145,0.264,0.717 |
A3 | 0,0.136,0.242 | 0.045,0.206,0.289 | 0.133,0.336,0.443 | 0.009,0.109,0.258 | 0.101,0.224,0.398 | 0.104,0.233,0.673 |
A4 | 0.012,0.128,0.228 | 0,0.154,0.258 | 0,0.219,0.361 | 0,0.104,0.252 | 0,0.160,0.349 | 0,0.169,0.603 |
A5 | 0,0.121,0.228 | 0.119,0.283,0.337 | 0.163,0.355,0.448 | 0.025,0.123,0.264 | 0.101,0.219,0.388 | 0.174,0.287,0.751 |
Deviation values from the criteria weights are defuzzified via Eqs. (15) and (16). Besides, final values related to RAWEC method is computed by applying Eq. (17) and presented in Table 15.
Alternative | $\widetilde{v}_{i j}$ | $v_{i j}$ | $\left(\widetilde{v}_{i j}\right)^{\prime}$ | $v_{i j}^{\prime}$ | $Q_i$ | Rank |
A1 | 0.249,0.864,2.121 | 0.971 | 0.392,1.248,2.291 | 1.279 | 0.136 | 4 |
A2 | 0.071,0.501,1.603 | 0.613 | 0.685,1.493,2.468 | 1.521 | 0.425 | 1 |
A3 | 0.228,0.858,2.131 | 0.965 | 0.395,1.247,2.305 | 1.281 | 0.140 | 3 |
A4 | 0.438,1.173,2.502 | 1.272 | 0.012,0.937,2.054 | 0.969 | -0.135 | 5 |
A5 | 0.096,0.604,1.717 | 0.705 | 0.584,1.390,2.417 | 1.427 | 0.338 | 2 |
According to Table 15, while terminal operating systems (A2) was found as the most important alternative, Internet of Things supported smart port systems (A4) was obtained as the least essential one. The ranking of alternatives can be stated as A2>A5>A3>A1>A4.
5. Validation of Results
The acquired results related to fuzzy RAWEC method were validated in three stages. While the obtained results via fuzzy RAWEC method were compared with other MCDM methods in the first stage, the sensitivity analysis was performed with changing the coefficients related to criteria weights in the second stage. Ranks reversal analysis was carried out in the last stage.
Figure 2 shows the variation in ranking the position of each LIS alternative across 30 scenarios with modified criteria weights. The chart highlights the consistent top ranking of A2 and the stable lower ranking of A4, thus confirming the robustness of the model under weight perturbations.
In order to check the stability and validity of the proposed model, a sensitivity analysis was conducted. Thirty different scenarios were formed to investigate the effect of criterion weight coefficients on the ranking results of the fuzzy FUCOM-fuzzy RAWEC model.
The current ranking results acquired via the proposed model in the first scenario, S0, are presented. The other scenarios (S1-S30) were formed by reducing the relevant criterion weights by %10, %30, %50, %70 and %90. Eq. 20 proposed by Ecer (2022) was utilized for constructing the scenarios with new criterion weight coefficients.
Eq. (20) shows the newly computed weight coefficient values for the $w_{\text {yad }}$ criterion, while $w_{a d}$ presents the reduced (discounted) value related to the criterion. Besides, the original value of the criterion is represented by $w_{o d}$, while the original value of the criterion with the reduced (discounted) value is represented by $w_{\text {aod }}$. The results of the sensitivity analysis are depicted in Figure 3.
As can be seen from Figure 2, minor changes related to the ranking of alternatives were observed in the scenarios formed towards the changes of criterion weight coefficients. A2, A4, and A5 have maintained their rankings throughout the 30 scenarios. According to the findings, A2 remains the best alternative. However, A4 is the worst alternative in all 30 scenarios. A3 and A1 have not changed their positions except in scenarios 11-15, 19, 20, 22-25. As proposed by Ecer (2021) and Ecer et al. (2019), the ranking results of the proposed model and the 30 scenarios created using the proposed model were analysed using the Spearman rank correlation coefficient (SRCC). All correlation coefficients are greater than 0.9, indicating a high correlation between the ranking results of the proposed model and the ranking results of the different scenarios. The results obtained from the SRCC revealed that changes in the weights in different scenarios did not significantly affect the final ranking of the proposed approach.
In order to check the reliability of the ranking results acquired from the existing fuzzy FUCOM-fuzzy RAWEC method, a comparison analysis was performed with other MCDM methods, such as fuzzy AROMAN, fuzzy MARCOS, fuzzy WASPAS, fuzzy CRADIS, and fuzzy MAIRCA* in terms of the values of SRCC. In Table 16, the comparison analysis provided acquired values of SRCC for different methods whereas the ranking results of the analysis are displayed in Figure 4.
FRAWEC | FAROMAN | FMARCOS | FWASPAS | FCRADIS | FMAIRCA | |
FRAWEC | 1.00 | |||||
FAROMAN | 0.90 | 1.00 | ||||
FMARCOS | 1.00 | 0.90 | 1.00 | |||
FWASPAS | 0.90 | 1.00 | 0.90 | 1.00 | ||
FCRADIS | 1.00 | 0.90 | 1.00 | 0.90 | 1.00 | |
FMAIRCA | 1.00 | 0.90 | 1.00 | 0.90 | 1.00 | 1.00 |
According to the comparison analysis in Figure 4, alternatives A2, A4, and A5 have the same ranking position for all the different methods. For A1, FRAWEC, FMARCOS, FCRADIS, and FMAIRCA were in the fourth rank, whereas FAROMAN and FWASPAS were in the third rank. Besides, while A3 put FRAWEC, FMARCOS, FCRADIS, and FMAIRCA in the third rank, FAROMAN and FWASPAS were in the fourth rank. Considering Table 15, the average value of SRCC derived from comparing fuzzy RAWEC method with other MCDM techniques was 0.96. According to the obtained values of SRCC, a statistically significant (at the level of 1%) and high correlation was found between the fuzzy RAWEC method and other MCDM techniques. This situation attested to the validity, applicability, and reliability of the proposed model. In other words, the proposed fuzzy FUCOM-fuzzy RAWEC model provided consistent results when compared with other MCDM techniques.
As the third step of the validation was related to the results, a rank reversal test was conducted to investigate whether the ranking results obtained from the existing model could give a stable response to sudden changes. The rank reversal test conducted in this study was based on the progressive deletion of sub-optimal alternatives and the checking of rankings for the remaining ones. For that purpose, six different scenarios were established and their ranking results are presented in Table 16. The first scenario (Scenario 0) was the initial ranking order acquired via the proposed fuzzy FUCOM-fuzzy RAWEC model. The other scenarios (Scenarios 1-4) were generated by progressively removing from the model the alternatives ranked last in the previous rankings one by one.
Scenarios | Ranking Order | ||||
Scenario 0 | A2 | A5 | A3 | A1 | A4 |
Scenario 1 | A2 | A5 | A3 | A1 | |
Scenario 2 | A2 | A5 | A3 | ||
Scenario 3 | A2 | A5 | |||
Scenario 4 | A2 | ||||
As can be seen from Table 17, the new ranking results indicate that A2 has remained the best alternative in all created scenarios. This result, which showed that the proposed model resisted the rank reversal problem, supported that the initial ranking was consistent and stable. It can be noted from Table 17 that the fuzzy RAWEC method provides valid results in a dynamic environment and that the model has a strong resistance to the problem of rank reversal. In all scenarios, the superiorities in the first ranking were maintained.
6. Conclusions
This study proposed an integrated fuzzy FUCOM–fuzzy RAWEC methodology to evaluate the most suitable LIS for enhancing port operational efficiency in the Black Sea Region of Türkiye. In the light of increasing digitalization pressures, growing trade volumes, and complex port stakeholder ecosystems, the role of LIS in improving operational outcomes, information integration, and strategic performance has become critical. Accordingly, five LIS alternatives, i.e., Port Community Systems (PCS), Terminal Operating Systems (TOS), Blockchain-Based Commercial Platforms, IoT-Supported Smart Port Systems, and Cloud-Supported Logistics Management Systems were assessed based on six decision criteria, which were operational efficiency, cost effectiveness, technological competence, regulatory support, user compatibility, and sustainability impact.
The fuzzy FUCOM method was employed to determine robust and consistent weights for the decision criteria under uncertainty, while the fuzzy RAWEC method facilitated the ranking of LIS alternatives by incorporating both individual and group evaluations in a fuzzy environment. The results revealed that Terminal Operating Systems (A2) emerged as the most effective alternative, followed by Cloud-Supported Systems (A5) and Blockchain-Based Platforms (A3). IoT-Supported Smart Port Systems (A4) consistently ranked lowest under the given criteria and expert preferences.
To ensure the robustness and credibility of the results, the model underwent a rigorous three-stage validation process. First, a sensitivity analysis was conducted by varying the criterion weights across 30 different scenarios. The stability of the rankings, especially the consistently top position of A2 and the bottom position of A4, demonstrated the resilience of the model to weight perturbations. Spearman Rank Correlation Coefficients (SRCCs) exceeding 0.9 further confirmed high consistency across the scenarios.
Second, a comparison analysis was performed by benchmarking the fuzzy RAWEC results against five other fuzzy MCDM methods: fuzzy AROMAN, fuzzy MARCOS, fuzzy WASPAS, fuzzy CRADIS, and fuzzy MAIRCA. The average SRCC value of 0.96 indicated a statistically significant and strong agreement, validating the reliability and consistency of the proposed hybrid model.
Third, a rank reversal test confirmed that the model was robust to dynamic shifts and sequential removal of lower-ranked alternatives. The stability of A2 across all reduced-alternative scenarios reaffirmed the consistency and internal validity of the fuzzy FUCOM–fuzzy RAWEC approach.
Taken together, these findings underscore the utility and methodological soundness of combining fuzzy FUCOM and fuzzy RAWEC in the evaluation of LIS, especially in settings involving complex decision environments, stakeholder uncertainties, and performance-based comparisons. The study contributed to both the theoretical development of fuzzy MCDM methodologies and the practical discourse on digital transformation in maritime logistics.
Future Directions:
Future research may extend this framework by:
· Incorporating dynamic or real-time data inputs into the MCDM framework via fuzzy time series or adaptive systems;
· Expanding the scope to include the challenges of multi-port or cross-border LIS integration in the Black Sea and Mediterranean corridors; and
· Evaluating the performance of LIS through empirical data collection post-implementation, thus enabling validation via performance metrics such as port throughput, cost savings, and carbon reductions.
The results offered practical recommendations for port authorities, policymakers, and digital platform providers striving to enhance port efficiency and competitiveness through strategic adoption of LIS.
The results of this study offered direct guidance to port authorities, terminal operators, and logistics policymakers in the Black Sea region and beyond. By identifying Terminal Operating Systems (TOS) as the most effective LIS under multiple criteria including operational efficiency, adaptability, and cost-effectiveness, decision-makers are better equipped to prioritize investments that yield measurable performance gains. Furthermore, the model could be adapted for application in other port contexts or during procurement processes, where multiple LIS options should be objectively compared under uncertainty.
From a methodological perspective, the integration of fuzzy FUCOM and fuzzy RAWEC addresses key limitations found in single-method MCDM approaches. FUCOM offers a consistency-based mechanism for deriving accurate criteria weights with fewer comparisons, while RAWEC incorporates fuzzy set theory and rough numbers to handle uncertain and imprecise expert judgments. Their combination not only enhances the accuracy and robustness of decision-making, but also offers a replicable, transparent, and adaptable framework for evaluating technology alternatives in port logistics and similar complex domains.
The data used to support the research findings are available from the author upon request.
The author declares no conflict of interest.