
 Open Access
Demographic Confounding and Sensor-Derived Salivary Dielectric Response Features in the Exasens Dataset

 View Full Article|
 Download PDF
Abstract:
Binary chronic obstructive pulmonary disease healthy control (COPD–HC) classification results in the Exasens dataset may be inflated by age and smoking-related structure. This exploratory secondary complete-case audit examined whether sensor-derived salivary dielectric response features provide internally predictive information beyond age, recorded sex/gender, and smoking status. The public Exasens dataset contained 399 records, of which 100 had complete salivary response measurements. Demographic only, salivary-response only, and combined feature sets were evaluated for binary COPD–HC and four-class label classification, using repeated stratified cross validation, limited overlap sensitivity analyses, calibration summaries, and SHapley Additive exPlanations (SHAP) based audits of model behavior. No independent external validation cohort was available. In the complete-case COPD–HC analysis, demographic only Logistic Regression achieved a balanced accuracy of 0.955 whereas the best salivary- response only model achieved 0.56. In the four-class complete-case task, combined Gradient Boosting achieved a balanced accuracy of 0.68 and a receiver operating characteristic–area under the curve (ROC–AUC) of 0.881. This represents exploratory internal separation, with performance strongest for chronic obstructive pulmonary disease (COPD) and healthy control (HC), moderate for infection-related cases, and weak for asthma. Matching and overlap weighting analyses did not support an independent COPD–HC contribution from salivary-response features, primarily because common support for age and smoking was poor. These findings should be interpreted as a secondary and hypothesis-generating dataset audit rather than validation of clinical prediction model. Transportability was uncertain under demographic shift or different salivary-response missingness structures. External validation, richer clinical metadata, and improved demographic and smoking overlap across groups are required before any diagnostic, screening, triage, risk-prediction, or clinical decision support could be considered.1. Introduction
Chronic obstructive pulmonary disease (COPD) remains a major clinical and public-health challenge because it is heterogeneous, progressive, and frequently under-recognized until clinically meaningful airflow limitation has already been developed. Recent reviews have emphasized that early COPD detection required methods to subtly integrate clinical, physiological, environmental, and patient-level risk information rather than relying on a single measurement or a single disease label [1], [2], [3]. This requirement is particularly important in authentic diagnostic settings, where COPD should be distinguished not only from healthy control (HC) but also from other respiratory conditions such as asthma and infection-related respiratory impairment. Consequently, multi-class respiratory classification is a more clinically demanding and informative problem than the frequently used binary COPD-versus-control setting.
Machine learning has increasingly been investigated for COPD screening, diagnosis, monitoring, and prognosis across imaging, capnography, respiratory signals, spirometry-related data, and multimodal clinical inputs [4], [5], [6], [7], [8], [9]. These studies not only supported the promise of artificial intelligence (AI) for respiratory medicine, but also demonstrated that model performance depended strongly on data modality, validation design, sample size, and the clinical definition of the target task.
The recent COPD artificial-intelligence literature has also warned against over-interpreting high internal performance. A systematic review and meta-analysis in The Lancet Digital Health reported that machine learning and deep learning prognostic models for COPD often faced incomplete uncertainty reporting, inadequate handling of missing data, small development datasets relative to feature dimensionality, and limited evidence of superiority over conventional scores [10]. Similarly, a 2025 systematic review on AI/ML prediction of COPD exacerbations and readmissions found moderate-to-high pooled discrimination but substantial heterogeneity, limited external validation, and frequent methodological concerns [11]. These findings suggested that respiratory machine-learning studies should not be evaluated only by peak accuracy; instead, they should explicitly examine robustness, risk of bias, feature-set contribution, and whether the model is learning disease-relevant signals or confounding structure.
In parallel with algorithmic advances, saliva has gained attention as a non-invasive diagnostic medium because it is easier to collect than blood and may support repeated and low-burden monitoring [12], [13]. COPD-focused salivary biomarkers and paper-based point-of-care sensor development strengthen the rationale for low-cost respiratory workflows based on saliva-derived measurements [14], [15]. These developments turn saliva-based respiratory classification into an attractive research direction, especially when paired with interpretable machine learning.
Despite this promise, the relationship between salivary measurements and respiratory-disease classification remains methodologically delicate. Salivary signals may reflect systemic inflammation, local oral conditions, smoking exposure, age-related biology, medication use, infection, or comorbid disease rather than a single respiratory-condition label. COPD datasets are especially vulnerable to demographic and behavioral imbalance because age and smoking history are themselves strong predictors of COPD risk. Recent explainable COPD modeling at population level has similarly shown that cigarette smoking and socioeconomic variables could dominate COPD prediction [16]. Therefore, a model trained on saliva-related features and demographic variables should be assessed in a confounding-aware manner: It is not enough to ask whether a classifier is accurate. It is necessary to ask whether salivary features add information beyond age, sex, and smoking status, and whether that added information is stable across clinically relevant classes.
Explainable artificial intelligence (XAI) has become central to this problem because opaque models are difficult to justify in clinical decision support. Recent healthcare XAI reviews have emphasized that explainability is required for transparency, trust, auditing, bias detection, and clinical adoption [17], [18], [19]. In tabular electronic health record research, SHapley Additive exPlanations (SHAP) has become one of the most frequently used post-hoc interpretation methods, particularly because it could provide both global feature-importance summaries and patient-level explanations [20], [21]. However, XAI output requires cautious interpretation: They explain a model’s behavior and should not be treated as causal evidence. This distinction is crucial in small biomedical datasets, where correlations among age, smoking status, and disease labels could provide clinically plausible yet confounded explanations.
Recent XAI literature has further argued that clinical explainability should be aligned with the needs of both clinicians and model developers, connected to data modality and intended use, and communicated in a way that supports model auditing rather than post-hoc reassurance [22], [23], [24], [25]. For saliva-based respiratory classification, this implied that global feature ranking should be complemented by patient-level explanations to show how demographic and salivary-response variables contributed to each predicted class.
Methodological reporting standards have also evolved rapidly. The Transparent Reporting of a Multivariable Prediction Model for Individual Prognosis or Diagnosis + Artificial Intelligence. (TRIPOD+AI) statement provides updated reporting guidance for clinical prediction models using regression or machine learning methods, thus emphasizing transparent description of data, predictors, outcomes, handling of missing data, validation, and interpretation of the model [26]. Prediction Model Risk of Bias Assessment Tool + Artificial Intelligence (PROBAST+AI) extends risk-of-bias and applicability assessment to prediction models developed with either regression or artificial-intelligence methods [27]. These frameworks reinforce the need for repeated validation, uncertainty estimation, transparent feature-set comparisons, and careful interpretation of model performance. In the context of the Exasens dataset, these principles motivate a study design that compares demographic-only, salivary-response-only, and combined feature configurations rather than presenting a single best-performing classifier. The corresponding reporting and risk-of-bias checklists are provided in Supplementary Table S1 and Supplementary Table S2, respectively.
Accordingly, this study was framed as a secondary complete-case audit of Exasens dataset rather than as diagnostic validation. We hypothesized that binary chronic obstructive pulmonary disease healthy control (COPD–HC) internal cross-validation performance would be strongly confounded by demographic and smoking-related structure. We then evaluated whether sensor-derived salivary-response variables added internally predictive information in a four-class label-classification setting involving COPD, HC, asthma, and infection-related cases. By separating sensor-response assessment, label classification, and secondary dataset reanalysis, the manuscript aims to clarify what can and cannot be inferred from the public Exasens spreadsheet.
The specific contributions are threefold. First, the study separated demographic-only, salivary-response-only, and combined feature effects rather than reporting a single binary classifier. Second, it evaluated whether the high COPD–HC separability in Exasens could be explained by age, recorded sex/gender, and smoking status, including matched and overlap-weighted sensitivity analyses. Third, it provided an exploratory four-class model-behavior audit using SHAP, being supported by out-of-fold class metrics, calibration summaries, missingness analysis, and confounding sensitivity checks. The intended use was retrospective methodological assessment of feature contribution and confounding in a public dataset. The model was not intended for diagnosis, screening, triage, risk prediction, or clinical decision support. No target clinically deployed population could be defined from this dataset alone, because the labels were inherited from public documentation and were not independently verified with subject-level spirometry, infection markers, or clinical adjudication.
2. Methodology
This study was designed as a reproducible, confounding-aware, and complete-case secondary analysis of the Exasens dataset. It should be interpreted as an internal dataset audit, not as validation of a clinical prediction model. The complete workflow is shown in Figure 1. The analysis began with spreadsheet parsing and variable harmonization, continued with missingness auditing and complete-case construction for salivary-response analyses, and evaluation of three feature configurations under identical repeated cross-validation folds. Internal cross-validation performance, feature-set contribution, exploratory uncertainty, and SHAP-based model-behavior auditing were assessed in a single pipeline. No independent external validation cohort was available.


The Exasens dataset contained 399 records and 9 primary columns, including respiratory-condition label, subject identifier, 4 salivary sensor-response measurements, and 3 demographic or behavioral variables. The labels were COPD, HC, asthma, and infected. The salivary-response variables were the minimum and average values of the imaginary component (Imag_Min, Imag_Avg) and the minimum and average values of the real component (Real_Min, Real_Avg). The demographic variables were age, recorded sex/gender, and smoking status. The public dataset labelled the sex/gender variable as gender and encoded it as female 0 and male 1. Since this coding may more closely reflect recorded sex than gender identity, we referred to it as recorded sex/gender throughout, while retaining the original dataset coding. Smoking status was encoded as non-smoker 1, ex-smoker 2, and active smoker 3.
The dataset was obtained from the open-access Exasens resource distributed through the University of California, Irvine (UCI) Machine Learning Repository [28]. The current UCI entry listed the downloadable file as Exasens.csv; the present project used an equivalent local spreadsheet copy named Exasens.xlsx, parsed directly from the workbook eXtensible Markup Language (XML) to avoid dependence on spreadsheet-specific software. According to the dataset documentation, COPD records corresponded to outpatients or hospitalized patients with COPD without acute respiratory infection. Asthma records corresponded to asthma patients without acute respiratory infection. Infected records corresponded to respiratory infection cases without COPD or asthma and HC records corresponded to HC without COPD, asthma, or respiratory infection. The public dataset did not provide subject-level spirometry, medication, oral-health status, comorbidity, infection-marker, measurement-frequency, sensor-setting, or detailed acquisition-protocol metadata. Therefore, label definitions and salivary-response interpretation were limited to the information available in the public dataset documentation and the associated Exasens publications.
The description of UCI variable labelled the four saliva measurements as imaginary and real parts with Min($\Delta$) and Avg($\Delta$), to suggest sensor-derived change or response variables rather than direct absolute permittivity constants. This distinction was important because the observed values were negative, whereas absolute real permittivity would not normally be interpreted as a negative quantity. Accordingly, Imag_Min, Imag_Avg, Real_Min, and Real_Avg were treated as sensor-derived dielectric response features. They might reflect dielectric changes related to saliva composition, ions, proteins, cells, viscosity, infection, smoking exposure, hydration, or oral conditions, but the public spreadsheet did not allow mechanistic attribution or unit-level physical validation.
The spreadsheet was read programmatically. Header rows and explanatory legend cells were removed; the subject identifier was retained only for traceability, and all model predictors were cast to numerical or categorical types. Age and salivary-response variables were treated as continuous variables. Recorded sex/gender and smoking status were treated as categorical variables because their numerical codes represented categories rather than ordinal magnitudes. The subject identifier was not used as a model predictor. A leakage audit found 399 unique identifiers among 399 records and 100 unique identifiers among the 100 complete salivary-response records; therefore, no repeated subject identifier appeared in both training and test folds under ordinary stratified cross-validation.
The original dataset had complete demographic variables for all 399 records. However, the four salivary-response variables were available only for 100 records. Therefore, two dataset views were prepared. First, the complete salivary-response subset was used for all analyses that involved salivary features. Second, the full COPD–HC subset with demographic variables was only used as a secondary confounding check to estimate how strongly demographic structure alone could separate COPD from HC. Participant/data flow is shown in Figure 2 whereas class-level missingness is shown in Figure 3. Lastly, the conceptual confounding structure is summarized in Figure 4.
The complete-case design was necessary because 299 records had no salivary-response measurements. The missing-data problem was interpreted by explicitly distinguishing among missing completely at random (MCAR), missing at random (MAR), and missing not at random (MNAR). MCAR would require availability of salivary response to be unrelated to both observed and unobserved subject characteristics. The observed class-structured missingness and complete-versus-incomplete differences did not support this assumption. MAR would allow missingness to depend on observed variables such as respiratory-condition label, age, recorded sex/gender, or smoking status. Even under MAR, however, imputing the four unmeasured salivary-response variables for 299 records would require model-based extrapolation of sensor measurements into classes and demographic strata, where measurements were mostly absent. MNAR was also plausible because availability of salivary response could depend on unrecorded acquisition decisions, saliva sample quality, oral-health state, disease severity, medication exposure, or other unobserved factors related to the missing sensor response itself.
No imputation of missing salivary-response measurements was therefore used to create synthetic saliva signals for these records. Inverse-probability weighting was not used to reconstruct salivary-response information for records without measured salivary-response variables, because the missing features themselves were absent and class-structured missingness would require unverifiable assumptions. The complete-case analysis was chosen as a conservative measured-signal analysis, not as a claim that the 100 records represented the original 399-record cohort as presented in Table 1. Complete and incomplete records were compared by age, recorded sex/gender, smoking status, and respiratory-condition label as a missingness-bias sensitivity analysis. This comparison was used to interpret how strongly the 100-record complete-case subset might differ from the original 399-record spreadsheet and how conclusions might change if the missing salivary-response records followed a non-random mechanism.
Three analysis tasks were defined in Table 2. The primary analysis was four-class complete-case Gradient Boosting with combined versus demographic-only feature comparison. The primary bias analysis was COPD–HC complete-case comparison of demographic-only, salivary-response only, and combined features. The broad multi-algorithm ranking was treated as secondary descriptive benchmarking, and sensitivity analyses included limited-overlap matching, overlap weighting, residualization, outlier removal, calibration, and SHAP auditing.
Dataset View | COPD | HC | Asthma | Infected |
|---|---|---|---|---|
All available records | 79 | 160 | 80 | 80 |
Complete salivary-response records | 40 | 40 | 10 | 10 |
COPD–HC demographic-only records | 79 | 160 | – | – |
To isolate the contribution of salivary-response variables from demographic confounding, three feature configurations were evaluated. Let $D$ denote the demographic feature set, $P$ the salivary-response feature set, and $C$ their combined representation:
$ \begin{gathered} D=\{\mathit{Age}, \mathit{Recorded sex/gender, Smoking}\} \\ P=\{\mathit{Imag\_Min, Imag\_Avg, Real\_Min, Real\_Avg}\} \\ C=D \cup P \end{gathered} $
| Task | Record and Label | Purposes |
|---|---|---|
| Four-class complete-case | 100 records: COPD, HC, asthma, infected | Primary analysis: Fixed four-class combined Gradient Boosting versus demographic-only internal cross-validation performance. |
| Binary complete-case | 80 records: COPD vs. HC | Primary bias analysis: Demographic-only, salivary-response only, and combined feature configurations in the common binary task. |
| Binary all-demographic | 239 records: COPD vs. HC | Secondary check of how strongly demographic variables alone separate COPD and HC in all records where those variables are available. |
The feature configurations are summarized in Table 3. Comparing $D$, $P$, and $C$ allowed the analysis to answer three distinct questions: Whether demographic variables alone separated the labels, whether salivary-response variables alone contained discriminative information, and whether salivary-response variables added internally predictive value beyond demographic variables.
| Configuration | Included Predictors |
|---|---|
| Demographic-only ($D$) | Age, recorded sex/gender, smoking status |
| Salivary-response only ($P$) | Imaginary minimum, imaginary average, real minimum, real average |
| Combined ($C$) | Age, recorded sex/gender, smoking status, imaginary minimum, imaginary average, real minimum, real average |
Preprocessing was implemented as a leak-free training pipeline. For each cross-validation split, preprocessing parameters were fitted only on the training fold and then applied to the corresponding test fold. Continuous variables were median-imputed if necessary and standardized using the training-fold mean and standard deviation:
$ z_{i j}=\frac{\tilde{x}_{i j}-\mu_j^{\text {train }}}{\sigma_j^{\text {train }}} $
where, $\tilde{x}_{i j}$ is the observed or imputed value of feature $j$ for subject $i$, and $\mu_j^{\text {train}}$ and $\sigma_j^{\text {train}}$ are estimated from the training fold only. Categorical variables were mode-imputed if necessary and one-hot encoded with unknown categories ignored at test time. Although the complete-case subset had no missing salivaryresponse values by construction, the same preprocessing pipeline was used across tasks to keep model evaluation consistent.
In the 100-record complete-case subset, age, recorded sex/gender, and smoking status were also complete. Therefore, demographic imputation was not required for the primary complete-case analyses; the imputation steps were retained as formal safeguards inside the training-fold pipeline and for consistency with analyses of the full demographic dataset. All imputation, scaling, encoding, and model fitting were nested inside the cross-validation folds.
The study benchmarked a broad set of classical, probabilistic, instance-based, kernel-based, bagging, boosting, and gradient-boosting models. The model set was intentionally broader than a single best-model search because the primary aim was to evaluate whether a feature-set effect was stable across model families. Hyperparameters were fixed before comparison to reduce overfitting risk on the small complete-case dataset. The fixed settings were conservative default-informed values or deliberately low-complexity settings, such as shallow boosted trees and modest learning rates, chosen before feature-set comparison rather than tuned to maximize performance in this dataset. No feature selection or hyperparameter optimization was performed outside the cross-validation pipeline.
The model families were selected to provide interpretable and widely used tabular-learning comparators. Logistic Regression served as a linear and clinically interpretable baseline. Support Vector Machine Radial Basis Function (SVM-RBF) represented a nonlinear kernel baseline; $K$-nearest neighbours ($K$NN) and Gaussian Naive Bayes provided simple instance-based and probabilistic comparators; Random Forest and Extra Trees represented bagging-based tree ensembles; and Gradient Boosting, HistGradientBoosting, eXtreme Gradient Boosting (XGBoost), Light Gradient Boosting Machine (LightGBM), Categorical Boosting (CatBoost), and Adaptive Boosting (AdaBoost) represented boosted-tree or boosting-style classifiers commonly used for structured biomedical data. As many models were benchmarked on a small complete-case subset, the best-model estimates were interpreted as exploratory internal cross-validation results rather than externally validated performance. Additional sensitivity analyses were therefore reported for fixed model families and feature sets.
To reduce the interpretive weight placed on post-hoc model selection, the primary interpretive analysis treated Gradient Boosting as the fixed primary model family for within-model feature-set comparisons, matched/weighted COPD–HC sensitivity analyses, outlier sensitivity, calibration summaries, and SHAP auditing. Gradient Boosting was chosen because it supported nonlinear tabular interactions, fixed shallow-tree hyperparameters, probability output, and model-agnostic probability-scale explanations without hyperparameter tuning. The broad multi-algorithm benchmark was retained as a secondary descriptive analysis rather than as an unbiased model-selection procedure.
For binary tasks, COPD was treated as the positive class and HC as the negative class. For the four-class task, labels were encoded numerically only for software compatibility. All reported results and explanations were mapped to the original respiratory-condition labels.
Model evaluation used repeated stratified cross-validation with 5 folds and 10 repeats, producing 50 test-fold estimates per model and feature configuration. Stratification preserved class proportions within each split as far as possible. The same split sequence was reused across feature configurations and models within a task, thus enabling paired fold-level comparisons.
The primary performance metric was balanced accuracy and was chosen because the four-class completecase subset was imbalanced, especially for asthma and infected classes. For $K$ classes, balanced accuracy was computed as the mean class-wise recall:
$ \textit{ Balanced Accuracy }=\frac{1}{K} \sum_{c=1}^K \frac{\textit{TP}_c}{\textit{TP}_c+\textit{FN}_c} $
where, $\textit{TP}_c$ and $\textit{FN}_c$ are the true positives and false negatives for class $c$, respectively. Macro-F1 was also calculated:
$ \textit{ Macro-F}1=\frac{1}{K} \sum_{c=1}^K \frac{2 \textit{ Precision}_c \textit{ Recall}_c}{\textit{ Precision}_c + \textit{ Recall}_c} $
Accuracy and receiver operating characteristic–area under the curve (ROC–AUC) were reported as secondary metrics. For binary tasks, ROC–AUC used COPD as the positive class. For the four-class task, ROC–AUC was calculated using a one-vs-rest macro-average formulation.
Uncertainty around mean cross-validation performance was summarized with non-parametric bootstrap intervals over fold-level metric values. For a metric vector $m=\left(m_1, \ldots, m_{50}\right)$, 10,000 bootstrap samples were drawn with replacement from the fold-level metric values, and the 2.5th and 97.5th percentiles of the bootstrap means were reported as descriptive fold-bootstrap intervals. These fold-level intervals were not treated as definitive population intervals because repeated cross-validation folds were correlated and each subject appeared in multiple repeats. For out-of-fold class metrics, bootstrap intervals were clustered at the subject level: Subjects, not individual repeated predictions, were resampled and all repeated held-out predictions for a selected subject were kept together.
Feature-set improvement was tested using paired fold-level differences. For a comparison between two feature configurations $A$ and $B$, the fold-level difference was:
$ d_i=m_{i, A}-m_{i, B}, i=1, \ldots, 50. $
Two complementary significance procedures were applied. First, a paired sign-flip permutation test randomly multiplied each $d_i$ by -1 or +1 and recalculated the mean difference. With $B=20,000$ random sign permutations, the two-sided $p$-value was:
$ p_{\mathrm{perm}}=\frac{1+\sum_{b=1}^B I\left(\left|\bar{d}^{(b)}\right| \geq|\bar{d}|\right)}{B+1}. $
Second, a corrected repeated cross-validation $t$-test was used to account approximately for dependence among repeated folds. With $M=50$ paired differences, training size $n_{\text {train }}$, test size $n_{\text {test }}$, mean difference $\bar{d}$, and sample variance $s_d^2$, the statistics were:
$ t=\frac{\bar{d}}{\sqrt{\left(\frac{1}{M}+\frac{n_{\text {test }}}{n_{\text {train }}}\right) s_d^2}} $
The primary feature-set comparison was combined versus demographic-only ($C-D$), because this directly tested whether salivary-response variables added value beyond demographic variables. Combined versus salivary-response only ($C-P$) and salivary-response only versus demographic-only ($P-D$) were also calculated to characterize the relative contribution of each feature group.
As repeated cross-validation fold estimates were correlated, $p$-values and bootstrap intervals were treated as internal evidence rather than definitive population-level inference. The paired tests were used to reduce the risk of interpreting random fold-level variation as a feature-set effect, but the manuscript did not claim external validation. To further reduce over-interpretation, best-feature comparisons were distinguished from within-model feature comparisons. In particular, the difference between the best demographic-only model and the best combined model was reported separately from the within-model combined-minusdemographic difference for Gradient Boosting.
Additional robustness and confounding-sensitivity analyses were performed. First, age-only, smoking-only, and age-plus-smoking baselines were evaluated to quantify demographic separability. Second, a four-class demographic-only analysis was performed on all 399 records because demographic variables were complete for the entire spreadsheet. Third, each salivary-response variable was residualized separately against age, recorded sex/gender, and smoking status inside each training fold using a linear regression residualization model. Categorical adjustment variables were one-hot encoded in the residualization design matrix; residualization coefficients were fitted on the training fold only and then applied to the held-out fold. A linear residualization model was chosen as a conservative low-variance adjustment for the small complete-case subset; more flexible nonlinear residualization could overfit and was not used to claim complete confounder removal. This procedure removed only linear associations with the observed adjustment variables. Fourth, COPD–HC confounding sensitivity was assessed with smoking-exact nearest-age matching and overlap weighting based on age, recorded sex/gender, and smoking status. Standardized mean differences (SMDs) were reported before and after these limited-overlap checks. Fifth, a missingness model used Logistic Regression to predict complete salivary-response availability from respiratory-condition label, age, recorded sex/gender, and smoking status. Sixth, robust outlier sensitivity removed salivary-response observations outside 1.5 interquartile ranges (IQRs) for any salivary-response feature and repeated four-class combined-model evaluation. Seventh, repeated out-of-fold predictions for the four-class combined Gradient Boosting model were used to compute an aggregated confusion matrix, per-class precision, recall, specificity, F1-score, one-vs-rest ROC–AUC, Brier scores, expected calibration error, and one-vs-rest calibration curves.
SHAP analysis was applied to the fixed four-class combined Gradient Boosting model. The model was refit on the complete 100-record salivary-response subset for the global explanation summary, and a separate out-of-fold SHAP analysis was performed for held-out fold predictions. SHAP values were computed on class probabilities using a model-agnostic permutation explainer rather than TreeSHAP, so the explanation scale, preprocessing pipeline, and probability-output interface were identical to the non-tree local Local Interpretable Model-Agnostic Explanations (LIME) sanity checks. The background dataset for the refittedmodel explainer was the preprocessed complete-case design matrix. For the out-of-fold SHAP analysis, each explainer used the corresponding preprocessed training fold as its background dataset. The permutation explainer was run with max_evals $=2 p+1$, where, $p$ is the number of transformed features. For each respiratory-condition class $c$, the SHAP decomposition was interpreted on the probability scale:
$ \hat{p}_c\left(x_i\right)=E\left[\hat{p}_c(X)\right]+\sum_{j=1}^p \phi_{i j c} $
where, $\hat{p}_c\left(x_i\right)$ is the predicted probability of class $c$ for subject $i, E\left[\hat{p}_c(X)\right]$ is the expected model probability for class $c$, and $\phi_{i j c}$ is the SHAP contribution of feature $j$ for subject $i$ and class $c$. Positive SHAP values increase the probability of the explained class where, as negative SHAP values decrease it.
Since recorded sex/gender and smoking were one-hot encoded during preprocessing, SHAP values for their one-hot columns were summed back to the original variables. This aggregation allowed patient-level explanations to be reported at the clinically interpretable feature level: Age, recorded sex/gender, smoking status, imaginary minimum, imaginary average, real minimum, and real average. For each subject, the analysis stored the true label, predicted label, class probabilities, top positive contributors, top negative contributors, and full feature-by-class SHAP contributions. These explanations were used only to interpret model behavior and were not interpreted as causal effects.
To address explanation stability, repeated out-of-fold SHAP rank analysis was performed using the same 10-repeat 5-fold structure as the primary internal validation. SHAP values were calculated for test-fold subjects only and then aggregated by original feature and explained class within each fold. Feature ranks were compared across the 50 held-out folds using mean pairwise Kendall rank correlation, top-feature consistency, top-three feature consistency, and feature-level rank variability. Directional SHAP plots were generated for the most clinically relevant feature-class pairs. As a secondary local-explanation check, LIME were generated for representative correct and misclassified test-fold predictions. These were used as supplementary local sanity checks rather than primary evidence, as reported in Supplementary Table S3.
All analyses were performed in Python 3.12.12 on macOS using an Apple M4 Max system with 128 GB unified memory. Data handling used NumPy 2.3.5 and pandas 2.3.3; preprocessing and baseline models used scikit-learn 1.7.2; gradient-boosting extensions used XGBoost 3.2.0, LightGBM 4.6.0, and CatBoost 1.2.10. Statistical tests used SciPy 1.17.1; SHAP analysis used SHAP 0.51.0, while LIME analysis used lime 0.2.0.1. Models were trained with CPU-based Python/scikit-learn-compatible libraries but MLX was not used. Random seeds were fixed at 42 unless otherwise specified. All figures included in this section were exported as 320 dpi PNG files. Heatmaps used colorblind-conscious sequential palettes with direct numeric annotations so that interpretation did not depend only on color.
3. Results
The public Exasens dataset contained 399 records, all with complete age, recorded sex/gender, and smoking status. Complete salivary-response measurements were available for only 100 records: 40 COPD, 40 HC, 10 asthma, and 10 infected records. The subject-identifier audit found 399 unique IDs among 399 records and 100 unique IDs among the complete-case records, so no repeated subject identifier created train–test leakage under stratified cross-validation. Because all salivary-response analyses were restricted to this subset, the first result was the extent to which the labels were already structured by demographic and behavioral variables. Figure 5 shows that COPD subjects were substantially older than the other groups, while Table 4 reveals that the COPD group was dominated by ex-smokers. In contrast, salivary-response distributions demonstrated weaker separation in the binary COPD–HC setting.
Variable | COPD | HC | Asthma | Infected | Four-Class $\boldsymbol{p}$ (V) | COPD-HC $\boldsymbol{p}$ (V) |
|---|---|---|---|---|---|---|
Male, $n$ (%) | 32 (80.0%) | 23 (57.5%) | 2 (20.0%) | 4 (40.0%) | 0.0013 (0.390) | 0.0526 (0.243) |
Smoking, $n$ | 1/37/2 | 24/8/8 | 4/3/3 | 9/1/0 | $<$0.0001 (0.541) | $<$0.0001 (0.737) |
The univariate tests confirmed this pattern in Table 5. Age differed strongly across the four respiratory-condition labels (Kruskal-Wallis $p$ = 2.69 × 10$^{-14}$) and between COPD and HC records in the complete-case binary subset (Welch $p$ = 1.80 × 10$^{-19}$). In contrast, none of the four salivary-response variables differed significantly between COPD and HC in the complete-case binary comparison. The strongest four-class salivary-response signal was Real_Avg (Kruskal-Wallis $p$ = 3.97 × 10$^{-4}$), while Imag_Min, Imag_Avg, and Real_Min did not show statistically significant four-class univariate separation. Robust median/IQR summaries are reported in Supplementary Table S4 because the real-component variables include extreme values.
Categorical variables also indicated strong imbalance, as can be seen in Table 5. Since several cells were small, categorical comparisons used Monte Carlo exact tests based on the chi-square statistics with 20,000 random permutations and seed 42 rather than relying merely on asymptotic chi-square assumptions. Recorded sex/gender differed across the four classes ($p$ = 0.0013, Cramer’s $V$ = 0.390), while the COPD–HC recorded sex/gender difference was borderline ($p$ = 0.0526, $V$ = 0.243). Smoking status differed strongly both across the four classes ($p<$ 0.0001, V = 0.541) and between COPD and HC ($p$ $<$ 0.0001, $V$ = 0.737). This result was important because high COPD–HC internal cross-validation performance could be obtained from known COPD risk structure, especially age and smoking status, even before salivary-response variables were considered.
Variable | COPD | HC | Asthma | Infected | Four-Class $\boldsymbol{p}$ (V) | COPD-HC $\boldsymbol{p}$ (V) |
|---|---|---|---|---|---|---|
Age | 71.7 $\pm$ 8.3 | 38.2 $\pm$ 14.1 | 47.7 $\pm$ 17.2 | 33.3 $\pm$ 8.6 | 2.69 $\times$ 10$^{-14}$ | 1.80 $\times$ 10$^{-19}$ |
Imag_Min | -312.3$\pm$ 32.6 | -313.5 $\pm$ 30.7 | -323.0 $\pm$ 3.4 | -323.5 $\pm$ 3.1 | 0.946 | 0.868 |
Imag_Avg | -302.1 $\pm$ 29.4 | -302.8 $\pm$ 27.8 | -313.7 $\pm$ 2.7 | -314.5 $\pm$ 3.2 | 0.958 | 0.910 |
Real_Min | -473.2 $\pm$ 16.8 | -471.7$\pm$ 76.2 | -473.7 $\pm$ 3.0 | -476.6 $\pm$ 1.9 | 0.144 | 0.909 |
Real_Avg | -460.0 $\pm$ 15.2 | -451.8$\pm$ 67.1 | -468.8 $\pm$ 2.7 | -470.7 $\pm$ 4.8 | 3.97 $\times$ 10$^{-4}$ | 0.455 |
Complete-case filtering changed the composition of the dataset as in Table 6. The complete-response subset contained a higher male proportion (61.0% vs. 32.8%), a higher ex-smoker proportion (49.0% vs. 33.8%), and a different respiratory-condition-label distribution than the incomplete-response records. SMDs between complete and incomplete records were 0.232 for age, 0.566 for recorded sex/gender, 0.309 for smoking status, and 0.611 for respiratory-condition label. A logistic missingness model predicting complete-response availability from respiratory-condition label, age, recorded sex/gender, and smoking achieved cross-validated ROC–AUC of 0.692 ± 0.082, reported as mean ± fold-level standard deviation across repeated cross-validation folds. Complete-case status was therefore not random with respect to observed variables. This confirms that the complete-case subset is not representative of the original 399-record dataset and that all salivary-response findings should be interpreted as complete-case and dataset-specific evidence.
Group | $\boldsymbol{n}$ | Age Mean | Age SD | Male % | Non-Smoker % | Ex-Smoker % | Active Smoker % | COPD | HC | Asthma | Infected |
|---|---|---|---|---|---|---|---|---|---|---|---|
Incomplete salivary response | 299 | 47.6 | 17.9 | 32.8 | 47.2 | 33.8 | 19.1 | 39 | 120 | 70 | 70 |
Complete salivary response | 100 | 52.1 | 20.2 | 61.0 | 38.0 | 49.0 | 13.0 | 40 | 40 | 10 | 10 |
The model benchmark produced different conclusions for the binary COPD–HC task and the four-class respiratory-condition task. In the complete-case COPD–HC subset, the best demographic-only model was Logistic Regression, with balanced accuracy of 0.955 (descriptive fold-bootstrap interval: 0.941–0.968) as presented in Figure 6, macro-F1 of 0.955, and ROC–AUC of 0.993 (see Table 7). The best salivary-response only model was CatBoost, but its balanced accuracy was only 0.56 (descriptive fold-bootstrap interval: 0.534–0.588), close to chance-level discrimination for a balanced binary task. The best combined model was LightGBM, with balanced accuracy of 0.932 (descriptive fold-bootstrap interval: 0.916–0.948), macro-F1 of 0.932, and ROC–AUC of 0.986. Thus, in the complete-case COPD–HC task, adding salivary-response variables did not improve over the strongest demographic-only model. The full classifier list and fixed settings are provided in Supplementary Table S5.
| Task | Feature Set | Best Model | Accuracy | Balanced Accuracy | Descriptive Fold-Bootstrap Interval | Macro-F1 | ROC–AUC |
|---|---|---|---|---|---|---|---|
| COPD-HC complete-case | Demographic | Logistic Regression | 0.955 | 0.955 | 0.941–0.968 | 0.955 | 0.993 |
| COPD-HC complete-case | Salivary-response | CatBoost | 0.560 | 0.560 | 0.534–0.588 | 0.552 | 0.570 |
| COPD-HC complete-case | Combined | LightGBM | 0.932 | 0.932 | 0.916–0.948 | 0.932 | 0.986 |
| COPD-HC all-demographic | Demographic | SVM-RBF | 0.935 | 0.928 | 0.917–0.938 | 0.927 | 0.971 |
| Four-class complete-case | Demographic | Extra Trees | 0.598 | 0.533 | 0.500–0.565 | 0.487 | 0.801 |
| Four-class complete-case | Salivary-response | Extra Trees | 0.470 | 0.556 | 0.531–0.583 | 0.492 | 0.745 |
| Four-class complete-case | Combined | Gradient Boosting | 0.800 | 0.680 | 0.652–0.708 | 0.681 | 0.881 |
The secondary COPD–HC analysis using all available demographic records supports the same interpretation. With 239 COPD–HC records and demographic variables only, the best model was SVM-RBF, reaching balanced accuracy of 0.928 (descriptive fold-bootstrap interval: 0.917–0.938), macro-F1 of 0.927, and ROC–AUC of 0.971. This result suggested that COPD–HC separability in the Exasens spreadsheet was already high when only age, recorded sex/gender, and smoking status were used, consistent with the strong univariate age and smoking differences.
Paired feature-set comparisons further demonstrated that salivary-response variables did not provide a robust COPD–HC gain beyond demographic variables. For the best complete-case combined binary model, LightGBM, the combined-minus-demographic balanced-accuracy difference was +0.018, with a descriptive fold-bootstrap interval of 0.001–0.036. However, this apparent improvement was not stable under the dependence-aware test: The corrected repeated cross-validation $t$-test produced $p$ = 0.5964, while the paired sign-flip permutation test gave $p$ = 0.0685. This discrepancy illustrated why fold-level bootstrap intervals were treated descriptively rather than as definitive independent-observation uncertainty intervals. Across the model families, combined features were frequently similar to or worse than demographic-only features in the binary task. Supplementary Figure S1 shows the paired combined-minus-demographic balanced-accuracy differences across model families.
The four-class task showed a different and methodologically more informative pattern. In the complete-case four-class setting, the best demographic-only model reached the balanced accuracy of 0.533, while the best salivary-response only model reached 0.556. The combined feature set produced a higher best-feature result: Gradient Boosting achieved accuracy of 0.8, balanced accuracy of 0.68 (descriptive fold-bootstrap interval: 0.652–0.708), macro-F1 of 0.681, and ROC–AUC of 0.881. Therefore, across the best-performing feature configurations, the combined model improved the balanced accuracy by 0.147 over the best demographic-only model. Separately, within the fixed Gradient Boosting model family, the combined-minus-demographic balanced-accuracy improvement was 0.245. Best-model comparisons and within-model feature-set comparisons answered different questions: The former is vulnerable to model-selection optimism, where, as the latter asks whether adding salivary-response variables changes internal cross-validation performance for the same algorithm. The four-class finding is therefore used as exploratory feature-set evidence under internal validation, not as a claim that the selected algorithm is deployment ready.
The selected permutation $p$-values in Supplementary Table S6 should still be interpreted as exploratory because multiple model families were benchmarked on a small complete-case subset. The fixed primary feature-set comparison for the primary interpretive analysis was the four-class Gradient Boosting combined model versus its demographic-only counterpart.
Additional confounding sensitivity analyses support the same interpretation. In the complete-case COPD–HC task, age-only and age-plus-smoking baselines achieved a high balanced accuracy (0.921 and 0.971, respectively), hence confirming that binary separability was dominated by demographic and smoking-related structure. Residualized salivary-response features, after fold-wise linear adjustments for age, recorded sex/gender, and smoking, reached a balanced accuracy of 0.738 in the binary task, which was higher than raw response-only chance-level performance but was still below demographic baselines. In the four-class complete-case task, residualized salivary-response features performed poorly (balanced accuracy 0.381), while age-only and demographic baselines remained around 0.52–0.56. In the all-399 demographic four-class analysis, demographic-only balanced accuracy was 0.474, which was lower than the complete-case demographic-only result, indicating that complete-case filtering altered demographic separability. Supplementary Figure S2 summarizes the confounding and residualized salivary-response sensitivity analyses.
The matched and overlap-weighted COPD–HC sensitivity analyses further narrowed the binary interpretation. Before matching or weighting, SMDs were large for age (2.901) and smoking status (maximum categorical SMDs 1.461). Smoking-exact nearest-age matching reduced smoking imbalance to zero and reduced age SMDs to 1.438, but only 22 records could be retained because the age and smoking distributions had poor overlap. In this matched subset, fixed Gradient Boosting balanced accuracy was 0.582 for demographic features, 0.26 for salivary-response features, and 0.512 for combined features. Overlap weighting retained all 80 complete COPD–HC records and reduced recorded sex/gender imbalance strongly, but age imbalance remained substantial (weighted age SMDs 1.315). Under this weighting, combined balanced accuracy (0.671) was essentially identical to demographic-only balanced accuracy (0.671), while salivary-response only balanced accuracy was 0.47. These should be interpreted as limited-overlap sensitivity analyses, not successful full confounder adjustment. The available data do not support a definitive estimate of independent salivary-response contribution to COPD–HC discrimination after full demographic balancing. Figure 7 summarizes covariate balance before and after the limited-overlap matching and weighting checks; detailed numerical results are provided in Supplementary Table S7.
Outlier sensitivity analysis revealed that the four-class result was not driven solely by extreme salivary-response observations. Applying the 1.5-IQR rule to any of the four salivary-response variables removed 30 of the 100 complete records. After removing these observations, the Gradient Boosting balanced accuracy was 0.672, compared with 0.68 in the full complete-case subset. Macro-F1 decreased from 0.681 to 0.664, and ROC–AUC decreased from 0.881 to 0.863. Thus, the four-class signal was attenuated but remained broadly similar after robust outlier removal although the directional SHAP patterns were sensitive to the sparse and outlier-prone response-feature distribution. As 30% of complete cases were flagged, this analysis should be viewed as a robustness stress test rather than evidence that the removed observations were measurement errors. The full and outlier-removed results are reported in Table 8, and Supplementary Figure S3 provides the corresponding visual comparison.
| Analysis | $\boldsymbol{n}$ | Accuracy | Balanced Accuracy | Macro-F1 | ROC–AUC |
|---|---|---|---|---|---|
| Full complete-case | 100 | 0.800 | 0.680 | 0.681 | 0.881 |
| Outlier-removed | 70 | 0.733 | 0.672 | 0.664 | 0.863 |
It was presented as a descriptive robustness check rather than as an unbiased model-selection procedure. Gradient Boosting was the strongest combined-feature model by balanced accuracy and macro-F1, but the main interpretation relied on the fixed Gradient Boosting feature-set comparison rather than the model leaderboard. The broader four-class combined-feature benchmark is reported in Supplementary Table S8 and Supplementary Figure S4.
The repeated out-of-fold confusion matrix for the four-class combined Gradient Boosting model is shown in Figure 8. These class-specific metrics were recomputed with the same 10-repeat 5-fold structure used for the headline benchmark, so the mean of the four recalls corresponded to the reported balanced accuracy of 0.68. COPD and HC were classified most reliably, where, as asthma remained weak and was frequently predicted as HC. Across the 10 repeated 5-fold out-of-fold passes, COPD recall was 0.905 and HC recall was 0.855. Infection-related recall was lower at 0.57. Asthma recall was only 0.39, with a wide bootstrap interval, hence reflecting the very small number of asthma complete cases and the limited reliability of minority-class classification (Table 9). Therefore, the four-class model should not be interpreted as a reliable classifier for all four classes. Its internal performance was strongest for COPD and HC, moderate for infection-related cases, and inadequate for asthma in the current complete-case subset.
| Class | Precision | Recall | Subject-Clustered Bootstrap Interval | Specificity | F1-Score | AUC |
|---|---|---|---|---|---|---|
| COPD | 0.903 | 0.905 | 0.816–0.980 | 0.935 | 0.904 | 0.961 |
| HC | 0.774 | 0.855 | 0.768–0.936 | 0.833 | 0.812 | 0.905 |
| Asthma | 0.476 | 0.390 | 0.110–0.667 | 0.952 | 0.429 | 0.781 |
| Infected | 0.760 | 0.570 | 0.250–0.858 | 0.980 | 0.651 | 0.841 |
Calibration analysis highlighted moderate probability behavior and also class-level instability, especially for classes with few complete cases. The multiclass Brier score was 0.333 and the top-label expected calibration error was 0.0983. One-vs-rest Brier scores were 0.087 for asthma, 0.063 for COPD, 0.129 for HC, and 0.054 for infected. minority-class bins were sparse because asthma and infected classes contained only 10 complete subjects each. Predicted probabilities should not be used for clinical thresholds without external calibration and validation. Decision-curve analysis was not performed because the model was not intended for clinical threshold selection in this dataset. Supplementary Figure S5 presents the corresponding one-vs-rest calibration curves.
The out-of-fold SHAP analysis was used as the primary explanation result because it explained held-out predictions rather than only a final refitted model (Figure 9). In the repeated 10 × 5 SHAP stability analysis, age remained the dominant COPD and HC feature, with mean absolute SHAP values of 0.377 and 0.306, respectively, and age was the top-ranked feature in 100% of held-out folds for both classes. For COPD, smoking was usually second-ranked (top-three frequency 0.98). For asthma, Imag_Avg was the leading contributor (mean absolute SHAP 0.066; top-feature consistency 0.84), followed by age, Real_Avg, and recorded sex/gender, indicating a less stable minority-class explanation. For infected cases, Real_Avg was the leading contributor (mean absolute SHAP 0.113; top-feature consistency 0.94), followed by age. Mean pairwise Kendall rank agreement was 0.697 for COPD, 0.732 for HC, 0.675 for infected, and 0.521 for asthma, confirming that explanation ranks were most stable for COPD and HC and least stable for asthma. The refitted-model SHAP heatmap and directional SHAP plots are reported as supplementary diagnostics. Repeated SHAP rank stability is detailed in Supplementary Table S9; the refitted-model SHAP heatmap and directional plots are shown in Supplementary Figure S6 and Supplementary Figure S7, respectively.
SHAP values were interpreted only as model-behavior summaries. Mean absolute SHAP values do not establish causal biomarker effects, and feature rankings across classes could be affected by correlated predictors, small minority-class counts, and different class baseline probabilities.
Taken together, the results support two main findings. First, COPD–HC classification in the Exasens data was highly vulnerable to demographic confounding: Demographic variables alone produced very high binary performance, while salivary-response variables alone were weak for COPD–HC discrimination and did not retain value after matching or overlap weighting. Second, the combined use of demographic and salivary-response variables produced an internally suggestive improvement in the four-class task, with the strongest and most consistent gains observed for the fixed Gradient Boosting analysis and other tree-based ensemble models. The SHAP results indicated that this combined model still relied heavily on age for COPD and HC probabilities, but salivary-response variables contributed more clearly to the asthma, infected, and HC class explanations.
4. Discussion
This study should be interpreted as a secondary and hypothesis-generating dataset audit, yet not a validation study of a clinical prediction model. Its main finding was not simply that a machine-learning model could separate COPD from HC. Previous Exasens-based studies have already shown that this binary task could reach high internal performance. Rather, the present analysis showed why that binary performance should be interpreted cautiously and where, the dataset provided a more informative contribution. In the complete-case COPD–HC task, demographic variables alone achieved very high balanced accuracy, while salivary-response variables alone were weak and did not show independent value after the available limited-overlap checks. In contrast, the combined demographic and salivary-response representation produced an internally suggestive improvement in the four-class task involving COPD, HC, asthma, and infected subjects. This distinction was central to the interpretation of the dataset.
The Exasens dataset was introduced as an open dataset for classifying four respiratory-condition groups using demographic information and saliva dielectric-response measurements [28]. The original machine-learning study by Zarrin et al. focused on in-vitro COPD–HC recognition and reported strong binary internal performance, with XGBoost reaching high accuracy and sensitivity in the COPD–HC setting [29]. A related neuromorphic implementation trained an Artificial Neural Network (ANN) for COPD–HC recognition and revealed that saliva-response-based binary recognition could be deployed on low-power hardware, with a report of approximately 90% simulation accuracy and 89% on-chip accuracy [30]. These studies are important because they established the feasibility of the Exasens sensing concept and connected it to point-of-care device development.
However, these earlier Exasens studies were primarily binary COPD–HC recognition studies. Their objective was to show whether COPD and HC could be separated, and in the neuromorphic work the task was further shaped by the requirements of hardware-compatible binary encoding [30]. The present study took a different perspective. Instead of treating high COPD–HC accuracy as the final endpoint, it explicitly asked whether salivary-response variables added information beyond age, recorded sex/gender, and smoking status. This is a stricter and clinically more defensible question, because COPD risk is strongly associated with age and smoking. The results showed that, for COPD–HC discrimination, the demographic component was already powerful enough to explain most of the separability in the dataset.
This confounding-aware interpretation is consistent with recent COPD artificial-intelligence literature. Reviews of AI in COPD emphasized that apparent model performance could be affected by dataset composition, missing-data handling, validation design, and limited external testing [3], [10], [11]. In addition, explainable COPD modeling has shown that smoking-related and sociodemographic variables could dominate COPD prediction in tabular datasets [16]. Our results aligned with these concerns: Age and smoking were not merely minor covariates but major drivers of COPD–HC model behavior. Therefore, the present analysis provided a more conservative interpretation of the Exasens signal by separating demographic and salivary-response feature contributions, and by avoiding an overstatement that salivary response alone was a robust independent COPD marker in this dataset.
The most informative internal signal was the four-class combined-feature performance. In this more difficult task, demographic-only and salivary-response only models were limited but the combined Gradient Boosting model reached a balanced accuracy of 0.68, macro-F1 of 0.681, and ROC–AUC of 0.881. The combined-minus-demographic improvement was +0.245 in balanced accuracy within the fixed Gradient Boosting family. This is internally suggestive evidence that salivary-response variables could contribute to model behavior when the task was not reduced to COPD versus HC. From a clinical-machine-learning perspective, this task was more relevant than the binary setting because respiratory assessment often required distinguishing COPD from asthma and infection-related respiratory impairment, not only from HC. However, the current four-class result remained exploratory because minority-class performance was uneven.
The four-class model should not be read as a reliable classifier for all four respiratory-condition groups. The out-of-fold class-specific results showed strong recall for COPD and HC, weaker recall for infection-related cases, and inadequate asthma recall in the current complete-case subset. This mattered because the four-class task was clinically more realistic, but the available asthma sample contained only 10 complete records. The four-class result was therefore best interpreted as a hypothesis-generating combined-feature signal rather than as evidence that the current model could clinically distinguish all four public respiratory-condition labels.
The comparison with previous Exasens-related studies therefore depended on the evaluation target. For binary COPD–HC recognition, earlier reports achieved high accuracy. The present study did not claim superiority over them as a raw binary classifier [29], [30]. In fact, our own demographic-only binary result demonstrated why binary accuracy alone could be misleading. The advantage of the present work is methodological and interpretive: It separated demographic-only, salivary-response only, and combined feature effects; quantified exploratory uncertainty; used paired statistical tests; evaluated a four-class task; and added class-specific SHAP explanations. In this sense, the study clarified what the Exasens signal represented and where, salivary-response features contributed to model behavior.
The SHAP analysis further supports this interpretation. For COPD, age was the dominant contributor, followed by smoking, which reinforced the confounding-aware conclusion. For HC, asthma, and infected classes, however, salivary-response variables became more visible, especially Real_Avg and Imag_Avg. This pattern might be biologically plausible, but it should be interpreted as model behavior rather than mechanism discovery. Saliva could reflect systemic inflammation, local oral conditions, infection, smoking exposure, and other physiological processes rather than a single disease mechanism [12], [13], [14]. The SHAP findings therefore did not prove causal biomarker effects; they illustrated how the fixed combined model used sensor-derived response variables to distribute probability across respiratory-condition classes.
The possible relevance of Real_Avg and Imag_Avg to asthma and infection-related classes should be understood cautiously. In conventional dielectric spectroscopy, real and imaginary components related to energy storage and dielectric loss, but the Exasens variables were reported as $\Delta$-style sensor-response features. Their negative values suggested that they should not be interpreted as absolute permittivity constants. These response variables might be influenced by ions, proteins, cells, mucus, hydration, smoking exposure, or inflammatory exudates. Infection-related respiratory conditions and asthma may alter salivary composition through inflammatory mediators, airway secretions, medication exposure, or oral-systemic interactions. However, the Exasens spreadsheet does not contain biomolecular assays, oral-health status, medication data, infection markers, sensor frequency, or measurement-unit metadata; therefore, these mechanisms remain plausible explanations rather than validated biological conclusions.
The safest intended use of the present work is exploratory research support and public-dataset auditing. The current evidence did not justify deployment as a screening pre-test, triage tool, risk-prediction model, clinical decision-support system, or replacement for spirometry. No target clinical deployment population could be defined from Exasens alone because key reference-standard information was unavailable at subject level. The labels were inherited from public documentation and were not independently verified with spirometry, infection markers, or clinical adjudication.
External validity remains limited because the analysis depended on a selected 100-record complete-case subset and repeated internal cross-validation. Repeated folds estimated internal robustness under resampling of the same measured subjects. They did not test transportability to a new clinic, device setting, sampling protocol, or demographic mix. A demographic shift toward younger COPD patients, older HC, different smoking distributions, or more balanced asthma and infection-related groups would likely reduce the apparent COPD–HC separability driven by age and smoking. Likewise, a different missing-data structure could change both performance and SHAP rankings, because the current complete-case subset contained a different sex/gender, smoking, and label composition from the incomplete records.
The findings should therefore be expected to hold mainly in a narrow scenario: A retrospective dataset with the same Exasens variable definitions, similar complete-case selection, similar age and smoking imbalance, and the same public-label structure. Under a prospective balanced scenario with adequate age and smoking overlap across labels, binary COPD–HC performance would likely be lower, and the independent value of salivary-response features would need to be re-estimated. Under a scenario where, salivary-response missingness was MNAR because of acquisition quality, oral-health status, medication, disease severity, or operational sampling decisions, the complete-case signal could be attenuated, amplified, or shifted toward different features. The current findings should not be expected to hold for screening, triage, risk prediction, or clinical decision support until externally validated with spirometry-confirmed COPD, clinically adjudicated asthma and infection-related disease, documented sensor settings and prospective measurement completeness.
Beyond this respiratory dataset, the analysis illustrated how confounding-aware evaluation could support operational model governance. A conventional leaderboard would favor highly internal COPD–HC accuracy, where, as the feature-set audit showed that much of that performance could be achieved from demographic and smoking structure alone. In applied analytical environments, this distinction affected model selection, deployment assessment, and risk control: Decision makers should ask whether a model improved the target workflow because it captured new task-relevant information, or whether it mainly reproduced population structure already present in the data.
The same framework could be used as a strategic analytics workflow for small and high-risk tabular datasets. Separate demographic-only, signal-only, and combined models provided an audit trail for feature contribution; missingness models identified whether the analytic subset represented the operational population; matched or weighted checks tested whether a reported signal survived basic overlap constraints; calibration and class-specific metrics prevented aggregate performance from hiding minority-class failure; and explanation-stability analysis indicated whether model explanations were robust enough to inform governance discussions. These steps were not specific to Exasens. They were applicable to sensor analytics, public-health dashboards, biomedical decision support, and other settings where, model output might influence resource allocation or operational risk decisions.
The findings also fit with the broader movement toward non-invasive respiratory assessment, but Exasens remains a small and metadata-limited dataset. Its value is therefore best expressed as a combined, explainable, and multi-class complete-case dataset audit rather than a standalone salivary-response only COPD–HC classifier.
Several limitations must be emphasized. First, salivary-response measurements were available for only 100 of the 399 records, and asthma and infection-related groups contained only 10 complete cases each. Repeated cross-validation increased the number of held-out predictions but did not create new independent asthma or infection-related subjects; consequently, dataset-specific structural learning and instability in these minority classes could not be eliminated by resampling. Second, the study used repeated cross-validation but had no independent external validation cohort. Third, complete-case status was predictable from observed variables, indicating structured missingness and limited generalizability. Fourth, the COPD–HC complete-case subset had poor age and smoking overlap; even matching and overlap weighting left residual imbalance or very small matched samples. Fifth, because multiple algorithms were benchmarked, the reported best-model performance might still contain model-selection optimism, despite fixed hyperparameters and repeated cross-validation. Sixth, although out-of-fold SHAP and LIME checks were added, explanations remain to be internal model-behavior summaries and should not be treated as externally validated clinical decision rules.
Regardless of these limitations, the study contributes a more cautious and clinically aligned reading of the Exasens dataset. It demonstrated that COPD–HC classification could be strongly confounded by demographic structure, that salivary-response features alone were not sufficient for robust binary COPD–HC discrimination, and that the combined feature representation provided its clearest value in exploratory multi-class respiratory-condition label classification. A prospective validation study would require larger and balanced COPD, HC, asthma, and infection-related groups; spirometry-confirmed COPD; smoking pack-years; medication and oral-health metadata; infection markers; documented sensor frequency and acquisition settings; a prospectively defined analysis plan; external calibration; and independent external validation. A future validation cohort should recruit participants prospectively before model fitting, include clinically adjudicated COPD, asthma, infection-related respiratory disease, and HC groups, and preserve sufficient age and smoking overlap across labels. This framing is consistent with TRIPOD+AI and PROBAST+AI principles, which emphasize transparent predictor definition, validation, uncertainty, missing-data reporting, and risk-of-bias awareness in clinical prediction models [26], [27].
5. Conclusions
This study unraveled a confounding-aware and explainable complete-case audit of the Exasens dataset using demographic variables and sensor-derived salivary dielectric response features. Binary COPD–HC internal cross-validation performance was strongly driven by age and smoking, and salivary-response variables did not show robust independent binary value after the available limited-overlap checks. The clearest dataset signal appeared in the exploratory four-class task, where, the combined Gradient Boosting model reached a balanced accuracy of 0.68, macro-F1 of 0.681, and ROC–AUC of 0.881; however, asthma performance remains inadequate and the model is not reliable for all four classes. SHAP supports this interpretation by showing age-dominated COPD and HC predictions and more visible salivary-response contributions for non-COPD class probabilities. These findings are hypothesis-generating only: Larger externally validated cohorts with spirometry, smoking pack-years, medication, infection, oral-health metadata, and documented sensor acquisition settings are required before any clinical deployment could be considered. Accordingly, the current findings should be used to guide prospective validation design rather than supporting clinical deployment.
Conceptualization, M.M. and T.B.D.; methodology, M.M. and T.B.D.; validation, M.M. and T.B.D.; formal analysis, M.M. and T.B.D.; investigation, M.M. and T.B.D.; resources, M.M. and T.B.D.; data curation, M.M. and T.B.D.; writing—original draft preparation, M.M. and T.B.D.; writing—review and editing, M.M. and T.B.D.; visualization, M.M. and T.B.D.; clinical interpretation, T.B.D. All authors have read and agreed to the published version of the manuscript.
This study is a secondary analysis of a publicly available and de-identified dataset. No new human-subject data were collected and no attempt was made to reidentify participants. No work was done to infer protected attributes beyond variables already present in the public dataset. Therefore, institutional review board approval was not required for this analysis. The UCI dataset documentation stated that the original sampling procedure was approved by the local ethics committee of the University of Luebeck (approval number AZ-16-167) and that written informed consent was obtained from all subjects.
The Exasens dataset is publicly available from the UCI Machine Learning Repository at https://archive.ics.uci.edu/dataset/523/exasens (DOI: 10.24432/C5M03M; accessed on May 24, 2026). The UCI record lists the downloadable source file as Exasens.csv and the license as Creative Commons Attribution 4.0 International (CC BY 4.0). This study used only the publicly available spreadsheet data, with an equivalent local.xlsx copy parsed for analysis.
The authors acknowledged the creators and maintainers of the Exasens dataset for making the data publicly available. Simultaneously, the authors acknowledged Sakarya University of Applied Sciences (https://subu.edu.tr/) for the technical support provided to publish the present manuscript.
The authors declare no conflicts of interest.
Supplementary Materials
Table S1 is the TRIPOD+AI-oriented reporting checklist; Table S2 is the PROBAST+AI-oriented risk-of-bias self-assessment; Table S3 contains representative LIME examples; Table S4 reports robust continuous-variable summaries; Table S5 lists classifiers and fixed settings; Table S6 reports selected paired feature-set comparisons; Table S7 reports matched and overlap-weighted COPD–HC sensitivity analyses; Table S8 reports four-class combined-feature performance; and Table S9 reports repeated out-of-fold SHAP rank stability. Figure S1 shows paired combined-minus-demographic differences; Figure S2 shows confounding and revisualization sensitivity; Figure S3 shows outlier sensitivity; Figure S4 shows the secondary combined-feature model benchmark; Figure S5 shows one-vs-rest calibration curves; Figure S6 shows the refitted-model SHAP heatmap; and Figure S7 shows directional out-of-fold SHAP diagnostics.
Table S1. Transparent Reporting of a Multivariable Prediction Model for Individual Prognosis or Diagnosis + Artificial Intelligence (TRIPOD+AI)-oriented reporting checklist
Item | Manuscript Location | Reporting Status |
Source of data | Methods: Data Availability | Public UCI Exasens dataset, DOI, license, and access date reported. |
Participants and labels | Methods: Dataset | Respiratory-condition labels and public-label limitations described. |
Predictors | Methods: Dataset and Feature Configurations | Age, recorded sex/gender, smoking, and four salivary-response variables defined. |
Missing data | Methods and Results | Complete-case design, class-structured missingness, missingness model, and SMDs reported. |
Preprocessing | Methods: Feature Configurations | Fold-constant imputation, scaling, and one-hot encoding described. |
Model specification | Methods: Machine Learning Models | Fixed hyperparameters and primary Gradient Boosting sensitivity model reported. |
Validation | Methods: Validation Strategy | Reported stratified CV, out-of-fold metrics, and correlated-CV caveats reported. |
Performance measures | Methods and Results | Balanced accuracy, macro-F1, ROC-AUC, per-class metrics, calibration summaries, and Brier score reported. |
Explainability | Methods and Results | SHAP background, permutation setting, out-of-fold SHAP, directional plots, and LIME examples reported. |
Intended use | Introduction and Discussion | Exploratory dataset audit only; no clinical deployment claim. |
Note: UCI = University of California, Irvine; SMDs = standardized mean differences; CV = cross-validation; Macro-F1 = Macro-averaged F1-score; ROC–AUC = Receiver Operating Characteristic–Area Under the Curve; SHAP = SHapley Additive exPlanations; LIME = Local Interpretable Model-Agnostic Explanations.
Table S2. Prediction Model Risk of Bias Assessment Tool + Artificial Intelligence (PROBAST+AI)-oriented risk-of-bias self-assessment
Domain | Assessment |
Participants | High concern: only 100 complete salivary-response records; asthma and infection-related groups have 10 complete subjects each. |
Predictors | Moderate/high concern: sensor acquisition metadata, units, and frequency settings are unavailable in the public spreadsheet; demographic confounding is strong. |
Outcome | Moderate concern: labels are inherited from public Exasens documentation; subject-level spirometry and infection-marker data are unavailable. |
Analysis | Moderate/high concern: internal repeated cross-validation only; no external validation; multiple models benchmarked on a small complete-case subset. |
Applicability | Exploratory only: findings should be treated as dataset-specific and hypothesis-generating. |
Table S3. Representative Local Interpretable Model-Agnostic Explanations (LIME) local explanation
ID | True | Predicted | Example | Explained | Top Three LIME Contributions |
305-4 | COPD | COPD | Correct | COPD | Age bin (+0.304); ex-smoker indicator (+0.090); recorded sex/gender code indicator (-0.032) |
327-4 | COPD | HC | Misclassified | HC | Age bin (+0.416); ex-smoker indicator (-0.143); Real_Avg bin (+0.107) |
15-3 | HC | HC | Correct | HC | Age bin (+0.410); Real_Avg bin (-0.269); non-ex-smoker indicator (+0.133) |
18-4 | HC | Infected | Misclassified | Infected | Real_Avg bin (+0.239); age bin (+0.175); ex-smoker indicator (+0.029) |
A219-4 | Asthma | HC | Misclassified | HC | Age bin (+0.421); non-ex-smoker indicator (+0.134); Real_Avg bin (+0.107) |
149-5 | Infected | Infected | Correct | Infected | Real_Avg bin (+0.256); non-ex-smoker indicator (-0.032); age bin (+0.024) |
A223-4 | Asthma | Asthma | Correct | Asthma | Imag_Avg bin (+0.023); recorded sex/gender code indicator (+0.012); non-ex-smoker indicator (+0.012) |
157-3 | Infected | HC | Misclassified | HC | Age bin (+0.332); Real_Avg bin (+0.102); ex-smoker indicator (-0.093) |
Note: COPD = chronic obstructive pulmonary disease; HC = healthy control; Imag_Avg = average value of imaginary component; Real_Avg = average value of real component.
Table S4. Robust complete-case continuous-variable summaries: median interquartile range (IQR)
Variable | COPD | HC | Asthma | Infected |
Age | 73.0 [8.3] | 40.0 [23.8] | 49.5 [16.8] | 32.0 [10.3] |
Imag_Min | -323.0 [10.2] | -323.0 [7.8] | -320.6 [6.0] | -323.0 [6.0] |
Imag_Avg | -314.5 [18.3] | -314.6 [16.6] | -312.0 [3.1] | -313.6 [5.3] |
Real_Min | -473.7 [5.4] | -473.7 [26.3] | -473.7 [1.8] | -476.1 [0.0] |
Real_Avg | -466.4 [6.9] | -465.1 [9.4] | -469.3 [3.3] | -472.3 [0.5] |
Note: COPD = chronic obstructive pulmonary disease; HC = healthy control; Imag_Min = minimum value of imaginary component; Imag_Avg = average value of imaginary component; Real_Min = minimum value of real component; Real_Avg = average value of real component.
Table S5. Classifiers and fixed principal settings
Model | Principal Settings |
Logistic Regression | Maximum iterations = 3000; class-weight balancing enabled. |
SVM-RBF | Radial-basis kernel; $C$ = 1; $\gamma$ = scale; probability outputs enabled; class-weight balancing enabled. |
$K$-nearest neighbors | $k$ = 5. |
Gaussian Naive Bayes | Default Gaussian likelihood model. |
Random Forest | 500 trees; minimum leaf size = 2; balanced subsample class weights. |
Extra Trees | 500 trees; minimum leaf size = 2; balanced class weights. |
AdaBoost | 200 estimators; learning rate = 0.05. |
Gradient Boosting | 200 estimators; learning rate = 0.03; maximum tree depth = 2. |
Histogram Gradient Boosting | 200 iterations; learning rate = 0.03; $L_2$ regularization = 0.1. |
XGBoost | 200 estimators; maximum depth = 2; learning rate = 0.03; subsample = 0.8; column subsample = 0.8; $\lambda$ = 3. |
LightGBM | 200 estimators; maximum depth = 2; learning rate = 0.03; subsample = 0.8; column subsample = 0.8; $\lambda$ = 3; balanced class weights. |
CatBoost | 250 iterations; depth = 2; learning rate = 0.03; $L_2$ leaf regularization = 5. |
Note: SVM-RBF = Support Vector Machine with Radial Basis Function kernel; XGBoost = eXtreme Gradient Boosting; LightGBM = Light Gradient Boosting Machine; CatBoost = Categorical Boosting; AdaBoost = Adaptive Boosting.
Table S6. Feature set comparisons
Task | Model | Comparison | Difference | Descriptive Fold-Bootstrap Interval | Permutation $\boldsymbol{p}$ | Holm-Adjusted $\boldsymbol{p}$ | Corrected $\boldsymbol{t}$-Test $\boldsymbol{p}$ |
COPD-HC complete-case | LightGBM | Combined-Demographic | +0.018 | 0.001–0.036 | 0.0685 | 0.0685 | 0.5964 |
COPD-HC complete-case | LightGBM | Combined-Salivary | +0.522 | 0.482–0.562 | $<$0.0001 | 0.0004 | $<$0.0001 |
Four-class complete-case | Gradient Boosting | Combined-Demographic | +0.245 | 0.207–0.282 | $<$0.0001 | 0.0004 | 0.0012 |
Four-class complete-case | Gradient Boosting | Combined-Salivary | +0.188 | 0.163–0.212 | $<$0.0001 | 0.0004 | 0.0002 |
Four-class complete-case | HistGradientBoosting | Combined-Demographic | +0.191 | 0.155–0.228 | $<$0.0001 | 0.0004 | 0.0082 |
Four-class complete-case | XGBoost | Combined-Demographic | +0.171 | 0.144–0.197 | $<$0.0001 | 0.0004 | 0.0016 |
Four-class complete-case | CatBoost | Combined-Demographic | +0.161 | 0.140–0.181 | $<$0.0001 | 0.0004 | 0.0001 |
Four-class complete-case | Random Forest | Combined-Demographic | +0.135 | 0.100–0.169 | $<$0.0001 | 0.0004 | 0.0398 |
Note: COPD = chronic obstructive pulmonary disease; HC = healthy control; XGBoost = eXtreme Gradient Boosting; LightGBM = Light Gradient Boosting Machine; CatBoost = Categorical Boosting; AdaBoost = Adaptive Boosting.
Table S7. Chronic obstructive pulmonary disease healthy control (COPD–HC) matched and overlap-weighted limited-overlap sensitivity using fixed Gradient Boosting
Analysis | Feature Set | $\boldsymbol{n}$ | Age SMD | Smoking Max SMD | Balanced Accuracy | ROC–AUC |
Unmatched complete-case | Demographic | 80 | 2.901 | 1.461 | 0.906 | 0.983 |
Unmatched complete-case | Salivary-response | 80 | 2.901 | 1.461 | 0.545 | 0.555 |
Unmatched complete-case | Combined | 80 | 2.901 | 1.461 | 0.905 | 0.982 |
Smoking-exact nearest-age matched | Demographic | 22 | 1.438 | 0.000 | 0.582 | 0.694 |
Smoking-exact nearest-age matched | Salivary-response | 22 | 1.438 | 0.000 | 0.260 | 0.211 |
Smoking-exact nearest-age matched | Combined | 22 | 1.438 | 0.000 | 0.512 | 0.472 |
Overlap-weighted complete-case | Demographic | 80 | 1.315 | 0.595 | 0.671 | 0.842 |
Overlap-weighted complete-case | Salivary-response | 80 | 1.315 | 0.595 | 0.470 | 0.475 |
Overlap-weighted complete-case | Combined | 80 | 1.315 | 0.595 | 0.671 | 0.784 |
Note: SMD = standardized mean difference; ROC–AUC = Receiver Operating Characteristic–Area Under the Curve.
Table S8. Four-class complete-case performance using the combined feature set
Model | Accuracy | Balanced Accuracy | Descriptive Fold-Bootstrap Interval | Macro-F1 | ROC–AUC |
Gradient Boosting | 0.800 | 0.680 | 0.652–0.708 | 0.681 | 0.881 |
LightGBM | 0.725 | 0.652 | 0.621–0.684 | 0.626 | 0.879 |
Random Forest | 0.771 | 0.641 | 0.611–0.671 | 0.628 | 0.908 |
Hist Gradient Boosting | 0.758 | 0.639 | 0.603–0.675 | 0.622 | 0.891 |
XGBoost | 0.777 | 0.626 | 0.598–0.654 | 0.621 | 0.902 |
Gaussian Naive Bayes | 0.639 | 0.624 | 0.598–0.650 | 0.547 | 0.849 |
CatBoost | 0.787 | 0.621 | 0.598–0.644 | 0.591 | 0.902 |
Extra Trees | 0.681 | 0.602 | 0.571–0.632 | 0.575 | 0.864 |
Logistic Regression | 0.627 | 0.600 | 0.561–0.639 | 0.536 | 0.847 |
SVM-RBF | 0.593 | 0.571 | 0.530–0.612 | 0.494 | 0.849 |
AdaBoost | 0.743 | 0.524 | 0.496–0.554 | 0.497 | 0.795 |
$K$NN | 0.656 | 0.492 | 0.466–0.519 | 0.466 | 0.775 |
Note: Macro-F1 = Macro-averaged F1-score; ROC–AUC = Receiver Operating Characteristic–Area Under the Curve; XGBoost = eXtreme Gradient Boosting; LightGBM = Light Gradient Boosting Machine; CatBoost = Categorical Boosting; SVM-RBF = Support Vector Machine with Radial Basis Function kernel; $K$NN = $K$-nearest neighbours.
Table S9. Repeated out-of-fold SHapley Additive exPlanations (SHAP) feature ranking stability across 10 repeats of 5-fold cross validation
Class | Feature | Mean Abs. SHAP | Mean Rank | Rank SD | Rank Range | Top-1 Freq. | Top-3 Freq. |
COPD | Age | 0.377 | 1.00 | 0.00 | 1–1 | 1.00 | 1.00 |
COPD | Smoking | 0.065 | 2.06 | 0.42 | 2–5 | 0.00 | 0.98 |
COPD | Imag_Avg | 0.019 | 3.72 | 0.95 | 2–7 | 0.00 | 0.50 |
COPD | Real_Avg | 0.018 | 4.00 | 1.01 | 3–7 | 0.00 | 0.32 |
COPD | Recorded sex/gender | 0.011 | 5.20 | 1.01 | 3–7 | 0.00 | 0.08 |
COPD | Real_Min | 0.008 | 5.76 | 1.04 | 3–7 | 0.00 | 0.06 |
COPD | Imag_Min | 0.005 | 6.26 | 1.19 | 3–7 | 0.00 | 0.06 |
HC | Age | 0.306 | 1.00 | 0.00 | 1–1 | 1.00 | 1.00 |
HC | Real_Avg | 0.101 | 2.20 | 0.45 | 2–4 | 0.00 | 0.98 |
HC | Smoking | 0.064 | 3.58 | 0.97 | 2–6 | 0.00 | 0.52 |
HC | Imag_Avg | 0.064 | 3.68 | 0.74 | 2–5 | 0.00 | 0.36 |
HC | Recorded sex/gender | 0.029 | 5.38 | 1.09 | 3–7 | 0.00 | 0.08 |
HC | Real_Min | 0.026 | 5.58 | 1.05 | 2–7 | 0.00 | 0.06 |
HC | Imag_Min | 0.012 | 6.58 | 0.73 | 4–7 | 0.00 | 0.00 |
Asthma | Imag_Avg | 0.066 | 1.28 | 0.70 | 1–4 | 0.84 | 0.98 |
Asthma | Age | 0.035 | 2.72 | 0.95 | 1–5 | 0.04 | 0.82 |
Asthma | Real_Avg | 0.029 | 3.38 | 1.26 | 1–6 | 0.04 | 0.64 |
Asthma | Recorded sex/gender | 0.028 | 3.76 | 1.44 | 1–7 | 0.04 | 0.36 |
Asthma | Smoking | 0.017 | 5.22 | 1.25 | 1–7 | 0.02 | 0.06 |
Asthma | Real_Min | 0.014 | 5.50 | 1.15 | 2–7 | 0.00 | 0.04 |
Asthma | Imag_Min | 0.012 | 6.14 | 1.58 | 1–7 | 0.02 | 0.10 |
Infected | Real_Avg | 0.113 | 1.08 | 0.34 | 1–3 | 0.94 | 1.00 |
Infected | Age | 0.060 | 1.94 | 0.24 | 1–2 | 0.06 | 1.00 |
Infected | Smoking | 0.016 | 3.78 | 1.18 | 3–7 | 0.00 | 0.62 |
Infected | Imag_Avg | 0.012 | 4.20 | 0.93 | 3–6 | 0.00 | 0.24 |
Infected | Real_Min | 0.009 | 5.14 | 1.21 | 2–7 | 0.00 | 0.10 |
Infected | Recorded sex/gender | 0.007 | 5.42 | 1.16 | 3–7 | 0.00 | 0.04 |
Infected | Imag_Min | 0.003 | 6.44 | 0.86 | 4–7 | 0.00 | 0.00 |
Note: SHAP = SHapley Additive exPlanations; SD = standard deviation; COPD = chronic obstructive pulmonary disease; HC = healthy control; Imag_Min = minimum value of imaginary component; Imag_Avg = average value of imaginary component; Real_Min = minimum value of real component; Real_Avg = average value of real component.
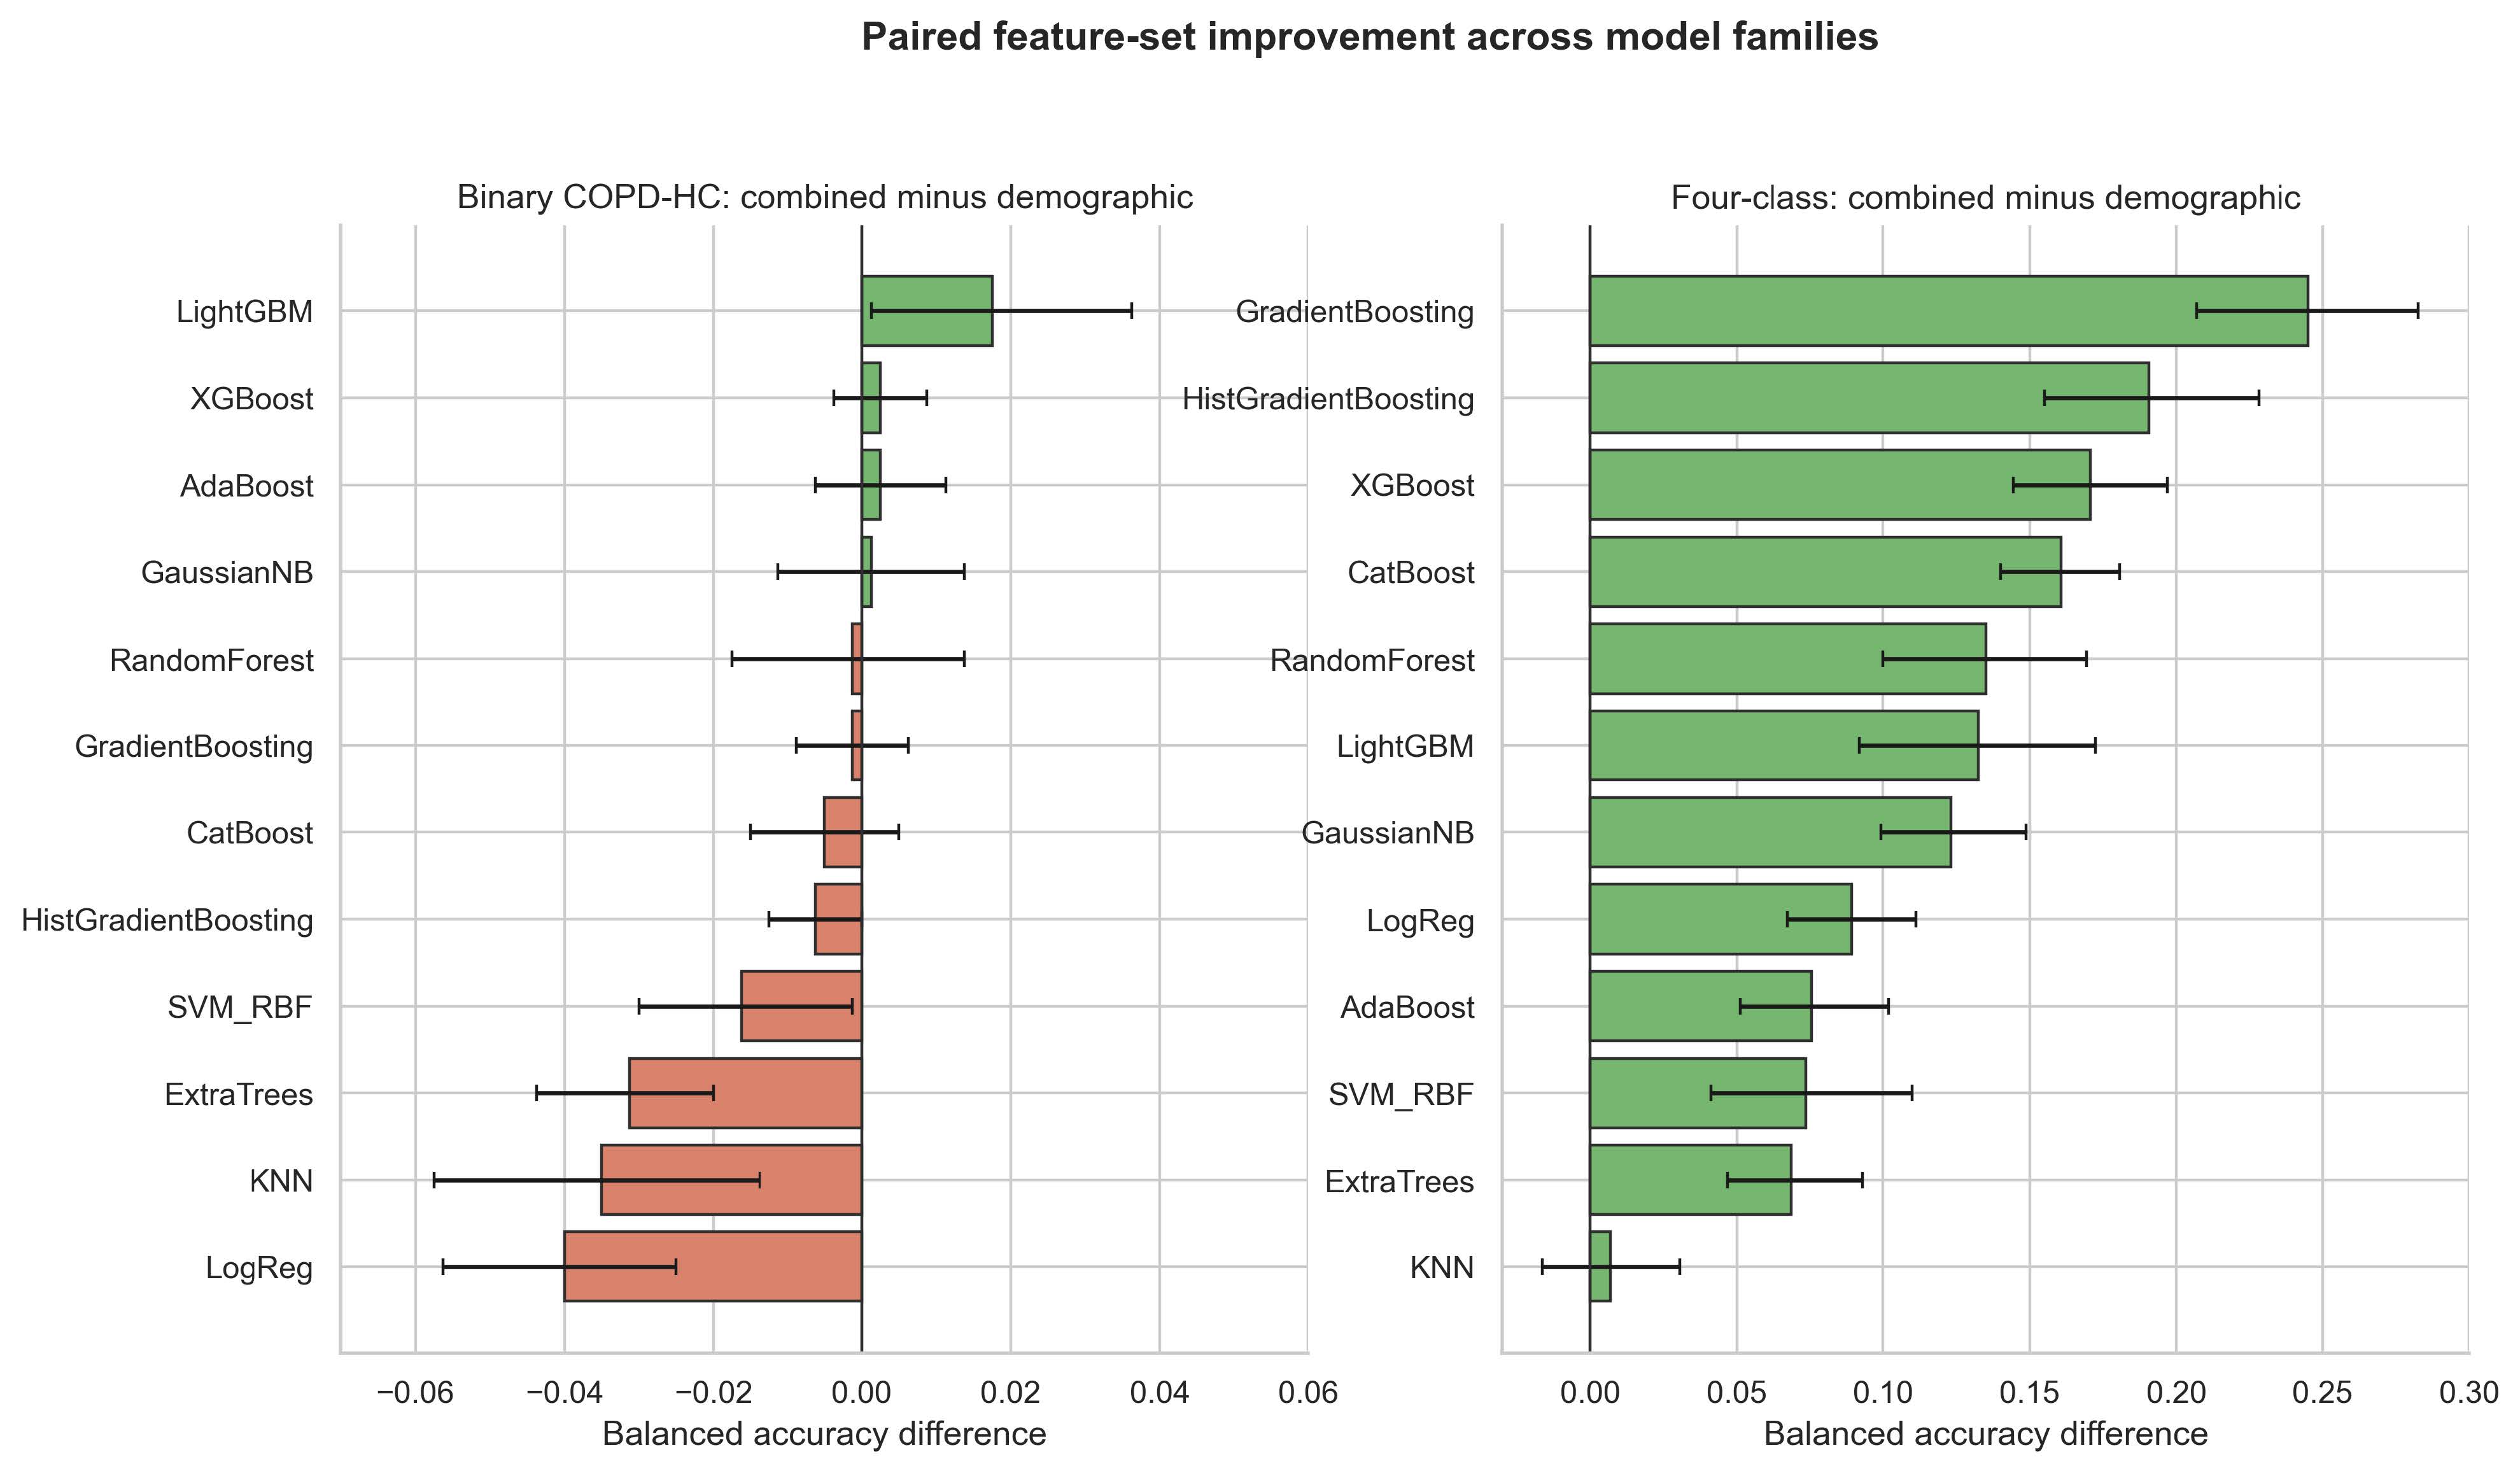
Figure S1. Paired balanced-accuracy differences for combined minus demographic-only feature sets across model families
Note: COPD = chronic obstructive pulmonary disease; HC = healthy control; XGBoost = eXtreme Gradient Boosting; AdaBoost = Adaptive Boosting; LightGBM = Light Gradient Boosting Machine; CatBoost = Categorical Boosting; SVM-RBF = Support Vector Machine with Radial Basis Function kernel; $K$NN = $K$-nearest neighbours.
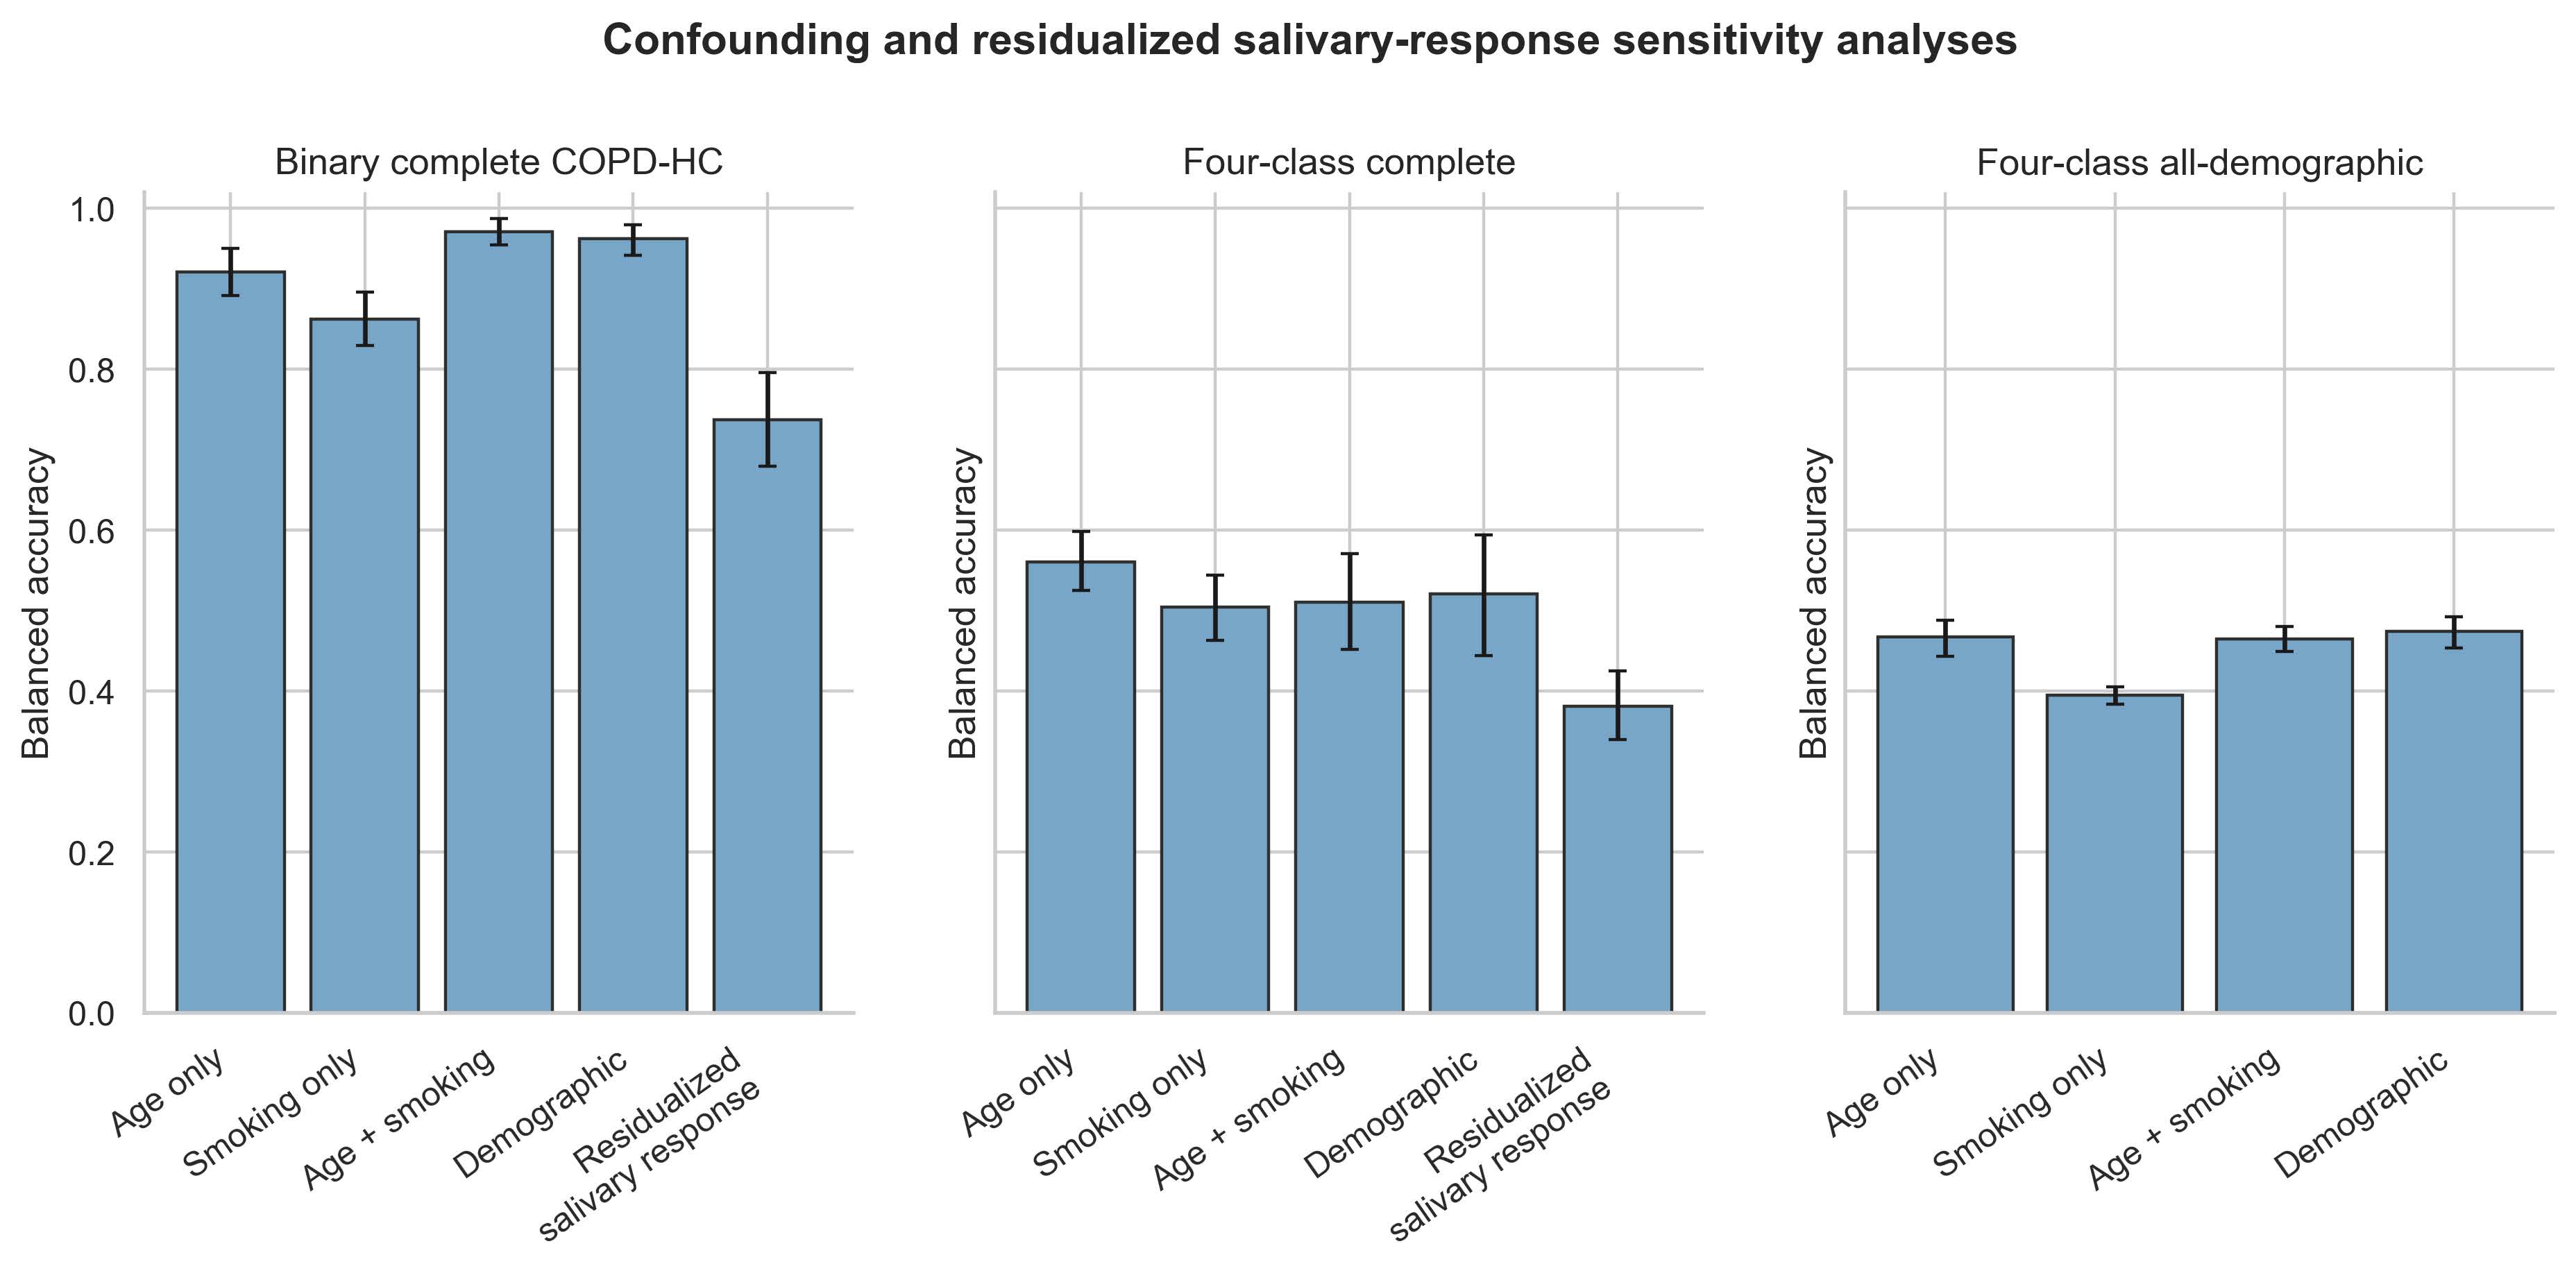
Figure S2. Confounding sensitivity analyses using age-only, smoking-only, age-plus-smoking, demographic-only, and residualized salivary-response feature sets
Note: COPD = chronic obstructive pulmonary disease; HC = healthy control.
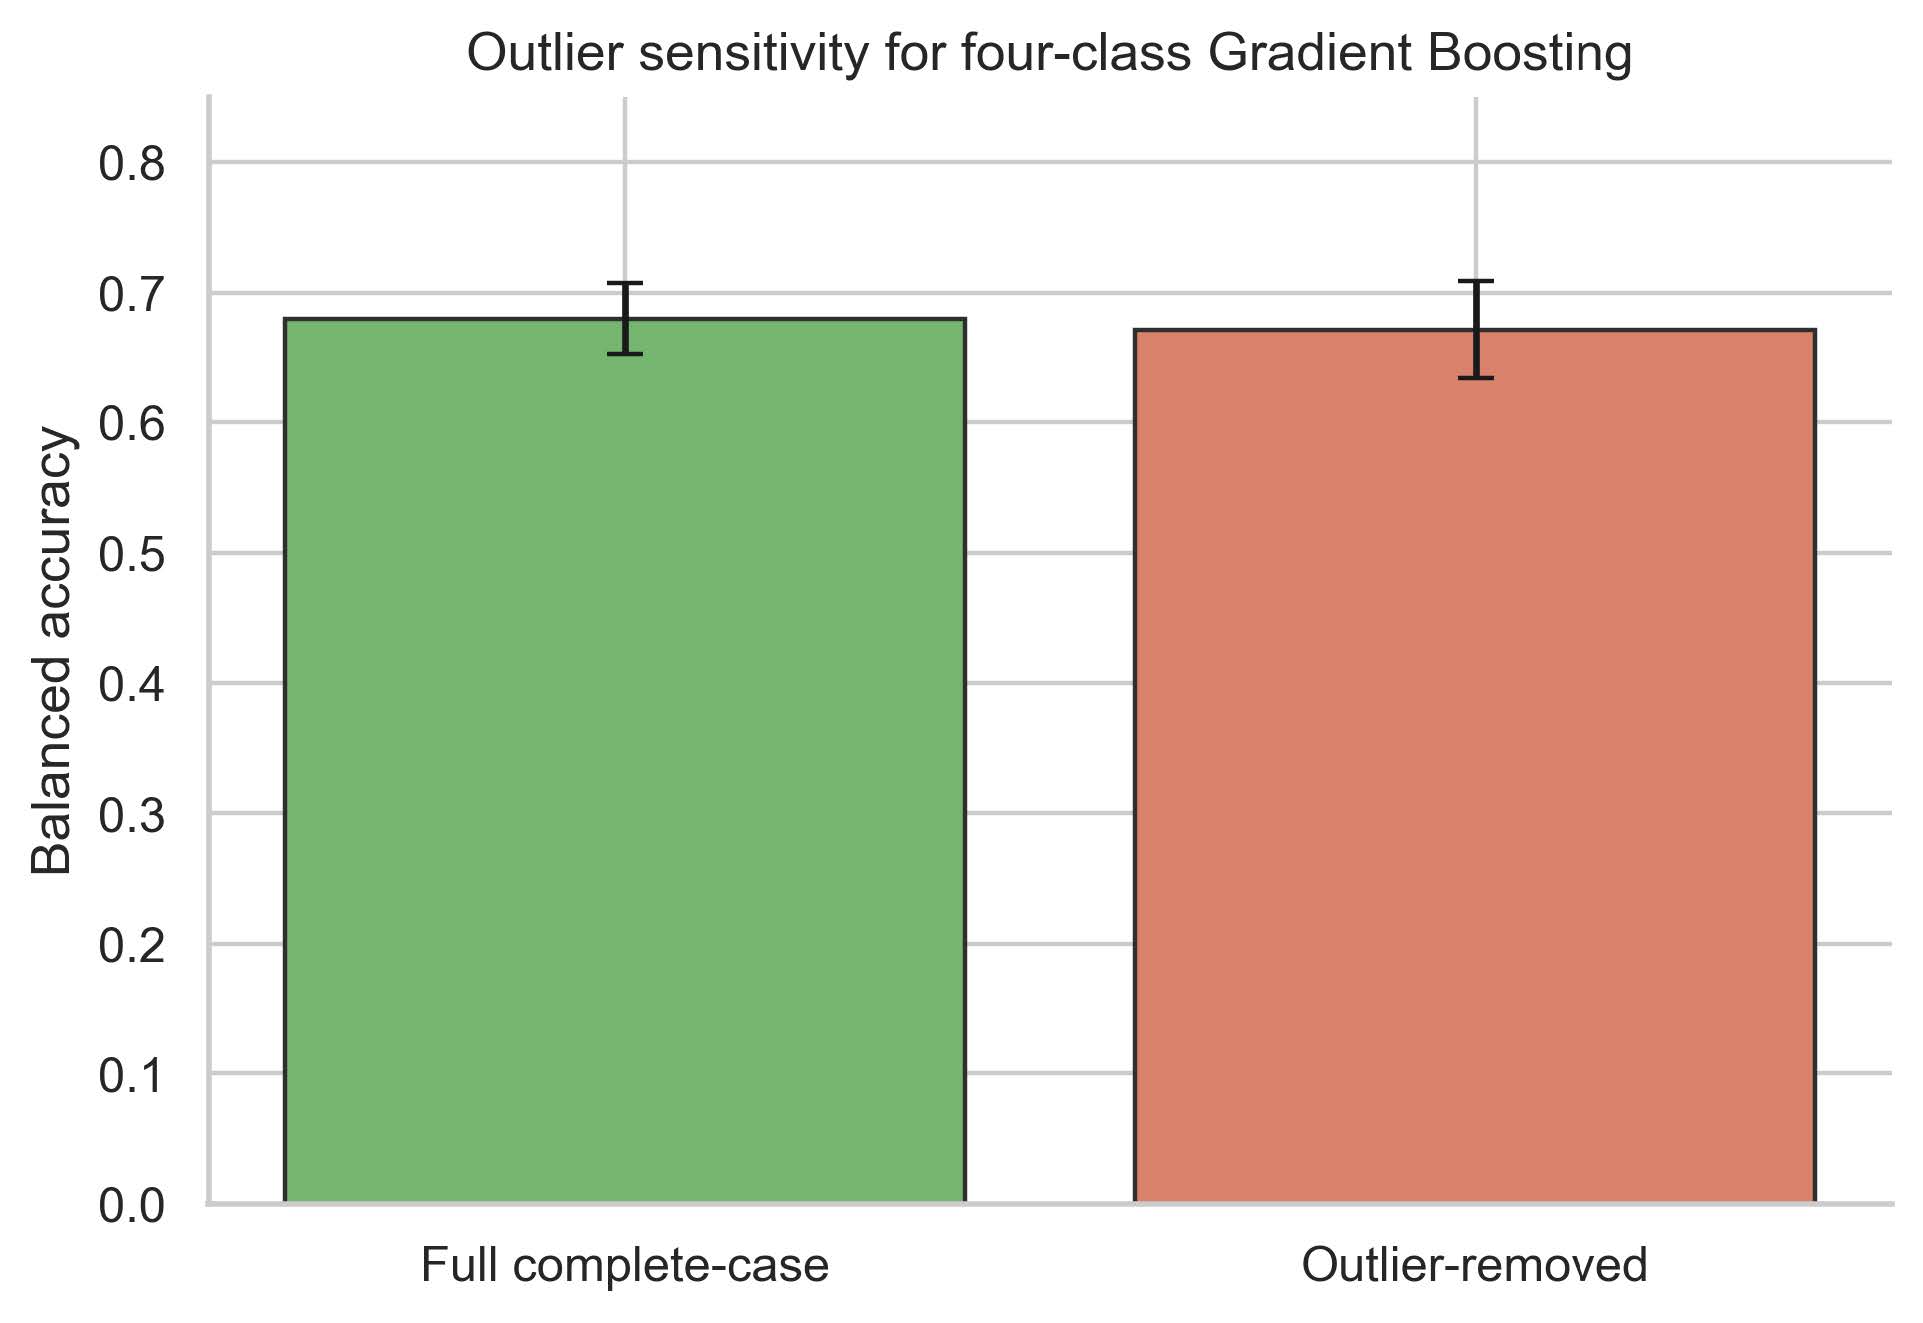
Figure S3. Balanced-accuracy sensitivity before and after 1.5-interquartile range (IQR) salivary-response outlier removal
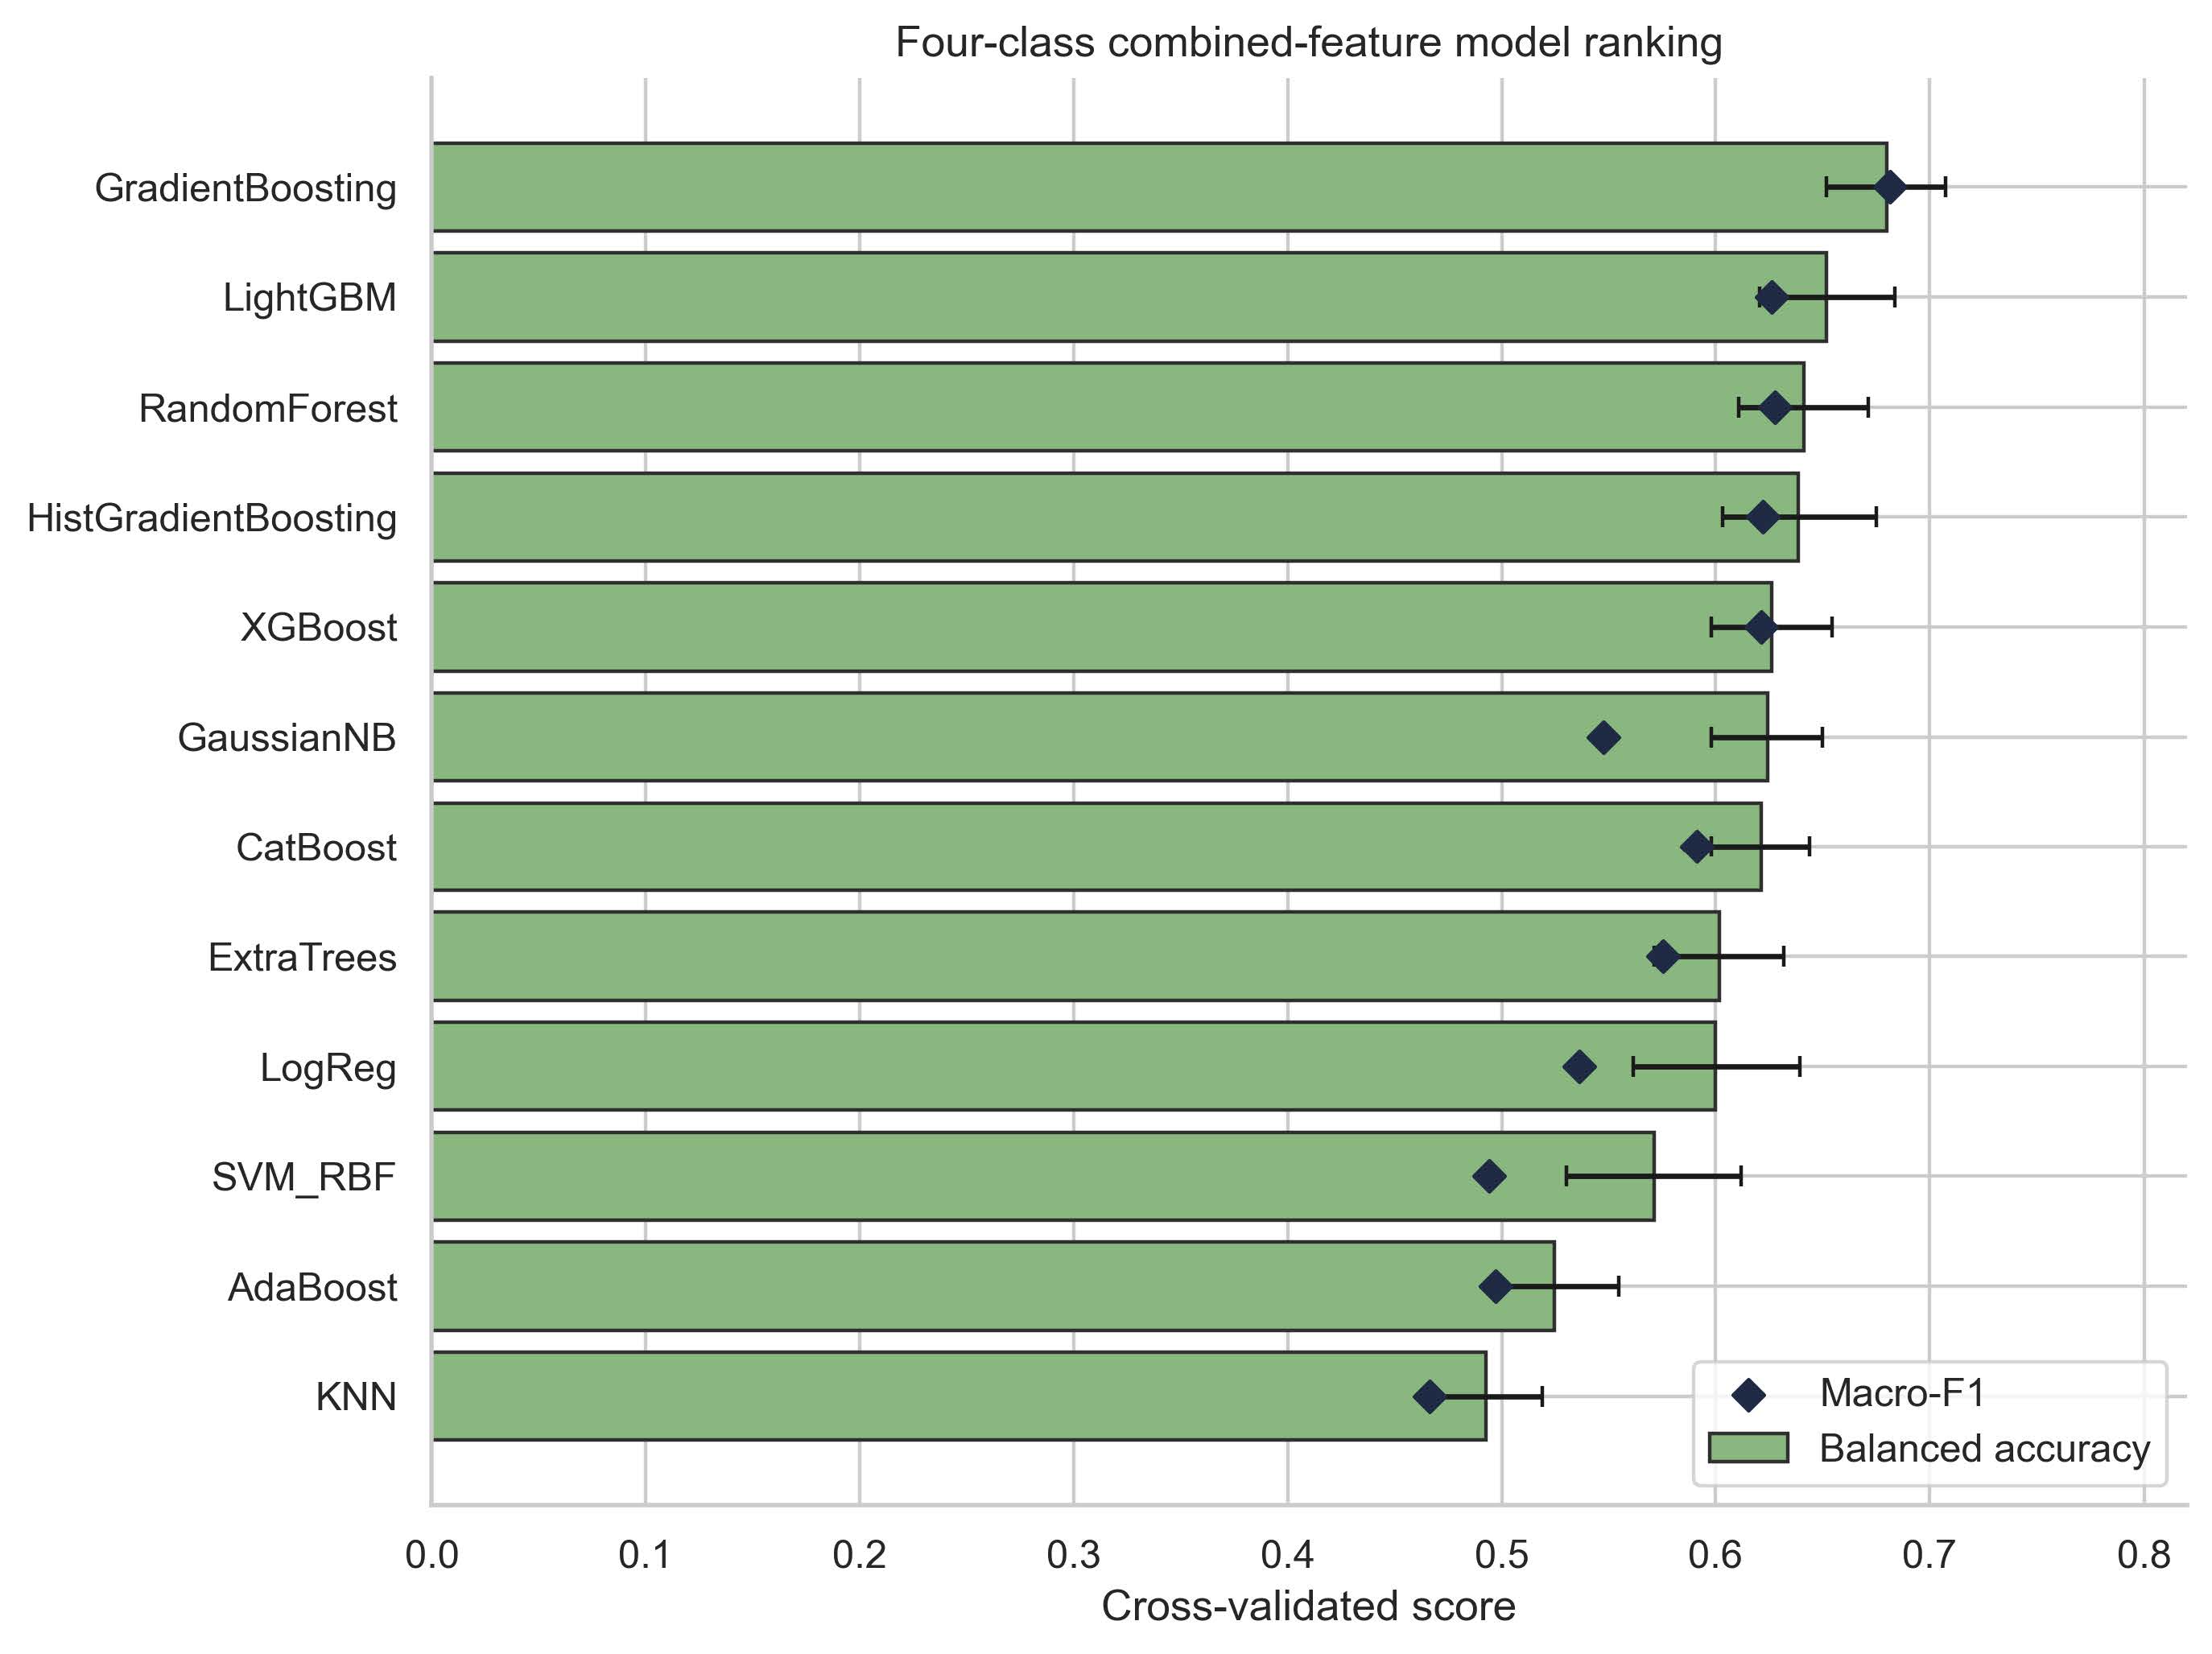
Figure S4. Secondary descriptive four-class combined-feature benchmark across all evaluated classifiers
Note: XGBoost = eXtreme Gradient Boosting; LightGBM = Light Gradient Boosting Machine; CatBoost = Categorical Boosting; SVM-RBF = Support Vector Machine with Radial Basis Function kernel; AdaBoost = Adaptive Boosting; $K$NN = $K$-nearest neighbours; Macro-F1 = Macro-averaged F1-score.
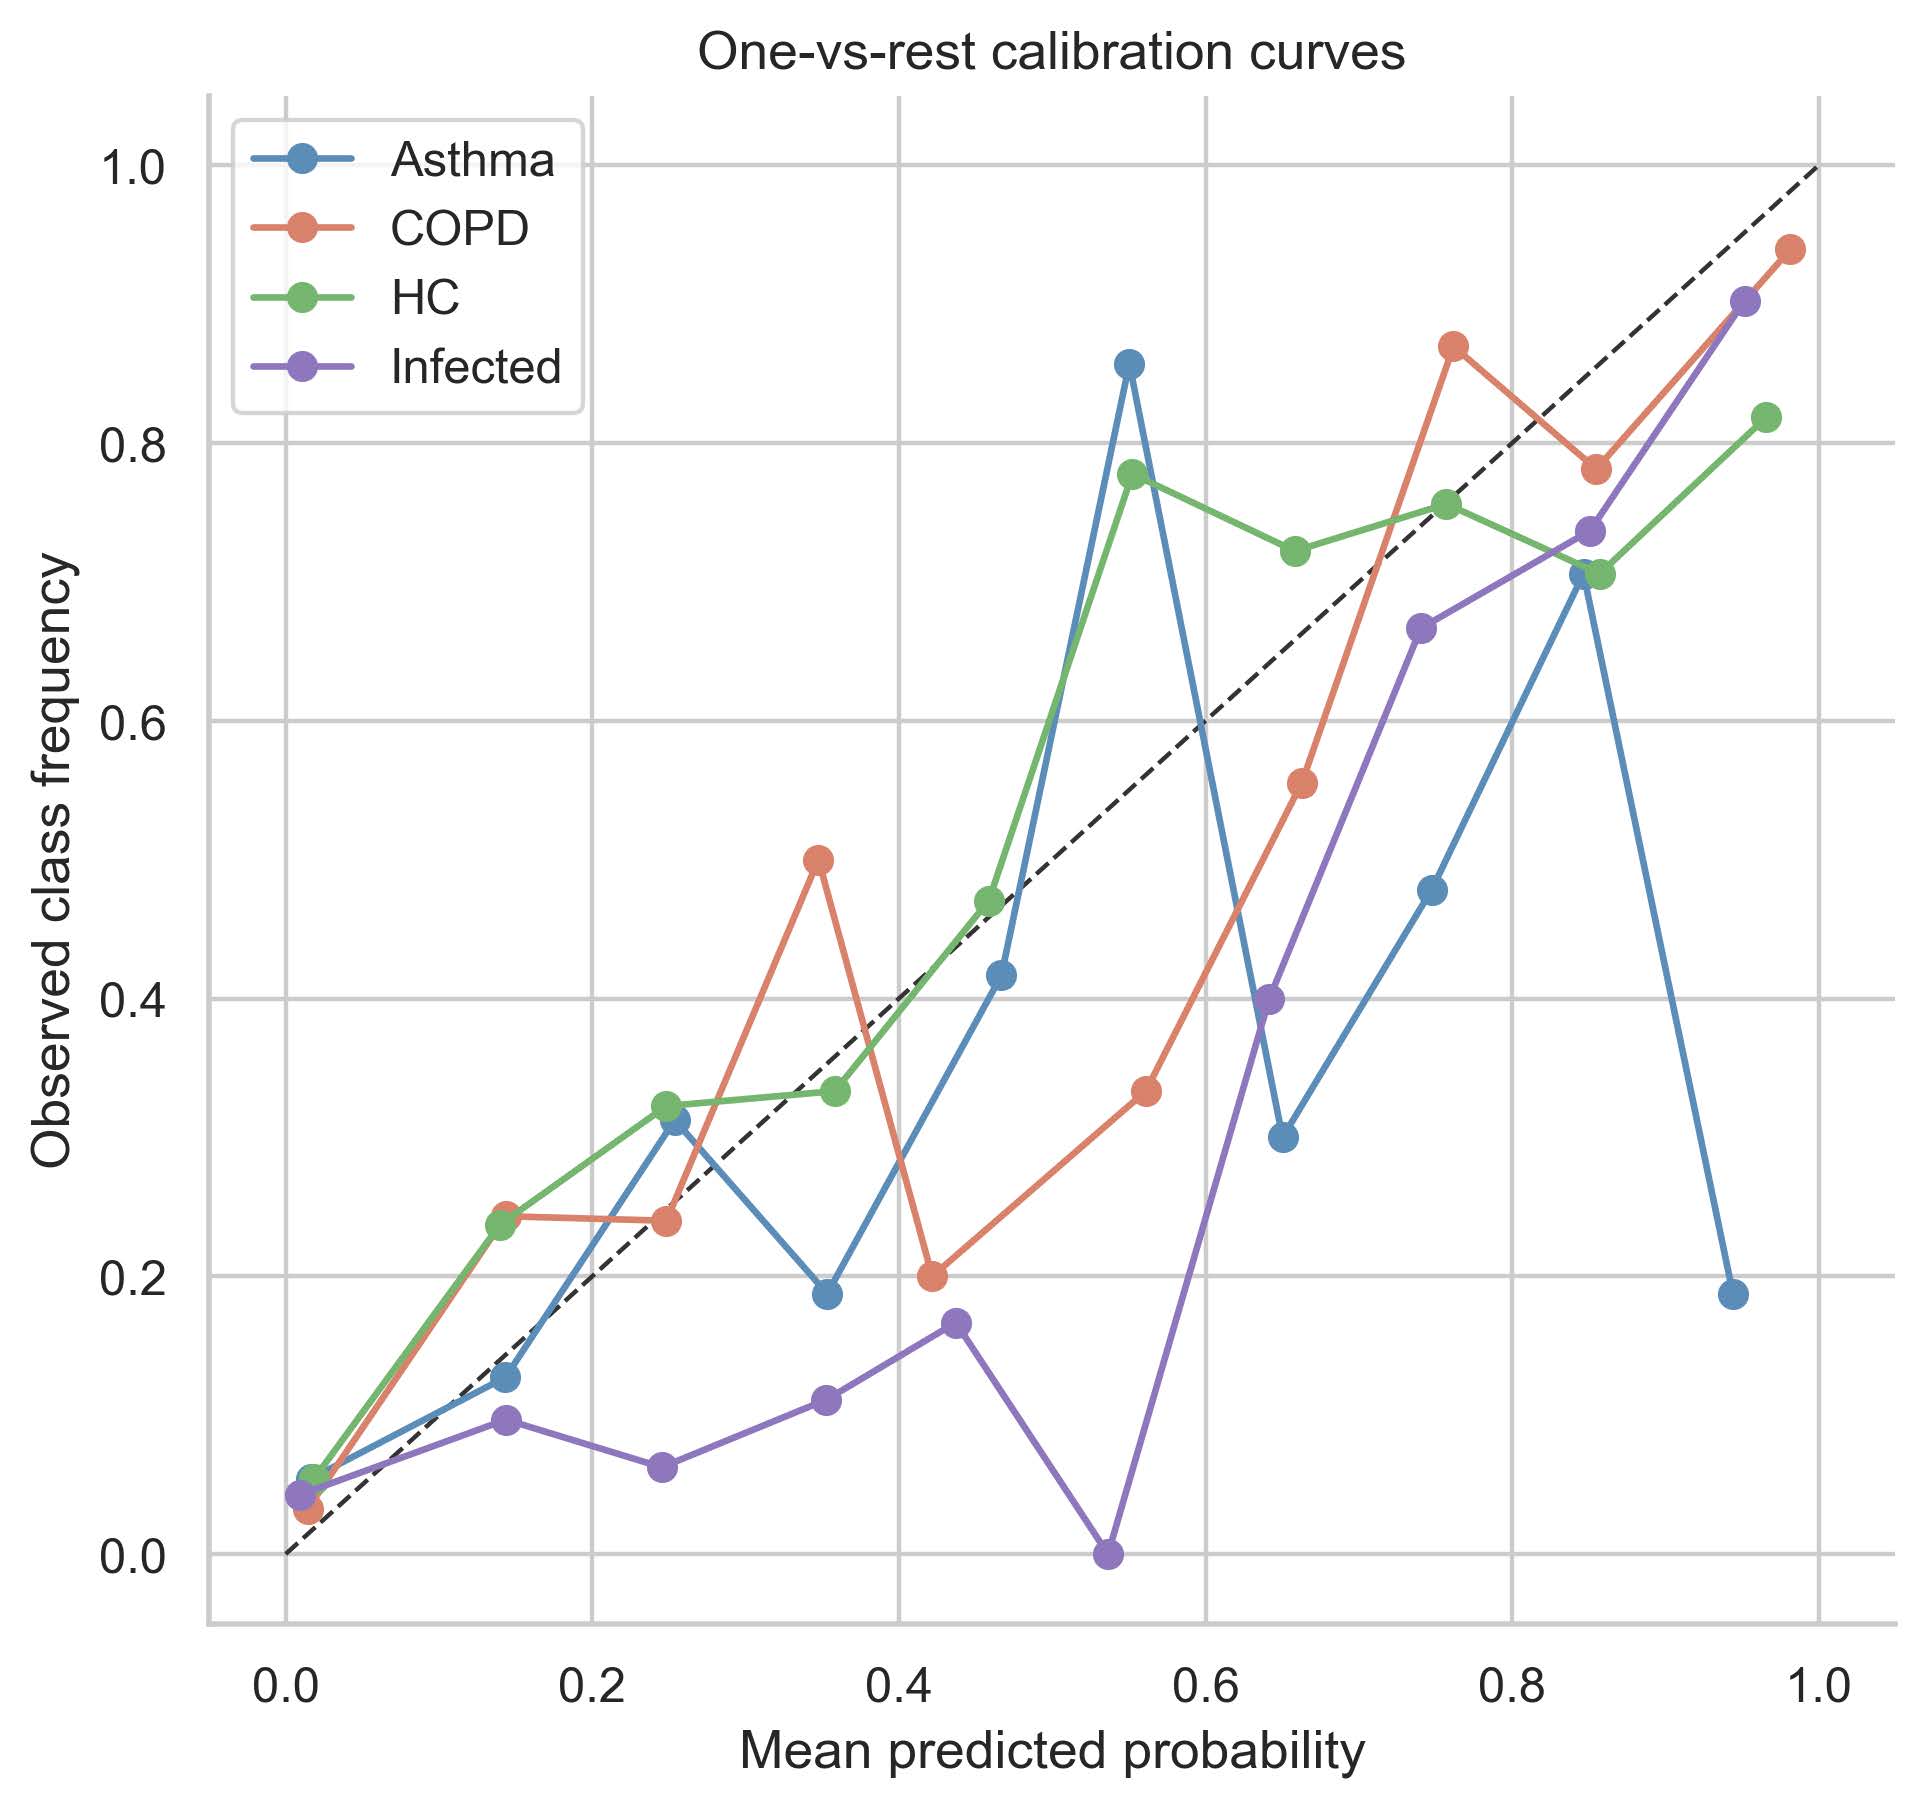
Figure S5. One vs rest calibration curves for repeated out of fold predicted probabilities
Note: COPD = chronic obstructive pulmonary disease; HC = healthy control.
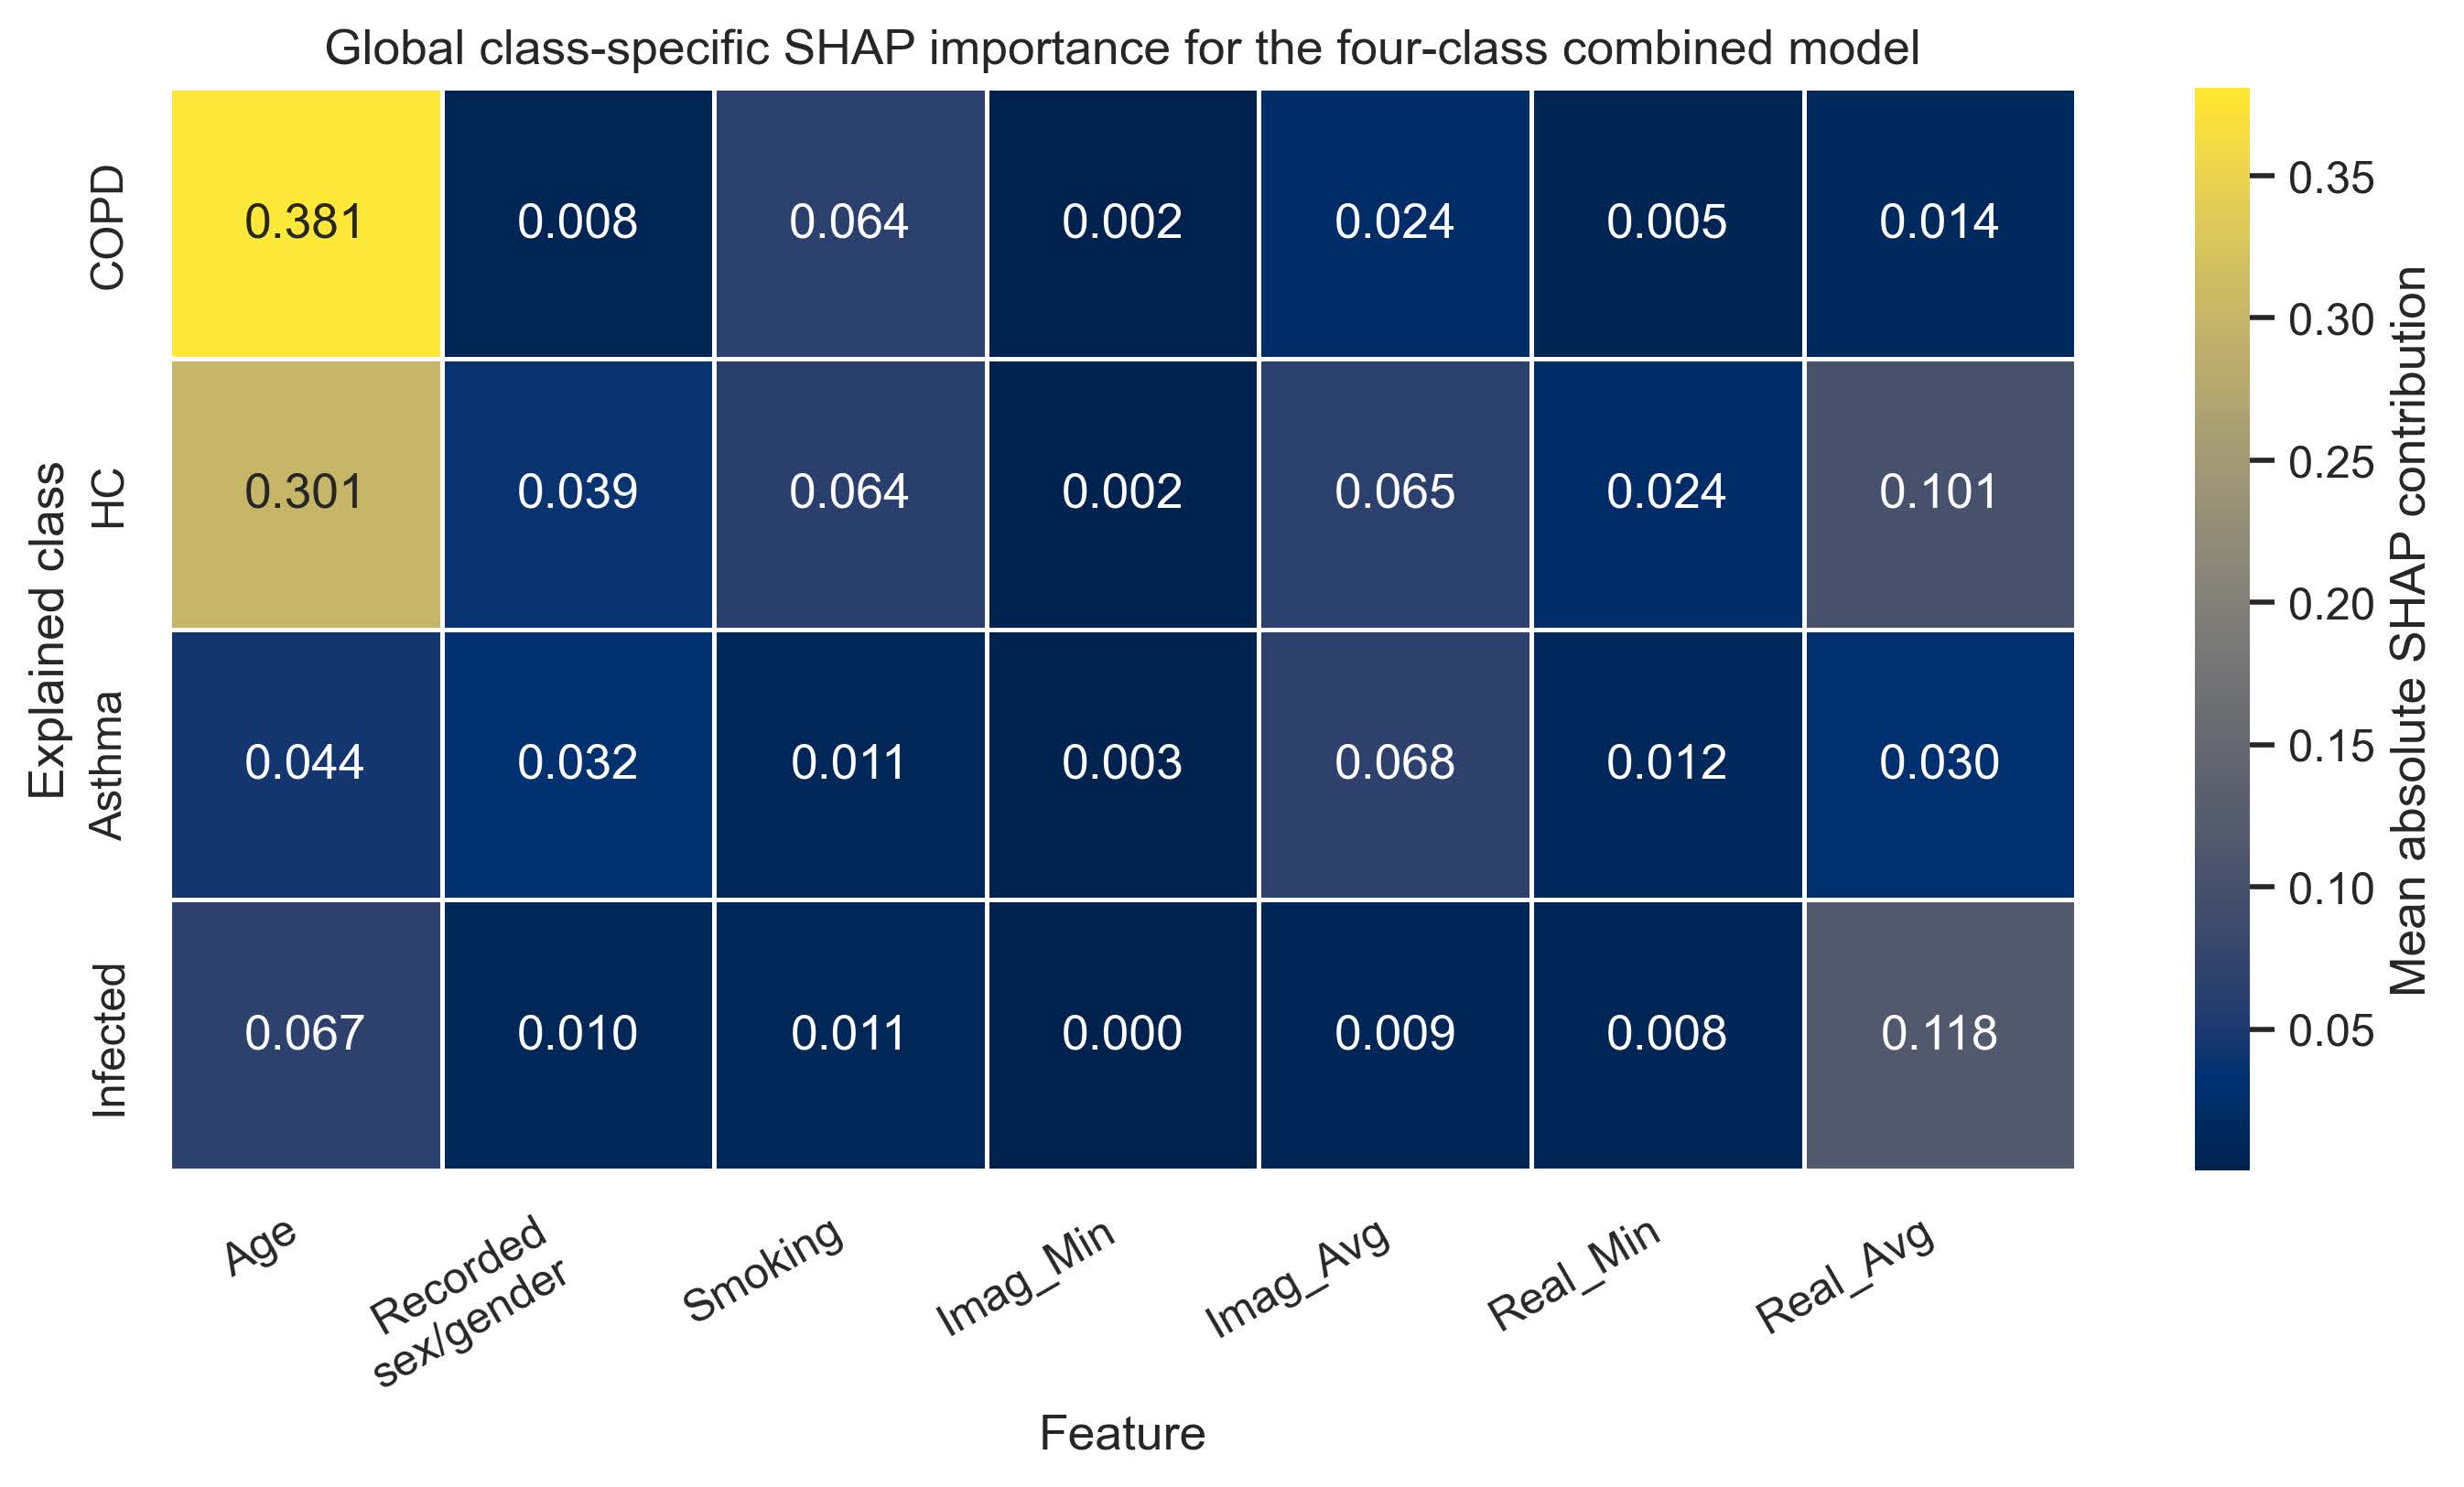
Figure S6. Refitted-model class-specific SHapley Additive exPlanations (SHAP) heatmap
Note: COPD = chronic obstructive pulmonary disease; HC = healthy control; SHAP = SHapley Additive exPlanations; Imag_Min = minimum value of imaginary component; Imag_Avg = average value of imaginary component; Real_Min = minimum value of real component; Real_Avg = average value of real component.
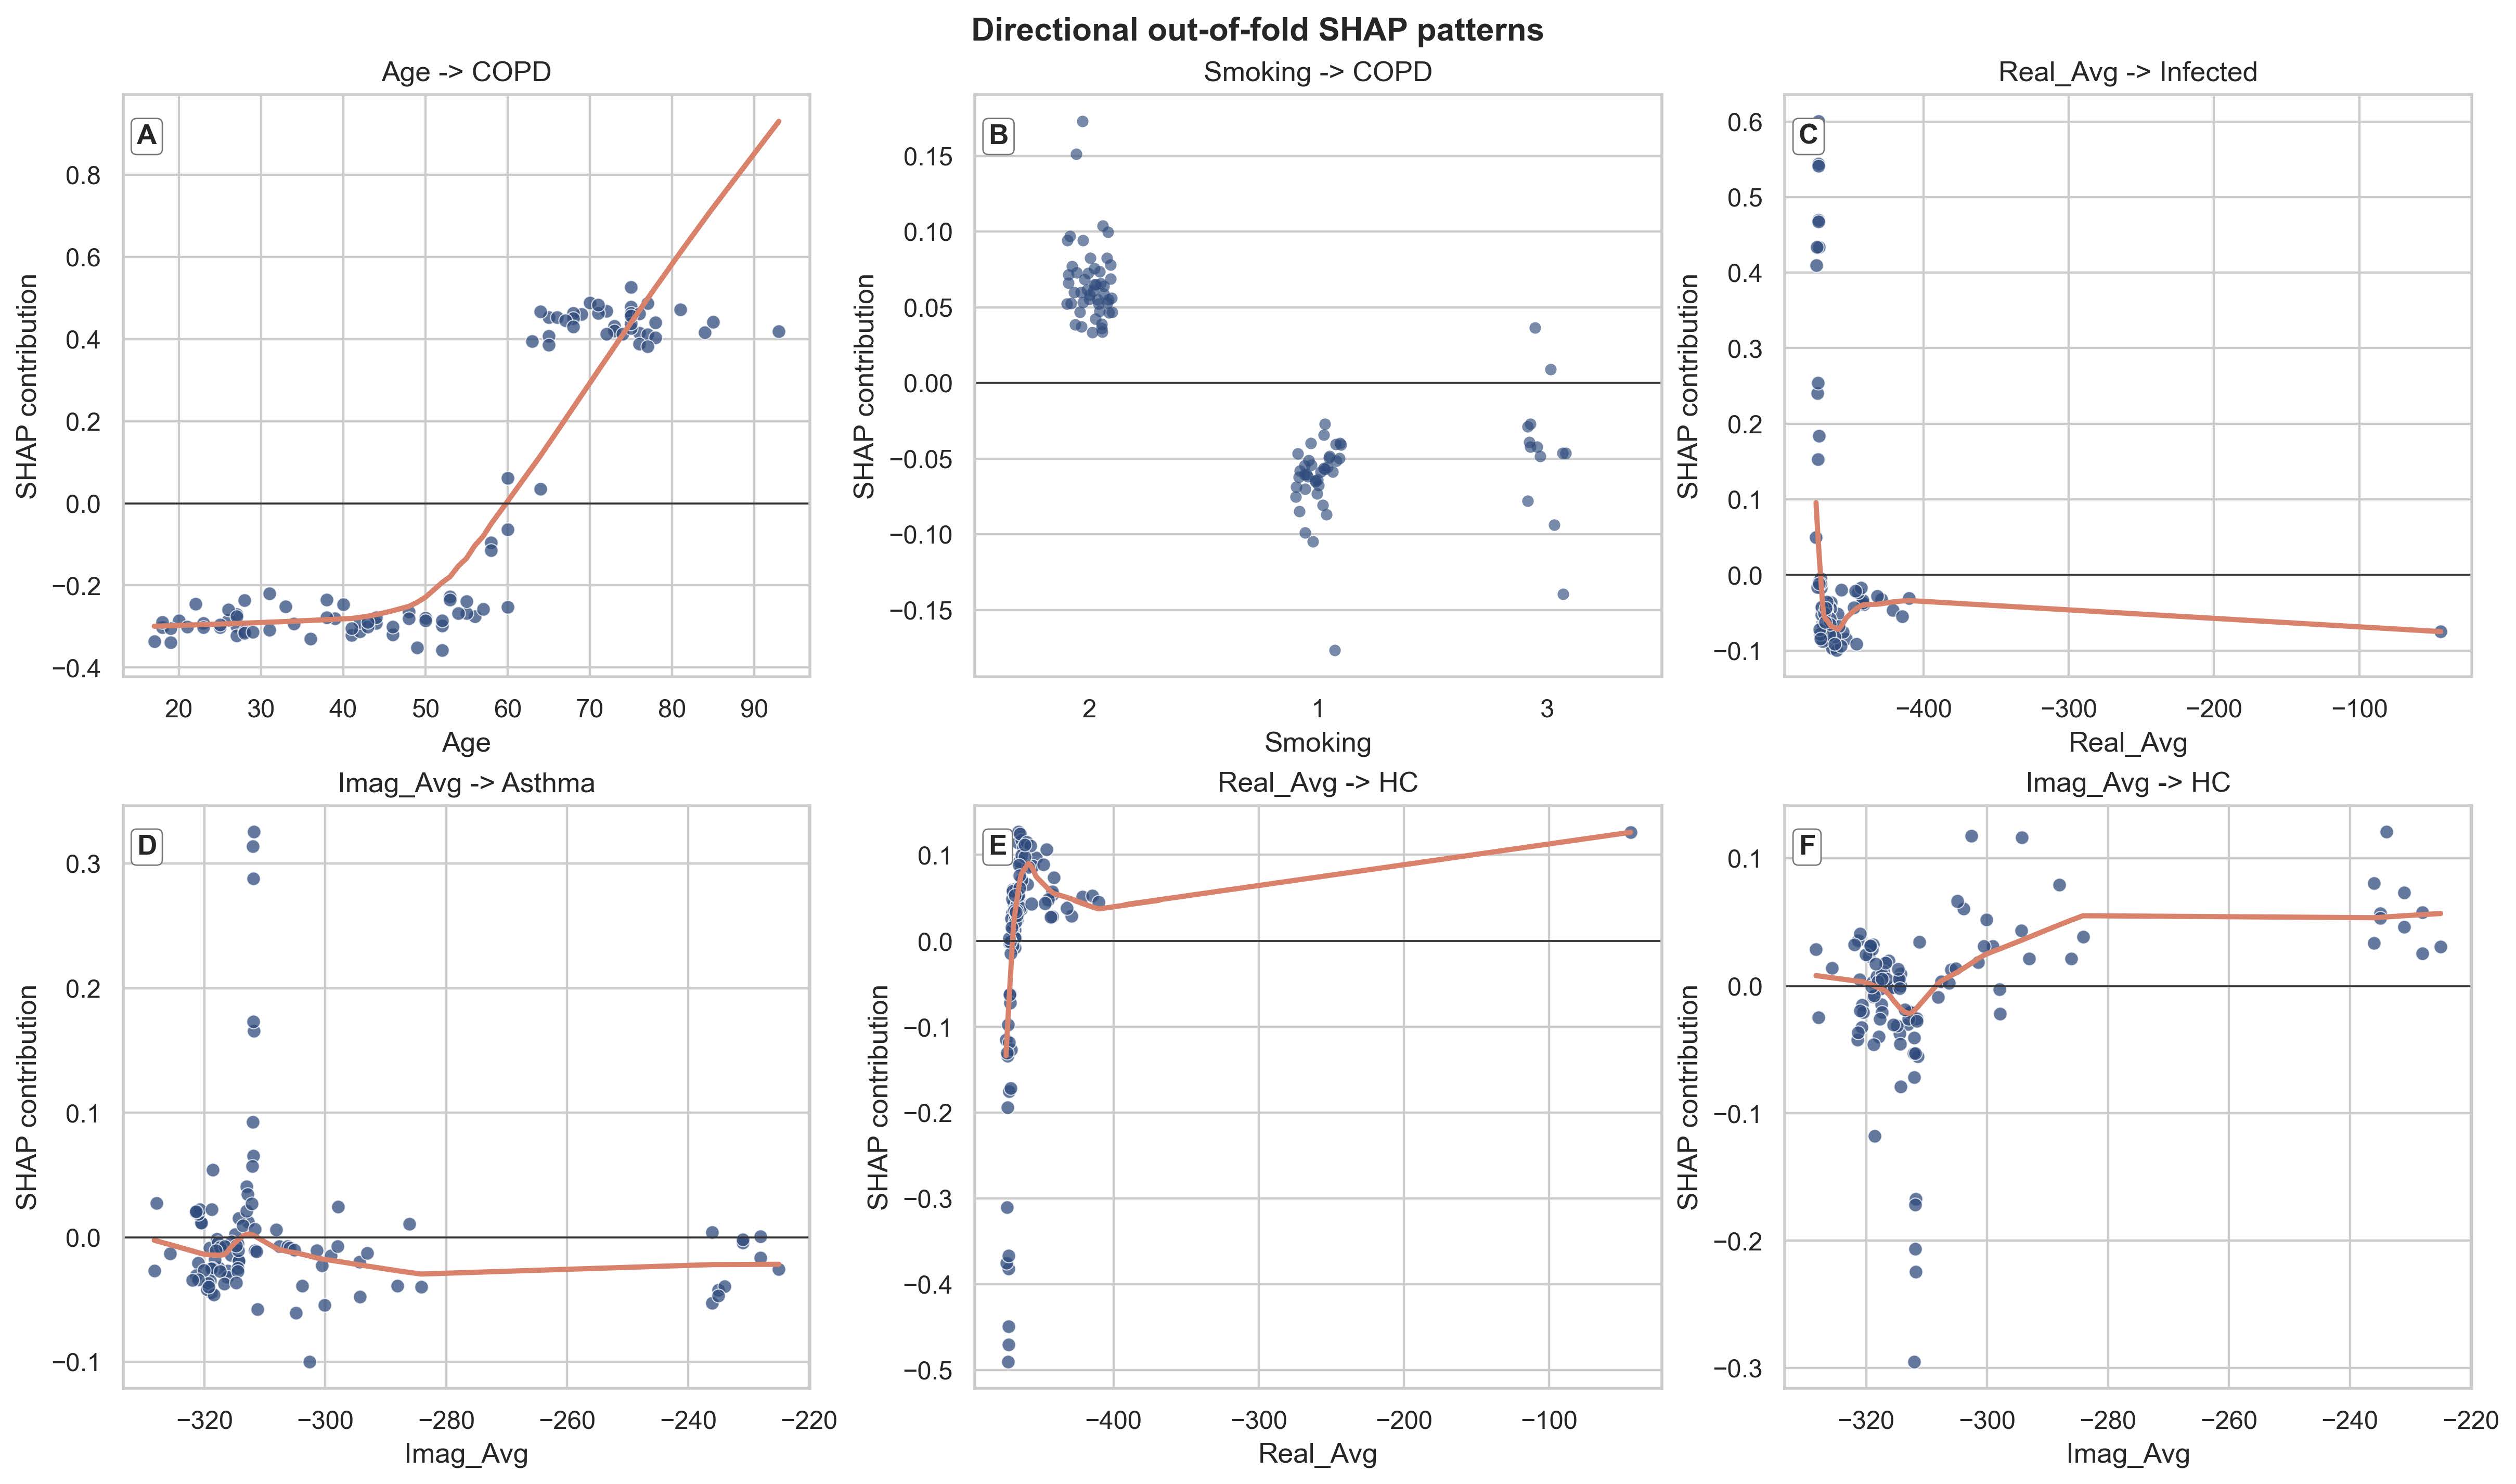
Figure S7. Directional out of fold SHapley Additive exPlanations (SHAP) plots for selected feature class pairs
Note: COPD = chronic obstructive pulmonary disease; HC = healthy control; SHAP = SHapley Additive exPlanations; Imag_Min = minimum value of imaginary component; Imag_Avg = average value of imaginary component; Real_Min = minimum value of real component; Real_Avg = average value of real component.





 Views: 397
 Crossref: 0