FMEA-QFD Approach for Effective Risk Assessment in Distribution Processes
Abstract:
This study applies the FMEA-QFD approach to assess risks in the distribution process, with a focus on warehouse and transport processes, which are commonly associated with user dissatisfaction and customer loss. The methodology identifies the forms, effects, and causes of failures and determines priorities for each category. In that manner, for the warehousing process, long reception time, additional costs, and lack of experience have the highest priority. In the transportation process, time losses, generating additional costs, and longer vehicle retention time are the three failure effects with the highest priorities. Corrective and preventive measures are also defined. The proposed approach is highly applicable in practice and can be modified for use in other industries. This paper contributes both theoretically and practically to the field of logistics.1. Introduction
Logistics companies have increasingly realized the importance of monitoring and maintaining the quality of their services. The quality of services is a key factor in the competitiveness of logistics companies. Due to the numerous and complex activities involved in providing logistics services, there is a certain probability of risk (failures) occurring. One commonly used method by logistics companies to assess and manage risks (failures) is Failure Mode and Effects Analysis (FMEA) [1], [2]. The popularity of this method is primarily reflected in its ease of application. Based on the results of this method, it is possible to determine risk priorities and define preventive-corrective measures to reduce and/or eliminate these risks. In addition to service quality, customer satisfaction is also an important factor in competitiveness. For this reason, logistics companies use numerous tools to determine the quality of their services as well as the degree of customer satisfaction. One of the basic tools used for this purpose is the Quality Function Deployment (QFD) method. Although this method was primarily designed for product design, it has also found application in logistics. In logistics, this method is most commonly used to determine customer requirements for a particular product and/or service, as well as the resources needed to meet those requirements.
Distribution, along with procurement, is one of the basic logistics processes. The distribution process begins with receiving orders from customers and ends with the transport process (i.e., unloading at the destination). This process is particularly important for a company because through this process the company makes contact with the end customer. The quality of this process is a key factor in a logistics company's competitiveness. Since distribution involves a large number of participants and activities, it is necessary to control all activities to avoid quality problems. Based on the above, the aim of this paper is to apply the FMEA-QFD methodology to the distribution process in order to assess the risks (failures) in this process. In addition to risk assessment, the goal is to define preventive-corrective measures to reduce and/or eliminate identified failures [3], [4], [5].
The paper is organized as follows. The second section presents a literature review of related research, which shows that there are many papers that focus on the application of only one of these methods, while on the other hand, there are very few papers that deal with the application of the FMEA-QFD methodology. The third section describes the proposed methodology, while the fourth section provides a detailed analysis of the distribution process and the application of the FMEA-QFD methodology. Finally, the last section concludes the study and highlights future research directions.
2. Literature Review and Problem Description
In the field of logistics, various papers have been published that focus on the implementation of the FMEA method, or the QFD method, as well as the combination of applying these two methods. For example, a study conducted in Bulgaria [6] examined the application of the FMEA model in logistic processes in manufacturing companies, with the aim of identifying a model for improving these processes. The research results showed that the biggest risk in logistics processes is related to delivery delays. Additionally, for 42.86% of the respondents, the risk is also represented by a lack of inventory (as well as changes in the quality of goods in stock). For 21.43% of respondents, the risk is related to a problem they experienced while providing the service.
Similarly, the FMEA method was applied to perform an analysis of cargo carriers in air transport [7], identifying the lack of employee competencies, poor marketing, and information transfer as the highest priority risks. Another study investigated the application of the FMEA method in risk management in the supply chain [8], concluding that most FMEA methodology principles can be applied to reduce risk when selecting suppliers, and that the supply chain can be managed as effectively as products and processes. Šolc [9] applied the FMEA method to determine the most significant risks in logistics processes within the export and internal transport sectors.
Meanwhile, Huang and Yoshida [10] used the QFD method to determine the quality of the delivery service and to define the necessary steps to improve customer satisfaction. The study applied the house of quality to reach four priority measures for increasing quality and user satisfaction.
In healthcare organizations, authors utilized the QFD method to determine the importance of vendor-managed inventory (VMI) in the supply chain improvement process [11]. The study found that VMI plays a vital role in improving the quality of the supply chain process. Additionally, the QFD method was applied [12] to evaluate the service quality of international logistics companies and customer satisfaction. Another study [13] used the QFD method to assess customer satisfaction with the services of 4PL providers, concluding that coordination of operations, management of human resources, and management of the entire supply chain are key factors for customer satisfaction. However, despite the extensive use of FMEA and QFD methods, there is a lack of research on integrating the FMEA-QFD approach, which motivated the current study. The integration of FMEA-QFD methods was applied [14] in order to improve the process of receiving and processing purchase orders.
As already mentioned, the FMEA method has certain shortcomings, and in the literature, there is a large number of papers where this method is applied with other methods, in order to overcome these shortcomings. In addition to the QFD method, fuzzy logic as well as various techniques (DEA, VIKOR, AHP, ANP, DEMATEL, TRIZ) and others are used to improve the FMEA approach [15], [16], [17], [18], [19], [20], [21], [22], [23], [24], [25].
3. Methodology
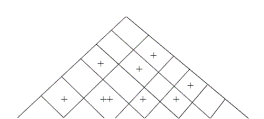
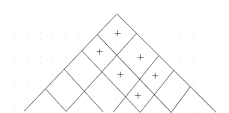
The proposed FMEA-QFD approach in the paper [15], which consists of two phases, was applied in this paper to analyze risks in the distribution process. In the first stage of the proposed approach, the strengths of the connections between the forms of failures and the effects of those failures are evaluated based on the assessments of three logistics experts. The strength of the connection was rated as weak (in which case the value 1 is taken), medium strong (3), and strong (9) [26], and the importance of each failure effect was obtained as an average of three factors (O, S, and D) considered during the FMEA method implementation. The evaluation of the strength of the connections in this paper was carried out based on the assessments of three experts in the field of logistics. In order to obtain unique values, for each of the connections, the average value of individual experts' ratings was calculated. After that, the significance of each effect is multiplied by the estimated strength of the relationship to obtain the total weight of each effect, but also of each form of failure. Based on the total weight, it is possible to set priorities, so that the effect with the highest total weight has the highest priority. In the second phase of the implementation of this method, the failure forms (which in the first phase were placed horizontally) now become vertical elements that are compared with the causes of the failure (which in this phase were placed horizontally in the house of quality). In this phase, the significance of the failure form is determined based on the priorities obtained in the first phase, as follows. The form of failure that had priority 1 in the first phase has a significance of 1/1=1 in the second phase, a form of failure that has priority 2, now in the second phase has a significance of ½=0.5, and so on. After determining the importance and strength of the relationship between the form and the cause of the failure, the procedure from the first stage is repeated, when the total weight is obtained by multiplying the importance and strength of the relationship. Priorities are determined based on the value of the total weight. In addition, in the second stage, it is necessary to determine the strength of the connection between the causes of the failure in order to form the "roof" of the house of quality. The strength of that connection can be very positive (++), positive (+), negative (-), and very negative (--).
FMEA is a method used to study failures in various systems and processes, with the primary objective of identifying potential defects or faults and determining corrective measures to reduce risks. The primary objective of FMEA is to identify potential defects or faults in the observed system and to determine corrective measures that can help reduce risks. One of the significant advantages of failure detection through FMEA is that it can help increase safety and service reliability while simultaneously reducing warranty and service costs. Furthermore, FMEA can also help shorten the development process, increase compliance with planned terms, process efficiency, and customer satisfaction. To prioritize failures, FMEA uses a risk priority number (RPN) that is a product of three different risk factors: severity (S), occurrence (O), and detection (D). Severity describes the seriousness or effects of the failure. Each effect is assigned a severity number ranging from 1 (no danger) to 10 (critical). In this paper, we will be using the severity ratings proposed in the study [27] to assess the severity of various failures (Table 1).
Rating | Effect | Severity of effect |
10 | Hazardous without warning | Very high severity ranking when a potential failure mode effects safe system operation without warning |
9 | Hazardous with warning | Very high severity ranking when a potential failure mode affects safe system operation with warning |
8 | Very high | System inoperable with destructive failure without compromising safety |
7 | High | System inoperable with equipment damage |
6 | Moderate | System inoperable with minor damage |
5 | Low | System inoperable without damage |
4 | Very low | System operable with significant degradation of performance |
3 | Minor | System operable with some degradation of performance |
2 | Very minor | System operable with minimal interference |
1 | None | No effect |
Occurrence describes the probability of failure appearance. Ratings for failure probability proposed [27] are used in this paper (Table 2).
Rating | Probability of occurrence | Failure probability |
10 | Very high: failure is almost inevitable | >1 in 2 |
9 | 1 in 3 | |
8 | High: repeated failures | 1 in 8 |
7 | 1 in 20 | |
6 | Moderate: occasional failures | 1 in 80 |
5 | 1 in 400 | |
4 | 1 in 2000 | |
3 | Low: relatively few failures | 1 in 15,000 |
2 | 1 in 150,000 | |
1 | Remote: failure is unlikely | <1 in 1,500,000 |
The detection rating in FMEA refers to the ability to identify a failure before it reaches the customers, with a high detection number indicating a low chance of detection [28]. Detection ratings used in this paper are shown in Table 3.
Rating | Detection | Likelihood of detection by design control |
10 | Absolute uncertainty | Design control cannot detect potential cause |
9 | Very remote | Very remote chance the design control will detect potential cause |
8 | Remote | Remote chance the design control will detect potential cause |
7 | Very low | Very low chance the design control will detect potential cause |
6 | Low | Low chance the design control will detect potential cause |
5 | Moderate | Moderate chance the design control will detect potential cause |
4 | Moderately high | Moderately high chance the design control will detect potential cause |
3 | High | High chance the design control will detect potential cause |
2 | Very high | Very high chance the design control will detect potential cause |
1 | Almost certain | Design control will detect potential cause |
After these three basic steps, the risk priority number (RPN) is calculated. After ranking the severity, occurrence, and detectability, the RPN can be easily calculated by multiplying these three numbers: RPN = S × O × D. The failure modes with the highest RPN should have the highest priority for corrective actions.
The Quality Function Deployment (QFD) method was developed with the goal of meeting and satisfying customer requirements through the design and improvement of products and services. This method begins by identifying customer requirements, which are then translated into specific product or service characteristics. Critical points in the production or service delivery process are then identified, and a process for addressing these points is established. The "voice of the customer" is a primary driver of the QFD method, which aims to determine what customers want from a product or service and define steps to fulfill those needs. Originally intended for design and development, the QFD method has expanded to other areas of business, including marketing, sales, production, control, and logistics. In logistics, the QFD method is primarily used to develop logistics service providers' services. This method can be applied to both the development of a new product or service and the improvement of an existing one. The process of implementing the QFD method includes several steps, adapted from [29]:
Step 1 – Identify the WHATs.
Step 2 – Identify the HOWs.
Step 3 – Assign priority weights to the WHATs.
Step 4 – Determine the relationship between WHATs and HOWs using a three-point scale: weak relationship (1), medium-strong relationship (3), and strong relationship (9). These relationships are based on the opinion of experts.
Step 5 – Compute the overall priorities of WHATs and HOWs in the following way: the relative weights of the WHATs are multiplied by the strength of the relationship after which row and column sums are determined in order to obtain the values of the total weights for WHATs and HOWs.
4. Risk Analysis in the Distribution Process
This paper analyzes the distribution process, whichconsists of the following processes: ordering, storage, packaging, inventory management, and transportation (Figure 1). The process of receiving and processing orders precedes and initiates the distribution process, and it can be classified into two types: orders received and processed by suppliers and orders received and processed by customers. This paper focuses on warehousing and transportation processes.

The warehousing process is the first process analyzed in this paper. The most common forms of failures observed in this process are longer goods reception times, labeling goods failures, controlling goods problems, unassigned storage locations, longer order picking times, and poor order picking routing. The effects of these failures are time loss, generating additional costs, increased vehicle retention, incorrectly labeled goods, inadequate quantity and quality of goods, pallet retention at the receiving front, delay in shipment, and return of goods from the delivery point (Table 4). Time loss is directly related to longer receiving time of goods, labeling failures, problems with controlling goods, inaccurate storage location, longer picking time, and poor picking routing, and for this reason, the strength of the connection in all cases are evaluated as strong (9). Generating additional costs is similarly affected, except that only the absence of an accurate storage location has no significant impact on this failure effect. Increased vehicle retention occurs as a result of longer receiving time of goods and problems that may arise during the control of goods, and for that reason, the strength of the connection of this effect with the aforementioned forms of failure is evaluated as strong (9). The impact of incorrectly labeled goods on longer receiving time of goods and failures in labeling goods is also evaluated as strong (9). An incorrectly attached barcode can cause problems during the receiving and control of goods, and the strength of the connection between this effect and the failure form is evaluated as medium-strong (3). Incorrectly labeled goods can lead to longer picking times, but the likelihood of this failure occurring is low due to checks in the warehouse, and the strength of the connection is rated as medium-strong (3). Inadequate quantities and quality of goods are directly related to longer receipt times, labeling failures, and problems during goods inspection, and the strength of the connection between these effects and the mentioned types of failures is rated as strong (9). The inadequate quality of goods is directly related to longer receipt and inspection times, and the strength of the connection is rated as strong (9). Damaged goods can affect longer order picking times, and the strength of the connection is rated as medium-strong.
Keeping the pallet at the receiving dock is directly related to longer receiving times, labeling goods failures, controlling goods problems, and the inability to store the pallet due to the unassigned location. For this reason, a strong connection (9) has been established between this failure effect and the mentioned forms of failure. Labeling failures that can result in longer picking times can also affect delays in delivery, and the strength of the connection is rated as medium-strong (3). Longer picking times and poor routing of the picker directly affect delivery delays, and the strength of the connection is assumed to be strong (9). Due to poorly labeled goods, the end-user may refuse to accept the goods, and the strength of the connection is rated as medium-strong (3). Delivery delays due to longer picking times and, therefore, late delivery can result in product returns, and the strength of the connection is rated as strong (9).
Effects of failure | Importance | Forms of failure | |||||||
Longer reception time of goods | Failure in labeling of goods | Goods control | Storage location not assigned | Longer order picking time | Poor routing of order picking process | Total weight | Priority | ||
Time losses | 10 | 9 / 90 | 9 / 90 | 9 / 90 | 9 / 90 | 9 / 90 | 9 / 90 | 540 | 1 |
Generating additional costs | 10 | 9 / 90 | 9 / 90 | 9 / 90 | 9 / 90 | 9 / 90 | 450 | 2 | |
Increased vehicle retention time | 8 | 9 / 72 | 9 / 72 | 144 | 6 | ||||
Incorrectly labeled goods | 6 | 9 / 54 | 9 / 54 | 3 / 18 | 3 / 18 | 144 | 6 | ||
Inadequate quantity of goods | 8 | 9 / 72 | 9 / 72 | 9 / 72 | 216 | 4 | |||
Inadequate quality of goods | 9 | 9 / 81 | 9 / 81 | 3 / 27 | 189 | 7 | |||
Pallet retention at receiving front | 8 | 9 / 72 | 9 / 72 | 9 / 72 | 9 / 72 | 288 | 3 | ||
Shipment delay | 8 | 3 / 24 | 9 / 72 | 9 / 72 | 168 | 5 | |||
Goods return from the delivery place | 9 | 3 / 27 | 9 / 81 | 108 | 8 | ||||
Total weight | 531 | 429 | 495 | 162 | 378 | 132 | |||
Priority | 1 | 3 | 2 | 5 | 4 | 6 | |||
In addition to the aforementioned types of failures, Table 5 presents the most common causes of failures in the warehousing process. Potential causes include a lack of workers, order pickers’ failure, lack of experience, administrative failure, lack of concentration, and short deadlines. The lack of workers most often leads to failures such as longer receiving and picking times, and the connection between this cause and types of failures is assessed as strong (9). Order picker failure leads to longer picking times, and a strong connection is assumed. Lack of experience can be the cause of more failures, and a strong connection is assumed between this cause and longer receiving and picking times, labeling goods failures, and inspection failures. Choosing an inadequate picking strategy can lead to problems with the poor routing of pickers, and the strength of the connection is assessed as medium-strong (3). Administrative worker failures are directly related to longer receiving times, failure to assign a storage location, and poor routing of pickers, and a strong connection is estimated (9). Lack of concentration can be related to all types of failures, but the strength of the connection for longer receiving times, labeling failures, and inspection failures is assessed as strong (9), while for other types of failures, it is assessed as medium-strong (3). Short deadlines have the biggest impact on inventory control, where the strength of the connection is rated as strong. On the other hand, this cause has a medium-strong impact (3) on labeling failures, failure to assign storage location, and poor routing of the pickers. A shortage of workers affects both pickers and administrative failures, and a positive correlation between these causes is assumed. Order picking failure is directly linked to a lack of experience, so a strongly positive relationship is assessed (++). Order picking failure can also occur due to a lack of concentration and short deadlines, and a positive relationship (+) is estimated. A lack of experience also affects administrative workers (+). Administrative failures can be the result of a lack of concentration and short deadlines, and a positive relationship (+) is estimated. Finally, a lack of concentration can be caused by short deadlines and excessive workload, and a positive relationship (+) is established between these two causes.
 | ||||||||||
Forms of failure | Importance | Causes of the failure | ||||||||
Lack of workers | Order pickers failure | Lack of experience | Administration failure | Lack of concentration | Short deadlines | Total weight | Priority | |||
Longer reception time of goods | 1 | 9 / 9 | 9 / 9 | 9 / 9 | 9 / 9 | 36 | 1 | |||
Failure in labeling of goods | 0.33 | 9 / 2.97 | 9 / 2.97 | 3 / 0.99 | 6.93 | 4 | ||||
Goods control | 0.5 | 9 / 4.5 | 9 / 4.5 | 9 / 4.5 | 13.5 | 2 | ||||
Storage location not assigned | 0.2 | 9 / 1,8 | 3 / 0,6 | 3 / 0,6 | 3 | 5 | ||||
Longer order picking time | 0.25 | 9 / 2.25 | 9 / 2.25 | 9 / 2.25 | 3 / 0.75 | 7.5 | 3 | |||
Poor routing of order pickers | 0.16 | 3 / 0.48 | 9 / 1.44 | 3 / 0.48 | 3 / 0.48 | 2.88 | 6 | |||
Total weight | 11.25 | 2.25 | 19.2 | 12.24 | 18.3 | 6.57 | ||||
Priority | 4 | 6 | 1 | 3 | 2 | 5 | ||||
Based on Table 6, the priorities in the warehouse process can be observed. The two highest-priority failures are longer receiving times and issues with goods control. To address these failures, preventive-corrective measures such as hiring more workers and providing better training for employees on the control process can be implemented. The two effects with the highest priority are time losses and generating additional costs. To address these effects, hiring additional workers, applying modern order picking technologies (such as pick-by-voice), providing better training for workers, and mentoring new employees can be defined as preventive-corrective measures. A lack of experience and a lack of concentration are the causes with the highest priority. To reduce or eliminate these causes, it is necessary to work on improving the competencies and training of new workers, as well as allowing breaks during work so that employees do not have problems with concentration.
Forms of failure | Priority |
Longer reception time of goods | 1 |
Failure in labeling of goods | 3 |
Goods control | 2 |
Storage location not assigned | 5 |
Longer order picking time | 4 |
Poor routing of order pickers | 6 |
Effects of failure | |
Time losses | 1 |
Generating additional costs | 2 |
Increased vehicle retention time | 6 |
Incorrectly labeled goods | 6 |
Inadequate quantity of goods | 4 |
Inadequate quality of goods | 7 |
Pallet retention at receiving front | 3 |
Delay in shipment | 5 |
Return of goods from the place of delivery | 8 |
Causes of the failure | |
Lack of workers | 4 |
Order pickers failure | 6 |
Lack of experience | 1 |
Administration failure | 3 |
Lack of concentration | 2 |
Short deadlines | 5 |
The application of modern technologies in the warehousing process is primarily reflected through the use of Warehouse Management Systems (WMS). However, in logistics 4.0, in addition to WMS, there is also the use of Radio Frequency Identification (RFID) for identification purposes. RFID technology is particularly significant in reducing risks and failures that occur during the receipt of the goods [31]. By putting the RFID tags on a pallet, it is possible to automatically read the contents of the pallet. Based on the contents, WMS automatically determines and assigns a storage location. This reduces the risks associated with longer receipt times, labeling goods, and determining storage locations. After storing the pallet in the assigned location, the tags send information to WMS about inventory levels, thereby reducing the risk associated with stock shortages. Another solution that can be applied in the warehousing process is the use of Automated Guided Vehicles (AGV). This technology has been applied by the company DB Schenker in its warehouse in Sweden [32]. AGV vehicles are used to transport goods to the picking area, after which picking and packing are done. In this way, it is possible to track the growth of demand as well as the seasonality of certain products. To reduce risks in the picking process, DHL has developed an augmented reality (AR) picking glasses. By using these glasses, a productivity increases of about 15% can be achieved [33]. In addition to improving productivity, the use of these glasses also increases picking accuracy and reduces picking time. The implementation of these technologies would help eliminate many causes of failures, but not the lack of concentration of the picker. In that case, the corrective and preventive measures previously mentioned should be applied for this particular cause of failures.
As shown in Table 7 the most common forms of failures that were considered in this study are longer loading times, poor routing, longer transport times, incorrect delivery addresses, goods damage during loading, and incorrect loading of goods. The effects of these failures were evaluated as time losses, generating additional costs, longer vehicle retention, delays in delivery, return of goods from delivery location, and receipt of returned goods. Time losses and additional costs are the results of all types of failures considered, so a strong connection (9) was assessed. Longer loading times, poor routing, longer transport times, and damage of goods during loading directly affect longer vehicle retention. Therefore, a strong correlation (9) was estimated. Delays in shipment may be due to longer loading times (usually caused by an insufficient number of workers involved in loading) and damage to goods during loading. Since these forms of failures directly affect shipment delays, a strong connection (9) was assessed. The return of goods from the delivery location may be due to poor routing, where due to poor choice of routes during distribution, the truck does not arrive at the delivery location within the defined time (which may lead to goods being returned). However, since the probability of occurrence of this failure is low, the estimated correlation is medium-strong (3). Incorrect delivery addresses as well as incorrectly loaded goods directly lead to returns and transportation of the goods back to the warehouse, and for that reason, a strong connection (9) was assessed.
Effects of failure | Importance | Forms of failure | ||||||||
Longer loading time | Poor routing | Longer transport time | Incorrect delivery address | Damaged goods during loading | Incorrect loaded goods | Total weight | Priority | |||
Time losses | 10 | 9 / 90 | 9 / 90 | 9 / 90 | 9 / 90 | 9 / 90 | 9 / 90 | 540 | 1 | |
Generating additional costs | 10 | 9 / 90 | 9 / 90 | 9 / 90 | 9 / 90 | 9 / 90 | 9 / 90 | 540 | 1 | |
Longer vehicle retention time | 9 | 9 / 81 | 9 / 81 | 9 / 81 | 9 / 81 | 324 | 2 | |||
Delay in delivery | 9 | 9 / 81 | 9 / 81 | 162 | 4 | |||||
Return of goods from the delivery place | 9 | 3 / 27 | 9 / 81 | 9 / 81 | 189 | 3 | ||||
Receipt of returned goods | 8 | 9 / 72 | 9 / 72 | 144 | 5 | |||||
Total weight | 342 | 288 | 261 | 333 | 342 | 333 | ||||
Priority | 1 | 3 | 4 | 2 | 1 | 2 | ||||
In Table 8, the most common causes of failures in the transportation process discussed in this paper are lack of workers, administration failures, lack of experience, driver failures, and order picker failures. The direct consequence of the lack of workers during the loading of goods is a long loading time, and for this reason, a strong connection (9) has been estimated. Additionally, the lack of workers also has an impact on the damage to goods during loading (due to short time frames and increased workload), and for this reason, a medium-strong connection (3) has been estimated. Administrative failures, as a cause, affect poor routing (9), longer transport time (a consequence of poor routing, 3), and failures in delivery addresses (9). Lack of experience, as a cause of failures, is associated with and affects all forms of failures discussed, except for the wrong delivery address (which is a consequence of worker failure in administration). For this reason, a strong connection (9) has been estimated. Driver failures can affect longer transport times and the wrong delivery address (9). On the other hand, order picker failures lead to longer loading times (when the picker lifts up a pallet from the loading area that is not intended for transportation by that vehicle). Given that the loading area is divided into shipment zones, and the probability of this failure occurring is low, a medium-strong connection (3) has been estimated. On the other hand, damage to goods during loading and incorrectly loaded goods are a consequence of order picker failure. For this reason, a strong connection (9) has been estimated. The lack of workers affects driver and order picker failures, and for this reason, a positive connection (+) has been estimated. Administrative failures affect driver and order pickers’ failures and that is why a positive connection (+) has been estimated. On the other hand, the lack of experience directly affects driver and order picker failures, where a strong positive connection (++) has been estimated.
 | ||||||||||
Forms of failure | Importance | Causes of failures | ||||||||
Lack of workers | Administration failure | Lack of experience | Driver failure | Order picker failure | Total weight | Priority | ||||
Longer loading time | 1 | 9 / 9 | 9 / 9 | 3 / 3 | 21 | 1 | ||||
Poor routing | 0.33 | 9 / 2.97 | 9 / 2.97 | 5.94 | 3 | |||||
Longer transport time | 0.25 | 3 / 0.75 | 9 / 2.25 | 9 / 2.25 | 5.25 | 4 | ||||
Wrong delivery address | 0.5 | 9 / 4.5 | 9 / 4.5 | 9 | 2 | |||||
Damaged goods during loading | 1 | 3 / 3 | 9 / 9 | 9 / 9 | 21 | 1 | ||||
Incorrect loaded goods | 0.5 | 9 / 4.5 | 9 / 4.5 | 9 | 2 | |||||
Total weight | 12 | 8.22 | 27.72 | 6.75 | 16.5 | |||||
Priority | 3 | 4 | 1 | 5 | 2 | |||||
The results of Table 9 show the priorities of forms, effects, and causes of failures in the transport process. Based on these results, it can be concluded that longer loading times and damage to goods during loading have the highest priority (1), followed by incorrect delivery addresses and incorrectly loaded goods (2). Employing additional workers is identified as a preventive-corrective measure to reduce such failures. When considering the effects of failures, it can be concluded that time losses and generating additional costs have the highest priority, followed by longer vehicle detention times. By implementing the preventive-corrective measure defined to reduce types of failures, the effects of failures would also be reduced. Lack of experience, order pickers’ failures, and lack of workers are identified as the three highest priority causes. Preventive-corrective measures that can be implemented to reduce these causes, in addition to hiring more workers, include employee training and providing mentorship (for new employees).
Forms of failure | Priority |
Longer loading time | 1 |
Poor routing | 3 |
Longer transport time | 4 |
Wrong delivery address | 2 |
Damaged goods during loading | 1 |
Incorrect loaded goods | 2 |
Effects of failure |
|
Time losses | 1 |
Generating additional costs | 1 |
Longer vehicle retention time | 2 |
Delay in delivery | 4 |
Return of goods from the place of delivery | 3 |
Receipt of returned goods | 5 |
Causes of the failure |
|
Lack of workers | 3 |
Administration failure | 4 |
Lack of experience | 1 |
Driver failure | 5 |
Order picker failure | 2 |
In transportation, the application of modern technologies such as Transportation Management Systems (TMS) and Intelligent Transportation Systems (ITS) enables real-time tracking and monitoring of vehicles, which can reduce the risks associated with longer transport times, poor routing, and delivery to the wrong address. Additionally, the use of sensors and RFID tags make it possible to determine the arrival time of vehicles at the unloading site. Based on this information, preparation of the receiving front (ramp) can be done to shorten the unloading time of goods. Through real-time data tracking, the application of ITS enables better decision-making and increases flexibility and efficiency. In addition, the application of ITS allows for the planning and synchronization of multimodal transportation, estimation, and monitoring of CO2 emissions, reduction of fuel consumption, and more. In transportation, the use of AGV vehicles is present, especially in container terminals, where these vehicles are used for transporting containers from the unloading point to the disposal area. The implementation of these technologies would impact most of the risks associated with the transportation process. However, the application of these technologies would not address the shortage of workers, which is particularly pronounced in today's times, as well as the lack of experience. To reduce and/or eliminate these risks, it is necessary to apply the aforementioned preventive-corrective measures.
5. Concluding Remarks
The satisfaction of customers is heavily reliant on the quality of the distribution process. As such, it is imperative to continuously monitor and improve this process. FMEA and QFD methods are widely recognized in the literature for their significant importance in improving logistics processes and customer satisfaction. In this paper, the FMEA-QFD methodology was used to evaluate the risks in the product distribution process, which consists of sub-processes such as ordering, storage, packaging, inventory management, and transportation. The application of this methodology resulted in the identification of risk priorities and the definition of preventive-corrective measures aimed at reducing or eliminating failures. The results of the application of this methodology showed that longer reception times of goods and lack of experience were the highest-priority forms and causes of failures, respectively, in the distribution process.
In the warehousing process, time losses, generating additional costs, and lack of experience were identified as the highest-priority effects and causes of failures, respectively. During the transportation process, longer vehicle retention time, time losses, and generating additional costs were identified as the three failure effects with the highest priority. Lack of experience, order pickers’ failures, and lack of workers were identified as the causes of failures in the transport process with the highest priorities. Additionally, longer loading time, damaged goods during loading, wrong delivery addresses, and incorrectly loaded goods were determined as the failure forms with the highest priority.
Preventive-corrective measures were defined for each sub-process of the distribution process based on the obtained results. Future research directions include the application of the same methodology on other subsystems, such as the procurement process, in order to identify failures and define preventive-corrective measures. Additionally, a combination of other approaches and methods for risk assessment, such as MCDM, Simulation, and DEA, is identified as another future research direction. In conclusion, the FMEA-QFD methodology is a valuable tool for assessing risks and defining preventive-corrective measures in the distribution process, and its application can lead to increased customer satisfaction and improved logistics processes.
Vukašin Pajić obtained his MSc degree in 2018 from the University of Belgrade, Faculty of Transport and Traffic Engineering, Department for Logistics. Currently, he is working as a Teaching and Research Assistant in the same department. His research interests are business logistics, procurement logistics, freight forwarding, service quality, logistics process improvement, marketing in logistics, MCDM, etc.
Assoc. prof. Milan Andrejić obtained his PhD degree in 2015 from the University of Belgrade, Faculty of Transport and Traffic Engineering, Department for Logistics. Currently, he is working as an Associate professor in the same department. His research interests are business logistics, efficiency of logistics processes, freight forwarding, service quality, logistics process improvement, marketing in logistics, MCDM, etc. He is a reviewer and a member of the editorial boards of numerous international journals and conferences.
Assoc. prof. dr. Marjan Sternad completed his doctorate at the Faculty of Logistics in 2016 and obtained the title of Doctor of Science. At the end of 2016, he qualified for the title of assistant professor in the field of logistics, and in 2021 he qualified for the title of associate professor in the field of logistics. The fundamental research area of assoc. prof. dr. Marjan Sternad is transport economics and efficiency of logistics systems and supply chain.
The data supporting our research results are included within the article or supplementary material.
The authors declare no conflict of interest.