
 Open Access
Pico–Micro Hydropower Integration for Community-Based Ice Production Microenterprises in Rural Indonesia

 View Full Article|
 Download PDF
Abstract:
Indonesia, an archipelagic nation with more than 17,000 islands, faces persistent challenges in providing reliable electricity to remote communities. Decentralized hydropower offers a sustainable solution by utilizing abundant local water resources. Pico-hydropower and micro-hydropower systems provide cost-effective alternatives for rural electrification while supporting sustainable watershed resource utilization. In this study, a comprehensive identification framework was developed to evaluate the feasibility of integrating pico-hydropower with existing micro-hydropower systems to support community-based ice crystal production microenterprises in Indonesia. Candidate sites were selected using a purposive sampling strategy based on flow continuity, hydraulic head ($\Delta H$), discharge ($Q$), accessibility, and installation suitability. Spatial identification was performed through the integration of Google Earth imagery, unmanned aerial vehicle surveys, and total station measurements, followed by systematic field verification. Repeated field measurements were conducted to reduce measurement uncertainty and improve the reliability and reproducibility of the proposed methodology. Laboratory experiments and field validation were subsequently performed using a pico-hydropower portable turbine equipped with an undershot waterwheel configuration. A total of 60 potential installation sites were identified. Laboratory testing demonstrated that the prototype generated output under flow rates ranging from 11 to 25 L s$^{-1}$, producing sufficient electrical power for 50–100 W light-emitting diode lighting applications. Field validation at 30 representative sites confirmed the technical feasibility of the proposed system. The highest performance was observed at P21, where a rotational speed of 1,543 revolutions per minute and an output voltage of 3.1 V were achieved, providing electrical power equivalent to approximately 100 W under the prototype configuration, whereas the minimum validated performance was recorded at P15 under a discharge of 16 L s$^{-1}$. The results demonstrate that distributed pico-hydropower installations can effectively complement existing micro-hydropower infrastructure, supporting productive applications such as ice crystal production. The proposed framework provides a practical and scalable approach for expanding sustainable decentralized hydropower systems in geographically dispersed regions.
1. Introduction
Indonesia's commitment to net zero emissions by 2060 is a joint effort to reduce global warming and reduce the risk of the effects of rising sea levels which have an impact on the sinking of small islands and reduced land area, shifts in seasons, and the impact of spreading disease and virus outbreaks. The cause of global warming is carbon pollution from fossil energy, which continues to increase in the atmosphere. The impact of economic activity, population growth, energy consumption, and economic development on carbon dioxide (CO$_2$) emissions is the main problem of climate change [1]. In the National Energy Council in 2019, Indonesia scored 6.57 on the energy security index, placing itself in the resilient category. The issue of soaring coal prices in the global market can lead to a shortage of domestic energy supplies in early 2022 and should be considered in the latest assessment [2]. Indonesia and Türkiye have agreed to accelerate the energy transition by expanding cooperation in electric bus procurement through a business-to-business scheme and the Comprehensive Economic Partnership Agreement [3]. Indonesia has a Net Zero Emission 2060 program that must be realized. In 2050, the fulfillment of national energy from new renewable energy is 87%, and in 2060, the fulfillment of national energy is 100% from new renewable energy [4].
An important concern is that Indonesia consists of thousands of islands from Sabang to Merauke. Based on more than 17,000 data points, with an archipelago shape, new renewable energy has the potential to be developed. Therefore, appropriate technology is needed, which is easily used by the community to produce environmentally friendly electrical energy and can be easily found and applied in the community with a small discharge. The potential of pico-hydropower as an alternative source of clean energy that is efficient, reliable, and cost-effective [5]. The community may find it easier to build a pico-hydropower plant according to their financial capabilities, efficiency, economics, water potential, and potential alternative fluid engines in their environment. Regulations for the hydropower classification thresholds are different: $<$1 MW for micro-hydropower plants in Indonesia, $<$0.1 MW for pico-hydropower plants in India, $<$0.005 MW for pico-hydropower plants in Malaysia [6], and $<$0.005 MW for pico-hydropower plants in Egypt and Italy [7].
In general, pico-hydropower uses infrastructure consisting of small weirs, sluice gates, conveyance channels, calming ponds, penstock, powerhouses, and tailraces, while the current problem of pico- and micro-hydropower in Indonesia is waste that can clog the trash rack intake, penstock and interfere with the turbine runner. Therefore, installation of trash-diverting horizontal rack [8] is required. Potential pico-hydropower locations can be identified using Google Earth, topographic maps, unmanned aerial vehicles, and direct field observations [9]. Another problem with pico-hydropower plants is that if management and maintenance are not carried out properly, it is certain that they will not run sustainably. Therefore, the role of the integrated community is very important in the maintenance and operation of the system-based integrated community or spiral-cycle micro-hydropower community system [10]. The pico-hydropower portable turbine is a solution for meeting small-scale energy needs, namely the reduction in infrastructure requirements, because pico-hydropower portable turbines, generators, and lights for street lighting are easy to operate and maintain. Pico-hydropower portable turbine V1.1 is portable, can be easily moved, and has easy-to-find potential because the turbine can produce electricity with the potential of small river flows, tertiary irrigation canals, irrigation of rice fields, fish pond outlets, waste processing installation outlets, and supply and rain gutters. Pico-hydropower portable turbine cuts the cost of civil work infrastructure and only focuses on turbines, generators, and lights. The detailed theoretical basis and calculation methods for determining hydropower potential are presented in Section 2.1.
2. Methodology
Micro-hydropower energy potential is as follows:
where, $\eta$ is the turbine efficiency (%), $\rho$ is the specific gravity of water (1000 kg/m$^3$), $g$ is the gravity (9.86 m/s$^2$), $Q$ is the discharge (m$^3$/s), and $H$ is the head (m). Calculation of the water discharge required to rotate the overshot water wheel is given by :
where, $V$ is the water velocity (m/s), $d$ is the water depth in the channel (m), $b$ is the wet cross-section width (m), $k$ is the fraction of the water content at an angle, and $Q$ is the discharge (m$^3$/s).
The amount of discharge used to drive the undershot water wheel is as follows:
where, $Q$ is the discharge (m$^3$/s), $V$ is the speed of the water flow hit the corner (m/s), $h$ is the head (m), and $g$ is the gravity (9.81 m/s$^2$).
Head identification using Google Earth (macro-spatial):
where, $\Delta H$ potential is the potential head gross (m), $Elv_{p1}$ is the water level elevation at point $a$ (m), and $Elv_{p2}$ is the water level elevation at point $b$ above mean sea level (m).
where, $\Delta H_{potential\, p1-p2}$ is the head gross potential (m); $L_{p1-p2}$ is the irrigation length from $a$ to $b$; and $\Delta H_{p1-p2}$ is the head gross potential (m) from $a$ to $b$.
Head identification using the unmanned aerial vehicle (mezo-spatial):
where, $S c$ is the scale, $CamFL$ is the camera focal length, $\Delta H$ is the flying height above the object, $Elv_{UFL}$ is the top flight altitude, and $Elv_{LFL}$ is the lower flight altitude.
Head identification using the total station (micro-spatial):
where, $\Delta H_{ab}$ is the head from $a$ to $b$; $Elv_b$ is the height of $b$; $h_b$ is the water depth at point $b$; $L_{ab}$ is the distance $a$ from $b$; and $\alpha$ is the slope angle.
Head identification using the potential, The theoretical power ($P$) output of the turbine can be calculated using the following formula:
where, $P_{\max}$ is the maximum output (kW), $He$ is the effective head (m), $Q_{\max}$ is the maximum discharge (m$^3$/s), and $\eta t$ is the turbine efficiency.
This comprehensive research is divided into three stages (Table 1). Research sites were selected using a purposive sampling method based on hydrological potential and technical feasibility for installing the pico-hydropower portable turbine. Site selection criteria included water flow continuity, head magnitude ($\Delta H$), discharge ($Q$), ease of survey access, and the representation of various water source types-such as small streams; primary, secondary, and tertiary irrigation canals; fish pond outlets; wastewater treatment plant outlets; and stormwater drainage channels. The identification process was carried out in stages: using Google Earth for the initial identification of potential sites, unmanned aerial vehicles to obtain higher-resolution topographic data, and total stations for detailed measurements requiring higher precision. All identification results were subsequently verified through field surveys, while head and discharge measurements were repeated to minimize error. This tiered approach enhances data reliability, facilitates methodological replication, and ensures that the selected sites represent the hydrological conditions commonly encountered in the Special Region of Yogyakarta.
Stages | Stages of Activity | Methods and Equipment | Target of Results |
First stage | Macro-spatial | Potential identification using Google Earth | Knowing the location of micro-hydropower and pico-hydropower from aerial images through indications of a waterfall |
Mezo-spatial | Unmanned aerial vehicle | Aerial photograph of the condition of the potential waterfall and the actual situation in the current environment (head, $\Delta H$) | |
Micro-spatial | Total station | Topographic drawings (detailed engineering design) (head, $\Delta H$) | |
Potential point | Waterpass (conventional) water hose and ruler, long ruler | The difference in the height of the waterfall (head, $\Delta H$) | |
Second stage | Testing the pico-hydropower portable turbine V1.1 in the hydraulics laboratory with flume | Pico-hydropower turbine testing, flume (30 $\times$ 10) | Rotational speed (revolutions per minute), output voltage ($V$), and successful lamp illumination |
Third stage | Testing the pico-hydropower portable turbine V1.1 in the field | Testing of the voltage and flame of the lamp directly in the field at the selected pico-hydropower location | Rotational speed (revolutions per minute), output voltage ($V$), and successful lamp illumination |
This research was carried out around the irrigation channel in Yogyakarta, Indonesia, and the experiments were conducted at the Laboratory of Hydraulics, Department of Civil and Environmental Engineering, Faculty of Engineering, Gadjah Mada.
Figure 1 shows a complete detailed drawing of a portable submersible pico-hydropower turbine, consisting of a power generator, axle shaft, and turbine wheel. Figure 2 presents the technical specifications of the pico-hydropower portable turbine components, including a 24-light-emitting diode, 10 W lamp and a JGA25-370 direct current geared generator motor (12 V, 620 revolutions per minute).


Figure 3 shows the stages of testing in the laboratory. The first step is to set the angle of the test plan, turn on the pump, and set the pump discharge plan; the second step is to measure the flow rate with a current meter; and the third step is to measure the revolutions per minute of the turbine rotation and the voltage; and the fourth step is to test the lights on. The instruments used in this study included a revolutions per minute meter, a current meter, and a multimeter. Figure 4, Figure 5, Figure 6, show the experimental workflow for the laboratory and field investigations.
3. Results and Discussion
The classification of power plants in several countries around the world, including Indonesia, is based on the generated power for the pico-hydropower category with a generated power of $<$0.005 MW or $<$5 KW. This classification shows that the potential in Indonesia is very large and easy to find both in small rivers and primary, secondary, and tertiary irrigation canals. Potency is also easy to find in supplementation, pool, or pond outlets; it can even be found in drainage systems and rain gutters that can be used in rainwater harvesting systems for six months of the rainy season.
No | Classification | Netherlands | Italy | Norway | Egypt | Brazil | Turkey | India | Indonesia | Malaysia |
|---|---|---|---|---|---|---|---|---|---|---|
1 | Large | $>$10 MW | $>$10 | - | $>$100 | $>$30 | $>$600 | $>$25 | $>$10 | $>$100 |
2 | Medium | - | - | - | 10–100 | - | - | - | 10–100 | |
3 | Small | $<$10 MW | 10 | 1–10 | $<$10 | 1–30 | $<$600 | 2.01–25 | 1–10 | |
4 | Mini | - | $<$1 | - | 0.1–1 | - | - | 0.101–2 | 1–10 | 0.10–1 |
5 | Micro-hydropower | $>$0.01 | $<$0.1 | - | 0.005–0.1 | $<$1 | - | 0.10 | $<$1 | 0.005–0.1 |
6 | Pico-hydropower | - | $<$0.005 | - | $<$ 0.005 | - | - | $<$0.10 | $<$0.005 | $<$0.005 |
The classification of hydropower capacities across various countries is presented in Table 2 [5], [11], [12], [13], [14], [15], [16], [17], [18]. The pico-hydropower category involves a relatively low capacity range; however, it is highly suitable for harnessing the low-flow water resources frequently found in Indonesia. These hydrological conditions offer significant potential for the development of pico-hydropower portable turbines, particularly in small rivers, irrigation canals, pond outlets, wastewater treatment plant discharge points, and drainage channels. From a hydrodynamic perspective, variations in flow rate and hydraulic head influence the kinetic energy of the flow acting on the turbine blades, thereby affecting the rotational speed (revolutions per minute) and the voltage generated. Consequently, evaluating the relationship between hydraulic parameters, revolutions per minute, and voltage is essential for a quantitative assessment of system performance, while more in-depth hydrodynamic analysis—such as computational fluid dynamics simulation—is recommended for future research. Table 3 shows the results of the identification of the first phase of the research.
Stages | Stages of Activity | Result |
First stage | Macro-spatial Google Earth Version 9.190.0.0 |  |
Mezo-spatial unmanned aerial vehicle Phantom 4 - DJI | 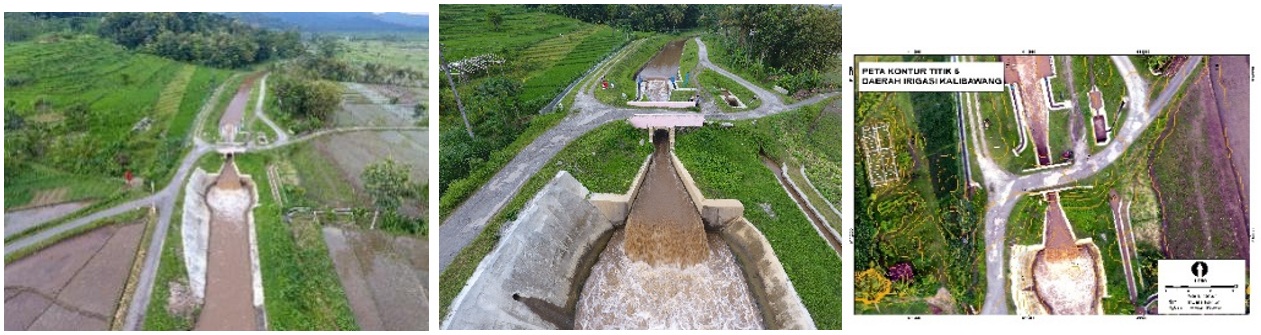 | |
Micro-spatial total station Topcon DS | The results of this stage are detailed contours with contour intervals of 0.5 m – 0.1 m. Contour image data is used for detailed design planning and determination of design analysis with precision measurements. | |
Potential point | The results of direct testing carried out in the field in Figure 6 |
The test was repeated ten times for each application of discharge variations ($Q$ = 11, 18, 21, 23, and 25 L/s) and turbine blade angle (0°, 25°, and 50°) (Figure 7). In testing, the number of 21 blades at an angle of 0° produced an average voltage value of 2.72 V and did not experience a significant increase in voltage as the discharge increased from 11.448 to 25.026 L/s. In the turbine test, the number of blades was 21, with an angle of 25°, indicating a trend of increasing voltage. A comparison of the voltage results on the 0°, 25°, and 50° tests showed that the slope affected the generated voltage.
The voltage ratio at an angle of 25° was higher than at an angle of 0° and 50°. The pico-hydropower portable turbine can operate and turn on light-emitting diode lights with the smallest discharge of 11 L capable of producing 2.7 V, while a maximum discharge of 23 L produced a maximum of 2.98 V. The 25° angle was the highest angle that produced a voltage (Figure 7).
The laboratory test results are presented in Table 4, with variations in blade angle and flow rate demonstrating different effects on turbine speed (revolutions per minute) and generator output voltage. At a blade angle of 0°, increasing the flow rate from 11.448 L/s to 25.026 L/s resulted in turbine speeds ranging from 327.1 to 478.6 revolutions per minute, while the output voltage remained relatively stable between 2.67 and 2.75 V. This indicates that the increase in flow rate was not fully matched by a corresponding rise in voltage, suggesting that a portion of the flow energy was not optimally converted into electrical energy. Conversely, at a blade angle of 25°—despite lower turbine speeds ranging from 129.8 to 208.3 revolutions per minute—the generated voltage actually increased, peaking at 2.98 V at a flow rate of 23.904 L/s; this represented the highest voltage recorded during the tests. This suggests that the 25° setting provides a more effective angle of attack relative to the water flow, thereby facilitating more efficient energy transfer from the flow to the blades and subsequently to the generator. Meanwhile, at a blade angle of 50°, turbine speeds ranged from 192.7 to 281.6 revolutions per minute, with voltages between 2.69 and 2.78 V. Although this angle still produced relatively high speeds, the voltage increase was not as significant as that observed at 25°, indicating energy losses caused by changes in flow direction, local turbulence, and reduced efficiency in fluid momentum transfer to the blade surface. Overall, the test results demonstrate that turbine performance is influenced not only by the flow rate but also by the hydrodynamic interactions between flow velocity, blade angle, and the characteristics of the flow striking the turbine surface. Therefore, the relationship between revolutions per minute and voltage needs to be analyzed quantitatively using linear regression and the coefficient of determination ($R^2$) to assess the strength of the correlation between the two variables, while computational fluid dynamics simulations could be employed in future research to more comprehensively validate the flow distribution, turbulence patterns, and energy transfer mechanisms occurring within the turbine.
$\boldsymbol{Q}$ (L/s) | $\boldsymbol{V}$ (m/s) | $\boldsymbol{b}$ (m) | $\boldsymbol{h}$ (m) | $\boldsymbol{A}$ (m$^2$) | $\boldsymbol{Q}$ (m$^3$/s) | Revolutions per Minute | Voltage (V) | |
|---|---|---|---|---|---|---|---|---|
Turbine Angle (0°) | ||||||||
Q11 | 11.448 | 0.53 | 0.072 | 0.3 | 0.0216 | 0.011448 | 365.1 | 2.73 |
Q18 | 18.45 | 0.75 | 0.082 | 0.3 | 0.0246 | 0.01845 | 478.6 | 2.67 |
Q21 | 21.87 | 0.81 | 0.09 | 0.3 | 0.027 | 0.02187 | 424.7 | 2.69 |
Q23 | 23.37 | 0.82 | 0.095 | 0.3 | 0.0285 | 0.02337 | 327.1 | 2.73 |
Q25 | 25.026 | 0.86 | 0.097 | 0.3 | 0.0291 | 0.025026 | 417.4 | 2.75 |
Turbine angle (25°) | ||||||||
Q11 | 11.13 | 0.53 | 0.07 | 0.3 | 0.021 | 0.01113 | 129.8 | 2.77 |
Q18 | 18.27 | 0.7 | 0.087 | 0.3 | 0.0261 | 0.01827 | 198.6 | 2.84 |
Q21 | 21.093 | 0.79 | 0.089 | 0.3 | 0.0267 | 0.021093 | 192.7 | 2.95 |
Q23 | 23.904 | 0.83 | 0.096 | 0.3 | 0.0288 | 0.023904 | 162.4 | 2.98 |
Q25 | 25.136 | 0.88 | 0.099 | 0.3 | 0.0297 | 0.026136 | 208.3 | 2.95 |
Turbine angle (50°) | ||||||||
Q11 | 11.375 | 0.5 | 0.0625 | 0.3 | 0.01875 | 0.009375 | 200 | 2.77 |
Q18 | 17.9725 | 0.73 | 0.0775 | 0.3 | 0.02325 | 0.0169725 | 263.1 | 2.69 |
Q21 | 21.093 | 0.79 | 0.089 | 0.3 | 0.0267 | 0.021093 | 192.7 | 2.76 |
Q23 | 22.7875 | 0.83 | 0.0875 | 0.3 | 0.02625 | 0.0217875 | 281.6 | 2.73 |
Q25 | 22,5875 | 0.85 | 0.0925 | 0.3 | 0.02775 | 0.0235875 | 221.1 | 2.78 |
Table 5 shows the field test results of the pico-hydropower portable turbine. Laboratory and field test results show a relatively consistent trend, where increases in flow rate and water head tend to be accompanied by increases in turbine rotational speed (revolutions per minute) and generator output voltage. In laboratory tests with a minimum flow rate of 11 L/s, a voltage of 2.77 V was obtained, whereas field tests with a minimum flow rate of approximately 16 L/s yielded 2.60 V. This discrepancy is acceptable, given the influence of more complex field conditions—such as flow rate fluctuations, variations in flow velocity, turbulence, and measurement precision. Measurements were repeated and averaged to minimize random error, while measurement uncertainty stemmed primarily from readings of flow rate, water head, and turbine speed. Furthermore, under low-head conditions ($\Delta H$ $<$ 0.3 m), energy conversion efficiency tended to decline because the available potential energy of the water was lower, thereby limiting the torque generated by the turbine. Nevertheless, the test results demonstrate that the pico-hydropower portable turbine is capable of generating sufficiently stable voltage to power a low-wattage light-emitting diode load, thereby confirming consistency between laboratory and field test results.
No. | Location | Code | Coordinate | L (m) | B (m) | Head ∆H (m) | Velocity V (m/s) | Q (m$^3$/s) | Voltage | Revolutions per Minute |
|---|---|---|---|---|---|---|---|---|---|---|
1 | Bedingin | ST | -7.732574, 110.321999 | 0.785 | 0.85 | 1 | 0.296 | 0.1975 | 2.8 | 661.8 |
2 | Sariharjo | T | -7.727049 110.377522 | 1.83 | 0.30 | 0.28 | 0.410 | 0.2251 | 2.6 | 269.6 |
3 | Sariharjo | T | -7.72064, 110.377934 | 1.2 | 0.2 | 0.34 | 0.636 | 0.1526 | 2.7 | 274.7 |
4 | Sardonoharjo | R | -7.720971, 110.390582 | 0.53 | 0.2 | 0.33 | 0.348 | 0.0360 | 2.3 | 231.6 |
5 | Turi | R | -7.657686, 110.388687 | 0.83 | 0.19 | 0.3 | 0.104 | 0.0164 | 2.51 | 226 |
6 | Turi | ST | -7.653602, 110.380614 | 0.5 | 0.3 | 2 | 0.642 | 0.0963 | 2.9 | 649.5 |
7 | Wonokerto | T | -7.647763, 110.376671 | 0.61 | 0.1 | 0.5 | 0.61 | 0.03721 | 2.7 | 348.9 |
8 | Donokerto | T | -7.648172, 110.37674 | 0.78 | 0.3 | 0.32 | 0.15 | 0.0351 | 2.7 | 339.8 |
9 | Donokerto | ST | -7.645653, 110.384728 | 0.64 | 0.18 | 0.38 | 0.33 | 0.0380 | 2.9 | 686.3 |
10 | Donokerto | ST | -7.647828, 110.389679 | 0.9 | 0.18 | 1.5 | 0.328 | 0.0531 | 2.8 | 847.3 |
11 | Bener, Tegal rejo, Kota | T | -7.775497, 110.35147 | 0.52 | 0.16 | 0.56 | 0.63 | 0.0524 | 2.63 | 751.8 |
12 | Bener, Tegal rejo, Kota | T | -7.775533, 110.351393 | 0.68 | 0.27 | 0.25 | 0.468 | 0.0859 | 2.6 | 701.6 |
13 | Manukan, Concat | T | -7.7391, 110.399164 | 1 | 0.18 | 0.85 | 0.342 | 0.06156 | 2.7 | 612.0 |
14 | Sinduharjo, Ngaglik | T | -7.72645, 110.410349 | 0.7 | 0.18 | 0.30 | 0.488 | 0.06149 | 2.7 | 716.7 |
15 | Wedomartani, Ngemplak | T | -7.727588, 110.42945 | 0.4 | 0.1 | 0.4 | 0.4 | 0.0160 | 2.6 | 263.2 |
16 | Krodan, Maguwoharjo | ST | -7.753332, 110.423302 | 0.6 | 0.1 | 0.5 | 1.792 | 0.107 | 2.8 | 852.1 |
17 | Jetis, Wedomartani | T | -7.749025, 110.414598 | 0.48 | 0.16 | 0.28 | 0.564 | 0.0433 | 2.63 | 700.1 |
18 | Sinduadi, Mlati | ST | -7.76377, 110.364718 | 0.43 | 0.10 | 0.3 | 1.86 | 0.07998 | 2.93 | 1229 |
19 | Tempel, Lumbungrejo | ST | -7.650536, 110.329386 | 0.63 | 0.1 | 0.1 | 1.772 | 0.1116 | 3.02 | 1348 |
20 | Merdikorejo, Tempel | T | -7.645272, 110.333097 | 0.47 | 0.2 | 0.28 | 0.728 | 0.0684 | 2.7 | 744.8 |
21 | Merdikorejo, Tempel | ST | -7.644767, 110.336191 | 0.8 | 0.1 | 0.55 | 1.188 | 0.095 | 3.1 | 1543 |
22 | Bangunkerto, Turi | ST | -7.652174, 110.354935 | 0.6 | 0.1 | 0.18 | 1.15 | 0.069 | 2.95 | 1152 |
23 | Bangunkerto, Turi | ST | -7.651998, 110.361205 | 0.75 | 0.1 | 0.3 | 0.62 | 0.0465 | 2.9 | 1209 |
24 | Wonokerto, Turi | ST | -7.65068, 110.370045 | 1.35 | 0.12 | 1.75 | 0.426 | 0.0690 | 3 | 1077.6 |
25 | Wonokerto, Turi | T | -7.651009, 110.369711 | 0.56 | 0.10 | 0.43 | 0.67 | 0.0375 | 2.7 | 839.8 |
26 | Wonokerto, Turi | ST | -7.652702, 110.370146 | 0.43 | 0.1 | 0.32 | 0.754 | 0.0324 | 2.9 | 1177.6 |
27 | Donokerto, Turi | T | -7.647807, 110.378055 | 0.58 | 0.15 | 0.35 | 0.64 | 0.0557 | 2.7 | 571.6 |
28 | Donokerto, Turi | T | -7.647605, 110.378222 | 0.85 | 0.15 | 0.3 | 0.606 | 0.0773 | 2.7 | 727 |
29 | Purwobinangun, Pakem | T | -7.63203, 110.40022 | 0.95 | 0.15 | 0.3 | 0.694 | 0.09889 | 2.7 | 588.7 |
30 | Purwobinangun, Pakem | T | -7.630415, 110.39691 | 0.62 | 0.32 | 0.3 | 0.4 | 0.07936 | 2.7 | 539.2 |
Figure 8 shows how to identify micro- and pico-hydropower potential with the macro-spatial, mezzo-spatial, micro-spatial, and potential point stages. The macro-spatial stage is the stage where the potential of micro-hydropower and pico-hydropower can be found out through Google Earth imagery by identifying images of waterfalls and by knowing the difference in elevation at this stage, thereby finding out the address of the potential location and access to the location by providing a contour accuracy of approximately 5–10 m at relatively low cost. The first stage generates the location and purpose of identification. The second mezzo-spatial stage is the stage of continuing the first stage selected for identification by using the unmanned aerial vehicle to produce aerial photos and rough contours with an accuracy contour of 1 m. In heavy currents and steep elevations, surveyor safety can be calculated by using the unmanned aerial vehicle as an identification of the mezzo stage with the medium cost category. The third micro-spatial stage aims to determine the potential difference in height or head very accurately through the total station tool, which is more accurate than the unmanned aerial vehicle, with an accuracy contour 0.01 m. The results at the micro-spatial stage are used for planning design drawings and detailed engineering designs for bending infrastructure, sluice gates, sediment ponds, spillways, conveyance channels, calm ponds, penstock, powerhouses, and tailraces. The costs used in the micro-spatial stage with the total station category are high cost. Identification of potential pico-hydropower costs is cheaper, i.e., very economical from macro-spatial directly to potential points. After getting pictures from Google Earth of the waterfall location, the potential point measurement stage is carried out, the pico-hydropower portable turbine 1.1 tool is directly applied in the field, and the lights can turn on for street lighting. It is important to know this stage as an option according to needs in identifying the classification of the potential and power produced. Therefore, with the right tools, the right needs, the right time, the right quality, and the right cost, it is more efficient and effective.
Figure 8 illustrates the identification process for pico- and micro-hydropower potential, integrating spatial, hydrological, and topographical data with field surveys. The primary parameters used at this stage are hydraulic head ($\Delta H$) and flow rate ($Q$), as these determine the available hydraulic energy potential [19]. Values for $\Delta H$ are obtained through measurements using a total station and unmanned aerial vehicle, while the flow rate ($Q$) is calculated based on flow velocity and the channel's cross-sectional area. A site is deemed viable if it meets the minimum head and flow rate requirements for the operating capacity of the pico-hydropower portable turbine; sites failing to meet these criteria are eliminated during the initial identification phase.
Table 5 shows the results of field testing at 30 location points, with 16 L/s producing 2.6 V at P15. While testing in the laboratory, 11 L/s produced 2.77 V. This shows that the results of testing in the laboratory and the field have almost the same value, and can turn on 4 light-emitting diodes $\times$ 10 W = 40 W. In the maximum conditions of laboratory testing with a discharge of 25 L/s, producing 2.95 V can turn on 10 light-emitting diodes $\times$ 10 W = 100 W.
Figure 9 shows that the higher the revolutions per minute, the greater the voltage generated. At P21, with the largest flow velocity of 1.188 m/s, the highest value was 1543 revolutions per minute with the highest voltage of 3.1 V. There is a relationship between flow rate and revolutions per minute, and the amount of voltage generated.
Based on Figure 10, the identification results indicate that the research area has sufficient potential for the application of pico- and micro-hydro power plants as an energy source for household micro-enterprises, particularly the production of ice crystal. The location distribution map in Figure 10a shows that the potential user houses are located around the river network, allowing for the effective distribution of electrical energy from the constructed generating system. The utilization of this energy is then applied to the ice crystal making machine as shown in Figure 10b, which is able to support the production process sustainably by reducing dependence on conventional electricity supplies. The production results in the form of ice crystal shown in Figure 10c indicate that pico- and micro-hydro energy are not only technically feasible for operating business equipment, but also have significant economic potential in increasing productivity, reducing operational costs, and strengthening the development of renewable energy-based micro-enterprises in rural areas. The implementation of this system also serves as a model for the sustainable use of local water resources to support energy independence and improve community welfare.
4. Conclusions
A pico-hydropower portable turbine is a portable turbine needed to meet the electricity needs based on environmentally friendly energy in island and rural conditions. The pico-hydropower portable turbine can also be applied to rural, suburban, and urban areas. Its potential is great because, apart from small canals, pico-hydropower portable turbines can also be operated on irrigation canals, small rivers, supply, tertiary irrigation of paddy fields, river supply, wastewater treatment plant outlets, fish pond outlets, rain gutters, and seasonal drainage. On a laboratory scale with a head of 1 m, the results show that pico-hydropower portable turbines can be operated with a minimum discharge of 11 L/s and are capable of producing 2.77 V and turning on 50 W. At a maximum discharge of 25 L/s, it can increase the voltage to 2.95 V and turn on 100 W. This result is sufficient and can be used for street lighting. The test was continued on a field testing scale, and the results were obtained by testing 30 points in the field. Pico-hydropower portable turbines can turn on a 50-W light-emitting diode lamp with a minimum discharge in the field (16 L/s), resulting in 2.6 V. Field testing can produce 2.7 V at a head of 0.3 m with a discharge of 79 L/s, 2.8 V at a head of 1 m with a discharge of 197 L/s, 2.9 V at a head of 2 m with a discharge of 96 L/s, and 3.1 V at a head of 1.75 m with a discharge of 69 L/s. This shows that the higher the head and the greater the discharge, the more the pico-hydropower portable turbine voltage can increase.
The experimental results indicate that the electrical power generated by the pico-hydropower portable turbine is sufficient to supply low-power loads, such as light-emitting diode street lighting, battery charging, and other small-scale micro-enterprise applications, demonstrating a reasonable balance between the generated energy and the expected electricity demand. The system also offers practical advantages through its simple design, ease of operation, and routine maintenance requirements, making it suitable for rural and remote areas. In addition, the minimal civil infrastructure required is expected to reduce the initial investment compared with conventional micro-hydropower systems. However, a comprehensive economic evaluation, including cost per kW, life-cycle cost, operational reliability, and long-term financial feasibility, should be conducted in future studies to further validate its practical implementation. The next research collaboration plan is being developed for the laboratory-scale pico-hydropower portable turbine and a new version of field research pico-hydropower portable turbine V1.2. In addition to street lighting, it is also used for battery chargers and mobile phone chargers. This is important to meet the demand for pico-hydropower-based electricity in rural areas, islands, remote areas, and underdeveloped, farthest, and outermost areas in Indonesia. The potential of pico-hydropower combined with existing micro-hydropower can be used for community-based ice crystal production.
Conceptualization, M.A., A.M., A.F., E.H.M., F.Z., and A.A.; methodology, M.A., A.M., A.F., E.H.M., F.Z., and A.A.; software, M.A. and A.M.; validation, M.A., A.M., A.F., E.H.M., F.Z., and A.A.; formal analysis, M.A., A.M., A.F., E.H.M., F.Z., and A.A.; resources, M.A. and A.M.; data curation, M.A. and A.M.; writing—original draft preparation, M.A. and A.M.; writing—review and editing, M.A., A.M., A.F., E.H.M., F.Z., and A.A.; visualization, M.A., A.M., A.F., E.H.M., F.Z., and A.A.; supervision, M.A., A.M., A.F., E.H.M., F.Z., and A.A.; project administration, M.A. and A.M.; picohydro analysis, M.A.; microhidro analysis, M.A.; rain water harvesting system, A.M.; solar panel system, A.F.; solar panel roof top, A.F.; economic analysis, F.Z.; digital marketing and community empowerment, F.Z.; community empowerment, A.A. All authors have read and agreed to the published version of the manuscript.
The data used to support the findings of this study are available from the corresponding author upon request.
The authors would like to acknowledge the Laboratory of Hydraulics, Department of Civil and Environmental Engineering, Faculty of Engineering, Vocational College Universitas Gadjah Mada (UGM), post-doctoral UGM 2025, and The National Research and Innovation Agency (BRIN), and thank the team Research Center for Energy Conversion and Conservation (KKE).
The authors declare that they have no conflicts of interest.
Symbol | Description | Unit |
$\Delta H$ | Hydraulic head | m |
$Q$ | Flow rate | m$^3$/s |
$V$ | Flow velocity | m/s |
$A$ | Flow cross-sectional area | m$^2$ |
$P$ | Hydraulic power | W |
$\eta$ | System efficiency | % |
$\rho$ | Water density | kg/m$^3$ |





 Views: 508
 Crossref: 0