
Acadlore takes over the publication of JCGIRM from 2022 Vol. 9, No. 2. The preceding volumes were published under a CC BY license by the previous owner, and displayed here as agreed between Acadlore and the owner.
Impact on Inclusive Development of Information and Communication Technologies in Turkey
Abstract:
In this study, the impact on inclusive development of information and communication technologies in Turkey's economy is analyzed. Information and communication technologies are represented by mobile phone penetration measured by mobile cellular subscriptions, and inclusive development is measured by the human development index (IHDI) adapted to inequality. The annual data used in this study covers the period 1990-2019. After examining the stationarity of the series of variables, the cointegration between variables was investigated using the ARDL approach. As a result of the ARDL test, a cointegration between inclusive development and information and communication technologies has been determined. Toda-Yamamoto causality test was conducted to find the direction of the relationship between variables. The findings obtained from the analysis of causality determined that it has an impact on inclusive development of information and communication technologies in Turkey.
1. Introduction
Inclusive development promotes gender development in terms of poverty reduction, enhancement of human capital (education, healthcare), health, welfare and participation in social development for women, and social development to reduce the risks and vulnerabilities associated with age, disease, disability, natural disasters, economic crises and civil conflicts has emerged as a strategy for equity and empowerment based on participatory decision-making that provides protection and community-based social capital development (Rauniyar & Kanbur, 2010).
Information and communication technologies are pervasive and are used in the global economy to increase productivity, growth, innovation, efficiency, and competitiveness. E-commerce plays an effective role in improving human life through e-governance, e-health, e-education, electricity distribution over smart grids, shortening production needs and travel time (Ngwenyama et al., 2006); (ITU, 2015). 34% of the population in developing countries has access to the internet, whereas this rate is 80% in developed countries. The gap between ICT trends in developed and developing countries is decreasing. This indicates the rising trend of adoption and popularization of ICT in developing economies.
Despite the introduction of ICT and the implementation of new strategies to improve the socio-economic conditions of the masses, poverty is leading to specific development and unsustainability in many developing regions such as South Asia and Sub-Saharan Africa. Globally, people live on less than $ 1.90 a day, and many adults are still illiterate. The majority of the impoverished population lives in developing countries such as Nigeria, Congo, Tanzania, Ethiopia, Madagascar, India, China, Indonesia, Bangladesh, and Pakistan.
The correlation between ICT and economic growth in developing countries is positive. It is noticed that there is an incessant rise in the infrastructure of information and communication technologies (Das et al., 2016). ICT has direct, indirect, and reflection effects on the environment. Direct effects are related to e-waste and products of information and communication technologies and are generally adverse. Indirect effects are a favourable situation, which is associated with increased productivity, induction of smart grids, dematerialization, substitutes for travel, and sustainable development. Reflection effect refers to the process from dematerialization to re-materialization depending on the increase in demand and transportation cost of ICT (Plepys, 2002).
Information and communication technologies (ICT), energy consumption, climate change, and rising trends in sustainable development are becoming important areas of interest. Within this context, it is crucial to investigate the impact of information and communication technologies on the inclusive development of Turkey's economy. Investigation of an innovation, which may arise by testing the role of ICT on the energy-economic growth relationship through data of Turkey's economy, forms the primary aim of the study. In our study, firstly, the relevant literature was reviewed. After the data and method are presented, the results of the conducted analyses are discussed. In the conclusion section, policy recommendations appropriate to the subject of the study are listed.
2. Literature Review
A strong debate continues among economists on the issues of energy consumption, environmental degradation, the relation of causality between information and communication technologies, and inclusive development. The literature review demonstrates that the relevant variables have not been discussed in a single study.
Moyer & Hughes (2012) investigated the dynamic effects of information and communication technologies on interactive global systems, including the carbon emissions caused by economies and energy systems. They used data from 183 countries to conduct empirical analysis through an assessment system integrated with International Financial Systems (IFS). In the study, three separate relationships of information and communication technologies with efficiency, energy efficiency, and renewable energy production have been investigated. It has been concluded that information and communication technologies have an impact on reducing CO2 emissions, yet this impact is limited and not significant in the short run.
Zhang & Liu (2014) investigated the impact of information and communication technologies on CO2 emissions using the panel data set of 29 provinces in China for the period between 2000 to 2010. CO2 emissions are calculated based on the IPAT framework, which was developed by the Intergovernmental Panel on Climate Change (IPCC) (2014). The IPAT model was used for empirical estimates. The results indicate that information and communication technologies helped in reducing CO2 emissions in China. It has been revealed that the impact of information and communication technologies on CO2 emissions is stronger in the central region compared to the eastern region.
Higón et al. (2017) examined the nonlinear relationship between ICT and CO2 emissions globally. Unbalanced panel data of 142 countries were used for the period between 1995 and 2010. The results revealed the existence of an inverted U-shaped relationship between ICT and CO2 emissions. It has been suggested that ICT could be used as a tool in reducing CO2 emissions when infrastructure reaches a certain threshold level of development in both developed and developing countries.
There is also limited literature on the relationship between ICT, environmental sustainability, energy consumption, economic growth, and inclusive development. Ngwenyama et al. (2006) analyzed the relationship between increased investment in ICT, education, health, and human development index in five West African countries. A stepwise regression analysis was performed on the data from 1997 to 2003. The results have demonstrated that ICT is crucial in investing in education and health, as it increases the pace of development. Tamazian & Rao (2010) investigated the association between economic development, financial development, institutional quality, and environmental quality using the standard reduced-form modeling approach in 24 countries for the period between 1993 and 2004. Heterogeneity was determined using the random effects specification, and the potential endogeneity of variables was controlled via the generalized method of moments (GMM). The findings suggest that financial liberalization must go hand in hand with good institutional quality to avoid the detrimental effects on environmental quality.
Sassi & Goaied (2013) investigated the impact of ICT and financial development on economic growth using cross-sectional data of 17 MENA countries spanning the period between 1960 and 2009. For the estimation of the dynamic panel model, the system GMM was conducted. Internet, mobile phone, telephone, information, and communication technologies import have been used as representative variables for ICT diffusion. The results state that financial development would only benefit the MENA countries if the development of ICT reaches the threshold level calculated by marginal effects, which is defined as the change in economic growth due to the change in the spread of ICT.
Wang (2015) investigated the effects of ICT on productivity growth using an unbalanced panel data set for 17 OECD countries. In the study, ICT capital stock is divided into three categories namely, communication equipment, information and technology equipment related to telecommunications demand, and personal computer penetration rate. The empirical model is based on the expansion of the foundations suggested by Roller & Waverman (2001). The results show that these three categories have a positive and significant impact on productivity growth. The study concluded that productivity growth could be increased if resources are channeled to increase the ICT capital stock. The widespread use of ICT could also account for the labor productivity gap between developed and developing countries by increasing labor productivity in OECD countries.
Asongu & Nwachukwu (2016) investigated the impact of governance on mobile phone penetration for inclusive development based on a data set of 49 countries in sub-Saharan Africa from 2000 and 2012 via fixed effects, GMM, and Tobit regression estimations. It has been determined that the prevalence of mobile phones has a positive correlation with inclusive development. It has been found that economic and corporate governance has a significant impact on inclusive development and its impact is higher in the case of economic governance compared to corporate governance. The impact of political governance on inclusive development is insignificant. In the case of fixed-effect regression, there is no synergy effect between governance, mobile phones, and inclusive development. But, it was determined to be significant in the case of the GMM and Tobit regression estimations.
Das et al. (2016) investigated the joint impacts of ICT and financial development on per capita income growth between 2000 and 2014 in 46 developing countries. Three hypotheses are analyzed using the GMM in the estimation of behavioral equations. The results have verified the first hypothesis that ICT affects economic growth in all developing countries positively. But, financial development has not affected economic growth itself. It has been revealed that the joint impacts of ICT and financial development on economic growth vary at different income levels. Moreover, the results show that the joint impact of ICT and financial development is significant in a positive direction for low-income countries, whereas it is insignificant for low-middle-income countries.
Salahuddin & Gow (2016) predicted the impacts of internet usage, financial development, and trade openness on economic growth in South Africa for the period spanning 1991 to 2013. ARDL cointegration test was used to determine the long-run correlation between variables. The long-run correlation between variables was determined to be positive and significant. But, the short-run correlation was found to be insignificant. The findings suggest that the government should pursue investment policies that will expand education and skills not only in internet infrastructure but also in internet use on the demand side.
Alderete (2017) analyzed the role of ICT on socioeconomic development using the structural equation model based on data from 163 developed and developing countries for 2013. The model centered on the causal relationship between access to ICT and socio-economic development. The results show that building more skills and abilities in the use of ICT will increase digital access and productivity levels that will be used to develop new business opportunities.
Asongu et al., (2017a, b) investigated the impact of ICT on the inclusive development of sub- Saharan Africa through CO2 emissions. It has been suggested that ICT can be determined as a policy variable to reduce CO2 emissions, increase human development and achieve a sustainable environment. Based on the data set from 2000 to 2012, Asongu & Le Roux (2017) investigated whether the development in ICT improves inclusive human development using a sample of 49 countries from the sub-Saharan African region. To perform an experimental analysis via instrumental
variable Tobit regression, limited dependent variable (HDI) range and concurrency problem were discussed. The unobserved heterogeneity was calculated by splitting the data set into key characteristics of human development. The results have demonstrated that to enhance the level of inclusive development, policies need to be designed to increase investment in ICT penetration.
Mbarek & Zghidi (2017) analyzed the dynamic relationship of ICT with the environment, transport energy, and economic growth in Tunisia. They determined a bi-directional causality between CO2 emissions and transport energy consumption in the short and long run. This study also has revealed that ICT does not make a significant contribution to the reduction of greenhouse gas emissions in Tunisia.
Mirza et al. (2020) investigated the impact of ICT, carbon dioxide emissions, and energy consumption on inclusive development in 81 developing countries for the period between 2010 and 2014. The two-stage system GMM was used to estimate these dynamic relationships between variables in conditional and unconditional models. The results indicate that ICT, which is associated with CO2 emissions per capita, positively affects inclusive development in an unconditional decline. When ICT complements the CO2 concentration, it positively affects the inclusive development in mobile and internet-oriented regressions. It has also been determined that the relationship between ICT and CO2 emissions from liquid and fuel consumption, as well as CO2 emissions from heat and electricity production, reveal the decline in inclusive human development.
Upon reviewing the literature, no study investigating the relationship between ICT and inclusive development particularly in Turkey's economy has been detected. Thus, our study would make a considerable contribution to both domestic and foreign literature. In our study, we tried to determine the innovation that may arise by testing the role of ICT in inclusive development with the data of Turkey's economy.
3. Data
Time series data of Turkey's economy, which spans the period from 1990 to 2019 was used to perform the analysis. Data were collected from World Development Indicators (WDI) and United Nations Development Program (UNDP). The inequality-adjusted human development index (IHDI) was used to measure inclusive development. The IHDI is an expanded human development index that lowers the value of all dimensions of the HDI (long and healthy life, access to knowledge, and a decent standard of living) from the level of inequality. Information and communication technologies were measured by mobile phone subscriptions (per 100 inhabitants).
Three control variables are included in the model, namely, domestic credit, foreign direct investment, and foreign aid. These variables make a significant contribution to inclusive development. Domestic credit and foreign direct investment have a positive impact on human development by providing the financial basis for inclusive development. Generally, it is considered that foreign aid for underdeveloped countries is not an effective tool for economic development and might have an unfavorable impact on inclusive development.
The control variables are selected on the basis of recent literature and rely on strong theoretical foundations to influence inclusive development.
Variable | Description | Symbol | Sources |
IHDI | Inclusive development measured by inequality adjusted human development index (IHDI). | lnıhdı | UNDP (World Bank) |
Mobile penetration | Mobile phones penetration measured by mobile cellular subscriptions (per 100 people) | lnmp | WDI (World Bank) |
Domestic Credit | Domestic credit provided by banks and by financial sector (% of GDP) | lndc | WDI (World Bank) |
Official Development Assistance | Foreign aid measured by net ODA received (% of GNI) | lnoda | WDI (World Bank) |
Foreign Direct Investment | FDI measured by foreign direct investment, net inflows (% of GDP) | lnfdı | WDI (World Bank) |
4. Methodology
A time-series modeling approach has been employed to estimate the correlations between ICT and inclusive development. In this approach, the stationary time series is performed to investigate a relationship between the series of variables. The stationarity test analyzes whether there is a change depending on the time in a time series. A time-dependent change can be investigated by examining the mean and variance of the time series. Unit root test is required for this investigation.
Yt is the value of the time series at time 't' and Xe is an exogenous variable.
Having a value of α=1 in equation (1) signifies that there is a unit root in the time-series. That is to say, the mean and variance are changing in the time-series and the series is not stationary. The previous time-series are subtracted from the later one to correct the change in mean and variance.
The Augmented Dickey-Fuller (ADF) unit root test is one of the most used statistical tests when it comes to analyzing the stationarity of a time-series. The ADF test is a statistical significance test. It is hypothesis testing, which involves a null (H0) and alternative hypothesis (H1). A test statistic is computed and the p-value is reported. It can be inferred from the test statistics and the p-value whether a time series is stationary or not.
H (0): α = 1 (There is a unit root.)
H (1): α ≠ 1 (There is no unit root.)
When the test statistic is less than the critical value in the table, the null hypothesis is rejected and the time series is stationary. So the unit does not contain a root. If the test statistic is greater than the critical value in the table, the null hypothesis (H0) is not rejected. Time series is non-stationary and contains unit root (Dickey & Fuller, 1981).
The ADF test does not take into account the abrupt change of a time series at one or more points in time when analyzing the stationarity in the time-series. Abrupt changes can be determinant in econometric analysis, which is made for developing countries. Such abrupt changes are termed as structural breaks. Structural breaks could involve a change in mean or a change in other parameters of the process that generate the series, and structural break tests are needed to detect it. For this purpose, the Lee-Strazicich unit root test, which can detect two breaks, was used in our study.
According to Lee & Strazicich (2003), who proposed an endogenous double-fractured Lagrange Multiplier (LM) unit root test, which is not affected by structural breaks under the null hypothesis, rejecting the null hypothesis (H0) does not mean rejecting the unit root per se. But, the unit root is rejected without breaking. The alternative hypothesis (H1) does not imply trend stationary with breaks either. Yet it indicates a unit root with breaks. This signifies that the alternative to the null hypothesis (H0) does not need to be non-stationary with structural break.
For the LM unit root test; $y_t=\delta Z_t+e_t e_t=\beta e_{t-1}+\varepsilon_t$ (1) the regression equation is used. 𝑍𝑡 represents the vector of exogenous variables, while 𝜀𝑡 represents residues with the properties of iid N (0, 𝜎2).
To conduct the unit root test with one time-break at level, Modal A is established by replacing 𝑍𝑡 with [1,𝑡,𝐷𝑡]′ in the equation (1), where dummy variable is 1 when, 𝐷𝑡, 𝑡≥𝑇𝐵 𝑖s+1 and it is 0 in other conditions. 𝑇𝐵 is break time.
To conduct unit root test with two-break at level, the Model AA is established by replacing 𝑍𝑡 with [1,𝑡,𝐷𝑡,DTt]′ in the equation, where dummy variable is 1 when 𝐷𝑗t , j = 1, 2 for 𝑡≥𝑇𝐵j +1 and it is 0 in other conditions.
Model C, which allows a one-time-break at the level and slope, is established by replacing 𝑍𝑡 with [1,𝑡,𝐷𝑡,Dt]′ in the equation, where dummy variable is 𝑡−𝑇𝐵 when DTt, 𝑡≥𝑇𝐵 is +1 it is 0 in other conditions.
Model CC, which allows two-time breaks in constant term and trend, is established by replacing 𝑍𝑡 with [1,𝑡,𝐷1𝑡,D2t,DT1t,DT2t]′ in the equation, where the dummy variable is 𝑡−𝑇𝐵j when 𝐷T𝑗t , 𝑡≥𝑇𝐵j is+1, for j = 1, 2 and it is 0 in other conditions.
Data generation is (𝛽=1) under the null hypothesis (H0) with break, and is 𝛽<1 for the alternative hypothesis (H1). The LM unit root test statistic evolves to the form of Δ𝑦𝑡=𝛿′Δ𝑍𝑡+𝜙𝑆̃𝑡−1+𝑢𝑡.
The t statistic, which tests the LM unit root null hypothesis (H0), is calculated by 𝜏̃. Break times are the points where the following 𝜏̃ test statistic is minimum.
$L M_\tau=\inf f_\lambda \tilde{\tau}(\lambda) T$ observations $T_{B j}$ break point for $j=1,2, \lambda_j=T / T_{B j}$
The structural breakpoint of the trimming region is specified as (0.15 * T - 0.85 * T). Critical values for the one-time-break LM unit root test are obtained from Lee & Strazicich (2004), and critical values for the two-breaks LM unit root test are obtained from Lee & Strazicich (2003). If the calculated test statistic is greater than the critical value, the unit root null hypothesis with structural break is not accepted.
In the study, cointegration and causality analysis must be performed, respectively, to investigate the relationship between variables, following unit root analysis. Based on the results obtained from unit root analysis, it was decided to conduct the ARDL test to investigate cointegration. ARDL test is a model used to test the concept of cointegration, which suggests that at least two series that are non-stationary at their level have a stationary combination. It is possible to apply the test on the condition that the dependent variable is I (1) and the independent variables are I (0), regardless of whether the variables to be used in the model are stationary at the level I (0) or the first difference is stationary I (1). As the critical values of the test are tabulated according to the variables being I (0) and I (1), the variables need to be tested against the possibility of being stationary I (2) in the second difference. In the second difference, the ARDL model cannot be applied to stationary variables.
As the unconstrained error correction model is used in the ARDL test, it has better statistical features than the Engle-Granger test and gives more reliable results in small samples compared to the Johansen and Engle-Granger tests. The ARDL model is estimated as follows according to the dependent variable Y and independent variables.
In the implementation of the ARDL test, optimal lags are determined primarily by using the Akaike (AIC), Schwarz (SIC), and Hannan-Quinn (HQ) information criteria. The F-statistic is computed using the optimal lags.
H0:θ1=θ2=0 (There is no cointegration.)
Hα:θ1≠θ2≠0 (There is cointegration.)
F statistics > F table upper bound; H0:θ1=θ2=0 is rejected and it is concluded that there is cointegration.
F statistics < F table lower bound; H0:θ1=θ2=0 is accepted and it is concluded that there is no cointegration.
F table lower bound < F statistics < F table upper limit; unstable region
If the H0 hypothesis is rejected and it is concluded that there is cointegration, the ARDL Long-Run and Short-Run Model interpretations are made, with the following predicted equations (Pesaran & Shin, 1995); (Pesaran et al., 2001).
Long Term Model Estimation
Short Term Error Correction Model
The one-term lagged value of EC (-1) or CointEq (-1) of the residues obtained from the long-run relationship between the dependent variable and the independent variables in the Error Correction Model must be negative and statistically significant on the condition that the probe value is less than 0.05. EC (-1) shows how long shocks that occur in the short-run due to independent variables will stabilize in the long run (Pesaran & Shin, 1995); (Pesaran et al., 2001).
The stationary tests of dependent and independent variables and control variables in the study demonstrated that the most appropriate causality analysis in examining the direction of the relationship between variables was the Toda-Yamamoto causality test.
Toda-Yamamoto (1995) developed a method based on the estimation of the augmented VAR model (k+dmax) using the optimum time lag (k) in the VAR model and the maximum integrated degree dmax on the VAR variables to examine the Granger causality analysis. In this method, firstly a degree of integration is determined for each series. If the degree of integration is different, the maximum (dmax) is obtained.
VAR model is established at the levels of the series independent of the degree of determined integration. The (k) degree of the VAR model is identified based on the length of the lag obtained from the AIC, SC, HQ criteria. It is tested whether "VAR (k + dmax)" is specified correctly. If the series have the same degree of integration, the cointegration test is performed using the Johansen methodology, and if not then it is performed using the approach of Pesaran et al. (2001). Regardless of the result of the cointegration test, the causality test continues. The Granger causality test is conducted using binary equations and the modified Wald test (MWald) to determine the significance of parameters in the equations examined in time lags (k + dmax). The modified Wald test (MWald) follows the Chi-square (χ2) distribution asymptotically and the degrees of freedom are equal to the number of degrees of lag (k + dmax) (Toda & Yamamoto, 1995).
Rejecting the null hypothesis entails the rejection of Granger causality. Finally, one checks whether there is cointegration in the VAR model. If two or more series are cointegrated then there is a unidirectional or bidirectional causality. If there is no cointegrated situation, there is no causality.
5. Empirical Evidence and Estimation of the Model
To predict the relationships between ICT and inclusive development, the stationarity test of the basic and control variables was performed with the Augmented Dickey-Fuller (ADF) test, which is the conventional unit root test, and the Lee-Strazicich (LM) unit root test, which takes structural breaks into account.
The unit root test results of the series of ICT and inclusive development, which are the basic variables of the study, together with domestic credit, foreign aid, and foreign direct investment series, which are control variables, are presented in Table 2.
Variables | ADF |
Results | |
Trend-Intercept Level Value | Trend-Intercept 1st Difference Value | ||
Lnıhdı | -2.695876 (0.2472) | -3.666687 (0.0433) | I (1) |
Lnmp | -7.814665 (0.0000) | - | I (0) |
Lndc | -2.423653 (0.3592) | -4.259448 (0.0116) | I (1) |
Lnoda | -3.589216 (0.0423) | - | I (0) |
Lnfdı | -2.690013 (0.2475) | -6.019852 ( 0.0002) | I (1) |
According to Table 2, the variables lnıhdı, lndc, and lnfdı are stationary, that is to say it is I(1), at the 1st difference value of trend-intercept. The variables lnmp and lnoda are stationary, that is to say it is I(0), at the trend-intercept level. Based on the results of the ADF test, it was concluded that the basic variables of the study, the lnıhdı and lnmp series, were not stationary at the same level.
The findings of the basic and control variables of the LM unit root test investigating two break are shown in Table 3.
| lnıhdı Model AA | lnmp Model AA | lndc Model AA | lnoda Model AA | lnfdı Model AA | lnıhdı Model CC | lnmp Model CC | lndc Model CC | lnoda Model CC | lnfdı Model CC |
Test Statistics | - 4.1936 | -2.8119 | -2.4874 | -3.2614 | -4.3378 | -9.4874 | -13.196 | -8.4278 | -8.5158 | -8.6741 |
Lag Length | 6 | 5 | 4 | 8 | 1 | 5 | 7 | 8 | 6 | 5 |
Date of Breaking | 2009 2012 | 2005 2007 | 2000 2007 | 2010 2016 | 2000 2003 | 2002 2011 | 2002 2006 | 2003 2006 | 2005 2010 | 2000 2004 |
Critical Values (%1) | - 4.0730 | -4.0730 | -4.0730 | -4.0730 | -4.0730 | -7.0040 | -6.7500 | -6.7500 | -6.8210 | -6.7500 |
The test statistic calculated in Model AA of the basic independent variable lnmp in Table 3 is less than 5% critical value. But, the test statistic of lnmp calculated in Model CC is greater than 5%. In this case, the unit root null hypothesis with LM two-break is not rejected. The calculated test statistics of the dependent variable lnıhdı are absolutely greater than the 5% critical value. In this case, it means rejecting the unit root without structural break, as the unit root null hypothesis with structural break cannot be accepted. The lnıhdı series is difference-stationary with breaks. It was revealed as a result of the LM unit root test that the variable lnmp is I(0) and the variable lnıhdı is I(1).
The results of the ADF and LM unit root tests with structural break prevent conventional cointegration tests to investigate the relationship between variables. The conventional cointegration tests suggest that the variables must be stationary at the same level. On the other hand, the ARDL test is applied to the stationary states of the variables in the level and 1st difference, unlike conventional cointegration tests. Furthermore, to be able to apply the ARDL test, the dependent variable must be at their first difference, that is to say at I(1), while the independent variable must be stationary at the level. This requirement is met, particularly based on the basic variables of the study and the ADF test results of the lnoda variable. ADF test results of the other control variables, lnfdı and lndc series, are not suitable for ARDL testing. In the study, as a result of meeting the basic variables in a joint cointegration test, a different cointegration test was not applied for the other two control variables.
To analyze whether there is a cointegration relationship between the series with the ARDL test, an unconstrained error correction model must be established primarily. The unrestricted error correction model for the study is as follows:
$\Delta \ln \iota h d \iota=\beta_0+\sum_{i=1}^m \beta_{1 i} \Delta \ln\iota h d \iota_{t i}+\sum_{i=0}^m \beta_{2 i} \Delta \ln m p_{t i}+\sum_{i=0}^m \beta_{3 i} \Delta \operatorname{lnod} a_{t i}+\beta_5 \ln\iota h d \iota_{t i}+\beta_6 \ln m p_{t i}+\beta_7 \operatorname{lnod} a_{t i}+u_t$
m is the maximum lag length, Δ is the difference operator. The maximum lag length (m) in the study was determined as 3 based on the selection criteria AIC, SC, and HQ information criteria and is reported in Table 4.
Lag | AIC | SC | HQ |
0 | 2.556345 | 2.701510 | 2.598147 |
1 | -3.676885 | -3.096225* | -3.509675 |
2 | -3.242254 | -2.226099 | -2.949638 |
3 | -4.029891* | -2.578241 | -3.611869* |
The cointegration relationship based on the ARDL test for the variables of lnıhdı, lnmp, and lnoda with different stationary levels in the study is presented in Table 5. When Table 5 is examined, one can notice that the computed F statistic is greater than the upper limit critical value of the table. Hence, it has been revealed that there is a cointegration relationship between the dependent variable lnıhdı and the basic and control independent variables lnmp and lnoda.
Number of Independent Variables (k) | F Statistic | %10 Critical Values at Significance Level | |
Lower Limit I(0) | Upper Limit I(1) | ||
2 | 4.238129 | 3.17 | 4.14 |
Given that there was a cointegration relationship between the series, the phase of investigating long- run and short-run relationships was started. The ARDL (3,0,0) model of the lnıhdı variable was estimated with 3 lagged values of lnmp and lnoda variables. The determination of the long-run relationship was conducted within the framework of the model presented below.
$\ln \iota h d \iota_t=\varphi_0+\sum_{i=1}^m \varphi_{1 i} \ln \iota h d \iota_{t-i}+\sum_{i=0}^n \varphi_{2 i} \operatorname{lnm} p_{t-i}+\sum_{i=0}^p \varphi_{3 i} \operatorname{lnod} a_{t-i}+\varepsilon_t$
The results of the estimated model are shown in Table 6.
Variable | Coefficient | Prob. |
D(DLNIHDI(-1)) | 0.270290 | 0.3541 |
D(DLNIHDI(-2)) | 0.420268 | 0.0517 |
C | 0.021813 | 0.1839 |
LNINT(-1) | 0.000517 | 0.8472 |
LNODA(-1) | 0.000695 | 0.8693 |
DLNIHDI(-1) | -1.175410 | 0.0020 |
The long-run coefficients of the estimated ARDL (3,0,0) model are presented in Table 7. The long-run coefficients of the model have expected signs but are not significant.
Variable | Coefficient | Prob. |
LNINT | -0.000172 | 0.9495 |
LNODA | 0.003040 | 0.4236 |
C | 0.025983 | 0.1024 |
Variable | Coefficient | Prob. |
D(DLNIHDI(-1)) | 0.281629 | 0.3270 |
D(DLNIHDI(-2)) | 0.439999 | 0.0403 |
D(LNINT) | -0.000204 | 0.9494 |
D(LNODA) | 0.003601 | 0.4157 |
CointEq(-1) | -1.184369 | 0.0016 |
𝐸CM𝑡−1 The fact that the lagged expected value has a negative sign and is significant, one has to consider how much of any deviation from the balance in the examined period can be compensated in the future. The error correction coefficient in the model was determined to be -1.1844. The sign of this value is negative and the error correction coefficient is significant, as the P-probability value is less than 5%. Thus, 1.1844% of a deviation that would occur in the short run could be corrected in the long run.
Based on the results showing the short-run relationship of the ARDL (3,0,0) model in Table 8, the error correction model can be established as follows:
-1.1844 = dlnıhdı - (-0.0002*lnmp + 0.0030*lnoda + 0.0260)
Besides, while examining the stability of the long-run values of the variables, the short-run values should also be considered. For this purpose, CUSUM and CUSUMQ tests were also used in analyzing the stability of the long-run coefficients, which have been used in the computation of error correction term, based on the short-run values. These tests are shown in Graph 1 and Graph 2.
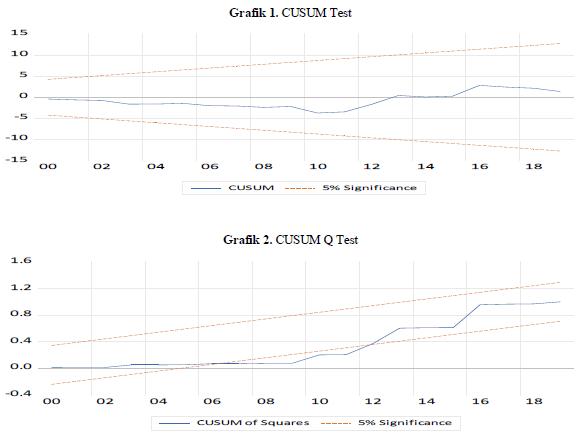
When the graph of the CUSUM test is examined, it is seen that the long-run coefficients used in the formation of the error term of the short-run dynamics of the variables are within the limits indicating the 5% significance level. It is concluded that the long-run coefficients of the variables lnıhdı, lnmp, and lnoda are stable as of the period discussed in the study.
But, in the graph of the CUSUM Q test, it is seen that there is a deviation from stability in the period between the third quarter of 2006 and the third quarter of 2012. This deviation is due to the assessments that can be described as international reflections of the domestic developments in the country. The fact that the effects of the 2007-2012 global financial crisis emerged in this period, such as, the high inflation rates, an unemployment rate that did not fall below 10%, and the current account deficit/GDP ratio that could not be reduced to below 5% and remained unstable, can be considered as signs of deviation from stability.
The variables in the study were stationary at different levels as a result of the stationarity tests and the dependent variable was determined as I (1), thus requiring the Toda-Yamamoto causality analysis. In the Toda-Yamamoto causality test, the standard VAR model was first established by using the level values of the lnıhdı, lnmp, and lnoda data. When establishing the VAR model, the AIC, SB, and HQ information criteria were taken into account in the selection of the lag length. Since the information criteria show 1 lag, the lag length of the standard VAR model is also 1. Table 9 shows the maximum lag length determined, based on the information criteria.
Lag | AIC | SC | HQ |
0 | 8.209989 | 8.449958 | 8.281344 |
1 | -1.157997 | 0.281822* | -0.729863* |
2 | -0.326923 | 2.312745 | 0.457989 |
3 | -1.317828* | 2.521689 | -0.176138 |
After determining the maximum lag length, the standard VAR model is established by using the level values of the series of variables.
$\ln \iota d l_t=\beta_0+\beta_{l n m p} \ln m p+\mu_i$
$\partial \ln m p_t / \ln \square h d \square>0$; ICT affect inclusive development.
$\partial \ln m p_t / \ln \square h d \square<0$; ICT don't affect inclusive development.
and
$\partial \ln \square h d \square_t / \ln m p>0$; inclusive development affects ICT.
$\partial \ln \square h d \square_t / \ln m p<0$; inclusive development don't affects ICT.
In the next step, the degree of integration (dmax) is 1, as lnıhdı i is (1) and lnmp is (0). Hence, the lag length is determined as 2 by adding the degree of integration (dmax) to the standard VAR model. The new VAR model was estimated by the Seemingly Unrelated Regression (SUR) method by changing the lag length. The SUR method was preferred because it takes into consideration the heteroskedasticity (changing variance) in the error terms of the equations for the causality analysis estimated in the model estimation part as well as the correlation between the error terms (autocorrelation).
Dependent variable | MWald Test Statistics | Causality Direction | |
lnıhdı | lnmp | ||
lnıhdı | - | 7.9919 (0.0184) | lnmp → lnıhdı |
lnmp | 0.4432 (0.8012) | - | lnıhdı $\nrightarrow$ lnmp |
Toda-Yamamoto causality analysis results of lnıhdı and lnmp variables are presented in Table 10. The values in Table 10 show the relationship between inclusive development and ICT variables in Turkey. According to the Toda-Yamamoto causality analysis, causality has emerged from the independent variable of ICT to the dependent variable of inclusive development. Based on these results, inclusive development in Turkey is affected by the control variables of ICT, foreign direct investment, foreign aid, and domestic credit.
Our findings are also similar to the studies of Wang (2015), Alderete (2017), and Asongu & Le Roux (2017), which demonstrated that ICT could be used as a significant variable to enhance human development. Our study supports the theory in the literature that inclusive development depends on ICT.
6. Conclusion
The study analyzed the impact of information and communication technologies on the inclusive development of Turkey's economy. Information and communication technologies were represented by mobile phone penetration, which is measured by mobile phone subscriptions. ARDL approach and Toda-Yamamoto causality analysis were used to estimate the relationship between variables.
The ARDL test revealed a relationship between inclusive development and time series representing ICT. Toda-Yamamoto causality test determined the direction of this relationship between variables. Findings show that there is a causality from ICT to inclusive development. This result shows that information and communication technologies in Turkey could play a crucial role in enhancing inclusive development. It is clear that information and communication technologies can play an important role in reducing environmental degradation primarily by controlling dematerialization and reducing transport spending, and the saved resources can be channeled to develop projects such as poverty reduction. Moreover, information and communication technologies help to expand the commercial activities by expanding the market size of a product, increasing business efficiency, and providing online communication services between the consumer and the manufacturer. ICT can help to increase the number of educated and healthy people through e-health and e-school programs in the country. Furthermore, it can improve workers' skills in the meaning of increased labor productivity. It can also be widely used to convey awareness-raising information among people and to make individuals more responsible.
Policies should be developed to promote investment in ICT. The investment should be centered on developing environmentally friendly information and communication technology equipment, increasing access to information and communication technology and use of the technology, and reducing e-waste to decrease environmental degradation. Investments that would improve skills of technology hardware production and technology infrastructure software (databases-operating systems- analytical tools, middleware, etc.) production should also be increased.