Acadlore takes over the publication of JCGIRM from 2022 Vol. 9, No. 2. The preceding volumes were published under a CC BY license by the previous owner, and displayed here as agreed between Acadlore and the owner.
Model of Using the Exhaustive Search Algorithm in Solving of Traveling Salesman Problem (TSP) on the Example of the Transport Network Optimization of Primorje-Gorski Kotar County (PGC)
Abstract:
This paper considers and presents a model of the use of an exhaustive search algorithm in solving problems of a salesman on the example of the transportation network optimization of Primorsko Goranska County. By identifying the suboptimal solutions of transportation network, that enable insight into more transportation routes and can be significantly influenced by the reduction of transportation costs and creating increased opportunities for the carrier in the context of flexible designing the structure of the commodity flows, greater utilization of transport capacity, and thus achieve greater profit. In the analyzed example, transportation network of Primorje-Gorski Kotar County (PGC) is divided into two sets (segment): 1) a set of cities (nodes) that are located (placed) on the same traffic direction (transportation route) that represents the optimal transportation route, and 2) a set of cities (nodes) that connect through a variety of transport relationships and that are included in the calculation by using the exhaustive search algorithm. In the example are also defined nodes that are common to both the two sets and that are connecting by the virtual transportation route in the spreadsheet optimization model.
1. Introduction
Due to the large increases in the number of cities in the world, mobility between cities has become difficult because of there existing many dissimilar roads to reach the same city with different travelling cost (Ameen, Sleit and Al-Sharaeh, 2018.), where there are several places that are all directly connected to each other by different long roads and the passenger wants to make the shortest trip. Some algorithms can be used to guide people using one of the transport or movement methods (walking, train, car, and bus) to reach their destination on the shortest route. (Zhan and Noon, 1996). The paper presents the use of Travelling Salesman Problem (TSP) model and a Exhaustive Search Algorithm on the example of the transport network of Urban agglomeration Rijeka. The flexibility and adaptability of transport networks can be achieved by optimizing the routes of movement of vehicles between one of the sources and multiple destinations in transport network. The most important operational decision related to optimizing transport network of Urban agglomeration Rijeka can be set the analogy according to that the number of calculated suboptimal solution. The basic criterion for selection of optimal transport relation is the distance between cities (trade transport centers). In cases of the same or similar distance, there is a possibility of dynamic selection of multiple transport relations for different periods of time, so, from the perspective of other relevant criteria, there can be one optimal relation for a certain period of time, and another optimal relation for other periods. The majority of existing software solutions allows calculation and insight into one optimal solution. Using visual and object methods in programming and modelling to form an algorithm of detailed search criteria can simulate models with more than one optimal solution for small scale patterns, with clear interpretation of the results, not only those in optimal value, but also those of approximately equal values and their deviation from the optimum. Finding a large number of optimal transport relations allows greater flexibility in making a multiobjective selection of optimal transport relation, especially over different periods of time (Vukmirović and Pupavac, 2013.).
2. Methodology
Methodological frame of use of Visual Basic as a development tool in the visual modelling of Exhaustive Search Algorithm in VBA for Excel can serve as an incentive in creating new highly sophisticated algorithms, which will enable us to compute optimal and suboptimal solutions of transport network (Vukmirović, Čičin-Šain and Host, 2015). In accordance with the problem of research is set the research hypothesis: The use of the exhaustive search algorithm in finding the suboptimal solutions, significantly affects on the transport network optimization, so that allows a reduction in transport and logistics transport cost and time, but also more flexible designing structure of the transport network, the greater utilization of transport capacity, thereby creating added value and achieve greater profits The paper is composed of six parts.
In the first part of this paper Introduction, the features of this work are presented. In the second part Traveling Salesman Problem Determinants there are considered theoretical background and determinants of Traveling Salesman Problem and Exhaustive Search Algorithm in the context of transport network optimization. In the third part The conceptual model of transportation network optimization on the example of Primorje-Gorski Kotar County (PGC), transport network is divided into two sets (segment): 1) a set of cities (nodes) that connect through a variety of transport relationships and that are included in the calculation of suboptimal solutions by using the exhaustive search algorithm and 2) a set of cities (nodes) that are located (placed) on the same traffic direction (transportation route). In the fourth part The method of exhaustive search algorithm in finding suboptimal solutions of transportation network, there are considered and presented the use and meaning of an exhaustive search algorithm, based on visual and object oriented methods of modeling and programming, in finding and visualization of suboptimal solutions on the level of choosing set of nodes (transport network segment). In the fifth part, The importance of the suboptimal solution of the transport problem on the example of PGC, there are considered and analyzed the effects of the suboptimal solutions. In the sixth part Conclusion, the synthesis of the whole work was presented and the most important results of the research were presented.
3. Results
The Travelling Salesman Problem (TSP) is an optimization problem used to find the shortest path to travel through the given number of cities. Travelling salesman problem states that given a number of cities N and the distance between the cities, the traveler has to travel through all the given cities exactly once and return to the same city from where he started and also the length of the path is minimized (Rao, A., Hegde, S. K., 2015).
The Travelling Salesman Problem (TSP) can be formulated as follows: to choose a pathway optimal by the given criterion. In this, optimality criterion is usually the minimal distance between towns or minimal travel expenses. Travelling salesman should visit a certain number of towns and return to the place of departure, so that they visit each town only once (Heizer & Render, 2004). The travelling salesman problem can be classified as Symmetric Travelling Salesman Problem (STSP), and Asymmetric Travelling Salesman Problem (ATSP). In STSP the distance between two cities is same in both the directions. In ATSP the distance between two cities is not same in both directions (Rao, A., Hegde, S. K., 2015).
The Travelling Salesman Problem (TSP) is one of the most studied problems in management science. Optimal approaches to solving Travelling Salesman Problems are based on mathematical programming. But in reality, most TSP problems are not solved optimally. When the problem is so large that an optimal solution is impossible to obtain, or when approximate solutions are good enough, heuristics are applied. Two commonly used heuristics for the Travelling Salesman Problem are the nearest neighbour procedure and the Clark and Wright savings heuristic (Heizer & Render, 2004).
In terms of combinatorial optimization, the Travelling Salesman Problem (TSP) can be formulated in the following way: Given a list of n cities C and distance dij from city i to city j; TSP, is to find the best possible way of visiting all the cities by visiting each city only once finding minimum total travel distance. In analogy to the above definition, the following formulations are valid: 1) Travel distance or distance between cities is symmetric: dij = dji (1) or asymmetric dij # dji (2); 2) Final list of cities is defined as incoming variable by the formula C = (c1 … cn), while distance matrix containing distance between city ci and city cj for each pair i,j is defined by d(ci,cj); 3) Permutations or in other words all permuted relations that can be achieved for a given number of cities are computed as resulting variables. Permutations p(1), …, p(n) in the list 1, …, n are calculated and compared to give the minimum sum (Abdoun, O., Abouchabaka, J., Tajani, C., 2012), (Vukmirović, Pupovac, 2013).
Exhaustive search algorithm, also known as brute force seach, is a very general problem-solving technique. In the Travelling Salesman Problem (TSP), every tour corresponds to a permutation of the cities. In a permutation problem every freasible solution can be specified as a total ordering of an underlying ground set (Fomin, F.V., Kratsch, D., 2010). The Exhaustive Search Algorithm enumerating all possible candidates for the solution (permutations) and checking whether each candidate satisfies the problem's statement. It is considered as approach to apply and is useful for solving small–size instances of a problem.
Table 1 reveals the exponential (factorial) growth of number of possible solutions in relation to the number of nodes in a logistics network. That Table realistically captures the travelling salesman problem complexity.
Number of nodes (cities) | Number of solutions (STSP) | Number of solutions (ATSP) |
3 | 1 | 2 |
4 | 3 | 6 |
5 | 12 | 24 |
6 | 60 | 120 |
7 | 360 | 720 |
8 | 2520 | 5040 |
9 | 20160 | 40320 |
10 | 181440 | 362880 |
15 | 43.589.145.600 | 87.178.290 |
20 | 6,082E+16 | 12,164E+16 |
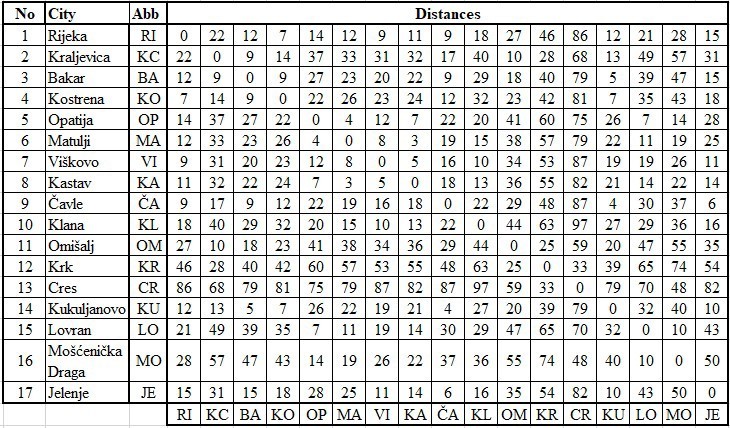
A transportation network allows supplying of logistics centres of towns and cities, and municipalities, their subsystems and all logistics entities in Rijeka Urban Agglomeration. A key factor in designing an efficient transportation network to create an efficient system for goods distribution is the use of relevant information-communication technologies (ICT) and computer applications to determine optimal routing between the nodes (cities, municipalities, distribution centres, ports, terminals) as well as route planning. Table 2 shows distances between 17 cities and municipalities of PGC which had been determined by using Google Maps technology, a web mapping service developed by Google.
The value of optimal transport relation has been calculated by usage of programming language for mathematical modeling Xpress (Figure 1).

The conceptual model of transportation network optimization of Primorje-Gorski Kotar County (PGC), has designed in the function of finding the suboptimal solutions. On the map 1 is a graphical display of the optimal transport route and the conceptual model of the transportation network of PGC. In accordance with this concept transport network is divided into two sets (segment): 1) a set of cities (nodes) that connect through a variety of transport relationships and that are included in the calculation of suboptimal solutions by using the exhaustive search algorithm and 2) a set of cities (nodes) that are located (placed) on the same traffic direction (transportation route).
In the example are also defined nodes that are common to both the two sets (Kastav ad Bakar) and that are connecting by the virtual transportation route in the spreadsheet optimization model. In the table in map 1 are listed the names of cities and the abbbreviations, and in the right part is shown of the value of the optimal solutions and configurations (direction) of the optimal transport route. With the optimal solution, on the map 1. are shown the possible suboptimal solutions og transport network. In the upper part of the map is a graphical selected set of cities (nodes) that connect through a variety of transport relationships and that are included in the calculation of suboptimal solutions. Arrows indicate connections between cities (nodes) in the transport network, where the solid line indicates the optimum transportation route, and dashed line indicate the possible suboptimal transport routes.
In the transport network optimization of PGC, Exhaustive Search Algorithm built in Visual Basic has been used. Object-oriented programming in Visual Basic has been used to build and visualize Exhaustive Search Algorithm to calculate one or multiple optimal transportation routes. Cities included in the calculation of the transportation network belong to the set of nodes S1 that is explained in the previous chapter and shown on map 1.
Table 3 contains travelling salesman problem (TSP) results in the given example. The results have been calculated by program Visual Basic in Excel spreadsheet interface (VBA for Excel), created by the authors of this work. It can be seen from the Table 3, that 40,320 possible transport routes (relations) have been computed with the minimum route length having 65 km.
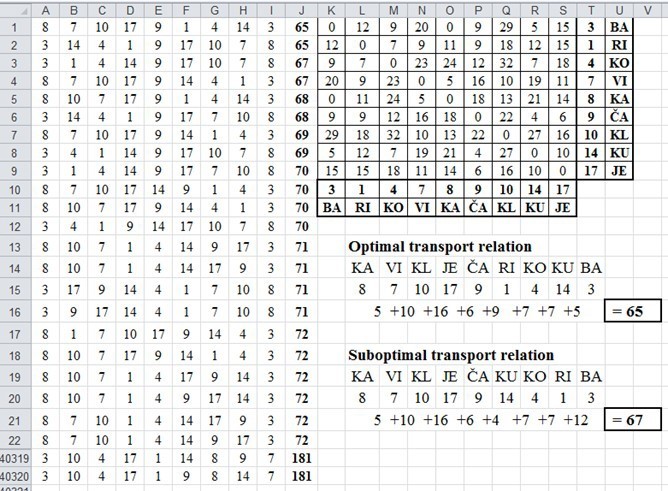
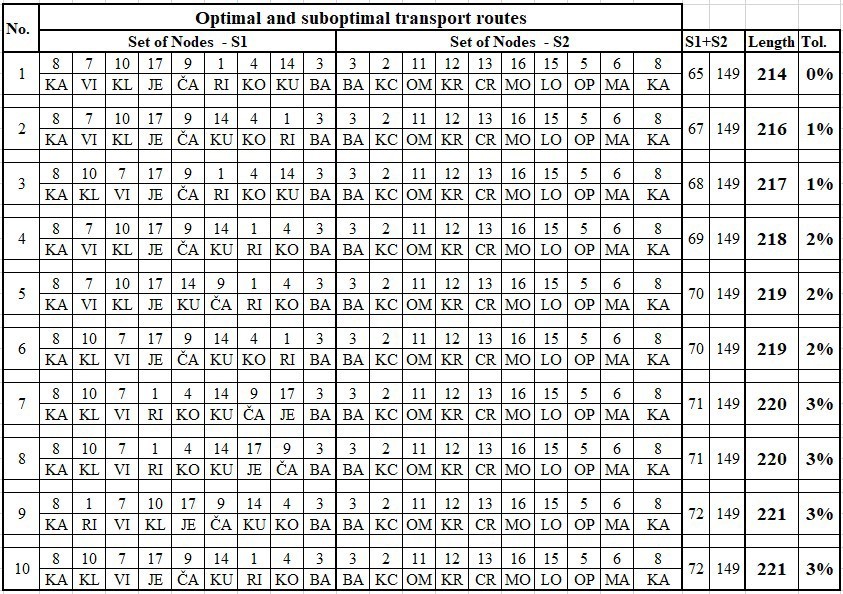
Table 4 reveals the suboptimal transportation routes having values within an acceptable tolerance of 3% as compared to the best optimal value, or minimum route length as calculated. In Table 4 in the column No the same ordinal numbers indicate the relations that are symmetrical. From the table it is seen that the relation No 1 is optimal, and the other relations (from 2 to 10) are suboptimal relations.
By comparision of optimal solution generated by exhaustive search algorithm, shown in table 4. (the line No 1, the column Length) and optimal solution generated by program for mathematical modelling Xpress (Figure 1), we can see that the results match.
The reader should understand the differences between optimal and suboptimal solutions and when one is required or more desirable than the other. If the problem is not continuous, as in a job-shop where persons are assigned to do different jobs on a job to job basis, a suboptimal solution is perhaps more desirable because it can be obtained much more cheaply and quickly. At this point, it should be noted that anyone can obtain a suboptimal solution. The Traveling Salesman Problem (TSP) is a problem which requires an optimal solution, especially if the route is to be used several times. In general, if the solution is to be applied only once, a suboptimal solution will be adequate and a very close to optimal solution may be even more desirable than the optimal solution (Gregory, 1970). Sequential insertion with possible requests for variable quotes to all trucks and to all routes potentially produces suboptimal solutions (Greenwood. 2009.)
In the described example of the transport network optimization of PGZ, the criterion (factor) of optimization is the minimum length of the transport relation. Considering the more optimal solutions within a given deviation interval, it is possible to parse and analyze the synergy of all relevant factors that determine the best (optimal) or set of best solutions.
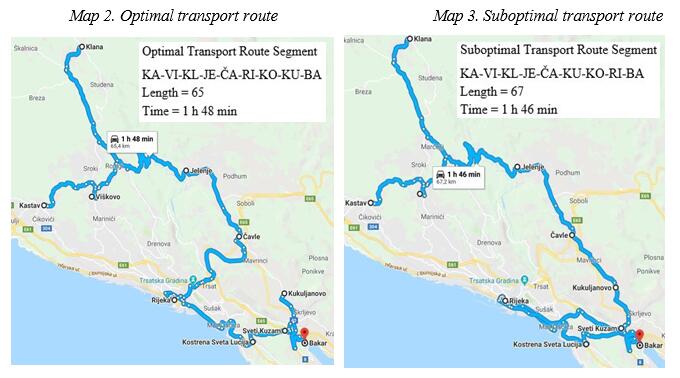
By comparing the optimal solution to map 2 and the suboptimal solution to the map 3. can be seen the change of order of cities (nodes) in the tranport network segment (S1) of PGC. Map 2 is the graphical display of the optimal transportation route (No. 1 in Table 4) having the minimal length. Map 3 is the graphical display of the suboptimal transportation route No. 2 in Table 4 of PGC. The suboptimal solution to Map 3 corresponds to the solution under No. 2 shown in Table 4.
In the upper-right part of the map 2. and map 3. there are display the transport routes, the values of the length of the transportation routes and estimated time of drive. Side-by-side analysis of the above values can be seen that from the position of the length of the relationship, the most favorable is the first relation shown in map 2. Estimated time from the position of driving, the more favourable it is conveying the relationships shown in map 3.
Significance of suboptimal solutions to the transportation problem of Rijeka Urban Agglomeration is illustrated by a hypothetical example as shown in Table 5. The example shows the following parameters: Total Transport Capacity (TTC), Reserved Transport Capacity (RTC), Free Transport Capacity (FTC), Loading Cargo Units (Inputs), Fixed Quote of Loading (Input1), Variable Quote of Loading (Input2) and Load Capacity Utilization (LCU).

The table shows a comparison of the two transportation routes: Route 1 (Čavle - Rijeka) and Route 2 (Čavle – Kukuljanovo). Scheme 1 reveals that Route 1 is the optimal solution of the total transportation route of PGC, while Scheme 2 suggests that Route 2 is a suboptimal solution. In the example, as shown in Table 1, Load Capacity Utilization (LCU) is analyzed. The origin is Čavle, and potential destinations are Rijeka (Route 1) and Kukuljanovo (Route 2). The data in the origin column (Čavle) are values for TTC, RTC, and FTC, whereas the data in the destination columns (1 and 2) are values of the fixed and variable quotes of loadings, transported along Route 1 and Route 2.
The table reveals that the fixed quotes of loadings (Input1) that are loaded at the origin (Čavle) are equal for both routes. The variable quotes are different, with the quote for Route 1 (Čavle - Rijeka) being equal to 0, and the quote for Route 2 (Čavle - Kukuljanovo) is 400. Choosing Route 2 increases the load capacity utilization (LCU). The table shows that the value of LCU on Route 1 equals 70%, and LCU on Route 2 is equal to 90%.
4. Conclusions and Implications
The paper considered the use of the exhaustive search algorithm, in identifying and finding the optimal and suboptimal solutions of the transportation network on the example of PGC. Authors should discuss the results and how they can be interpreted in perspective of previous studies and of the working hypotheses. The findings and their implications should be discussed in the broadest context possible. Future research directions may also be highlighted. The method of exhaustive search algorithm based on visual and object oriented methods of modeling and programming, enables calculating the suboptimal solutions with clear visualization and interpretation not only for the optimal value of transport network, but approximately equal value (suboptimal values) and their deviations from the optimal value. It has been proved that the use of the exhaustive search algorithm in finding the suboptimal solutions, significantly effects on the transport network optimization, so that allows a reduction in transport and logistics transport cost and time, but also more flexible designing structure of the transport network, the greater utilization of transport capacity, thereby creating added value and achieve greater profits, which confirmed the research hypothesis.