Acadlore takes over the publication of JCGIRM from 2022 Vol. 9, No. 2. The preceding volumes were published under a CC BY license by the previous owner, and displayed here as agreed between Acadlore and the owner.
Influence of Selected Organisational Factors on Innovation
Abstract:
It is almost impossible to imagine a company that does not innovate in today's market. Some companies say they compete on quality and not innovation, but they also innovate, especially in the form of process innovation aiming at enhancing quality. The aim of this paper is to present how the key set of selected organisational factors, company’s organisation, strategy, and processes, learning and links, influences innovation. In this respect, the key set of organisational factors has been measured on Croatian companies. In field research we used a questionnaire developed by Tidd et al. (2005) which was further developed to include measurable parts of innovation. The questionnaire is validated by factor analysis, but the influence of latent variables on innovation outcome, such as the number of innovations, revenues from innovation and length of time for new product launch, was researched by structural equation modelling. The research results showed that the set of strategy and learning factors has a significant influence on the number of innovations in companies (radical or modified). At first glance it might seem as though big companies have more resources and are thus in a privileged position to innovate, but researches show that the companies that are able to mobilise their employees, their knowledge and expertise in delivering new products or services, obtain better innovation results. The research results clearly indicate the relationship between company’s higher innovativeness and higher innovation results.
1. Introduction
Creating a sustainable competitive advantage is the main priority of companies, therefore, the effort is put into their organisational potential or their resources. Innovation processes and product innovations contribute to the prosperity and competitiveness of enterprises, so that many companies are exploring factors that affect innovation (culture, strategy, leadership, etc.), especially in organisational settings. The overall purpose of this research is to further our understanding of how selected organisational factors influence innovation. The aim of this paper is to present how the key set of selected organisational factors, company’s organisation, strategy, and processes, learning and connections, influences innovation. Furthermore, the paper presents a model of the selected organizational factors that affect innovation management from an internal perspective. In this paper, according to Tidd et al. (2005), the focus is on: strategy, processes, company’s organisation, links and learning; since they found that these characteristics are present in all successful innovations:
($\alpha$) Strategy innovation supported and propagated by the management of the company;
($\beta$) Links innovation requires good communication within and outside the company;
(x) Processes innovation requires the company to quickly adapt to new rules and procedures, to new demands;
($\delta$) Organisation innovation has to be supported in all organisational segments (structure; delegation, etc.)
($\varepsilon$) Learning the company must support and encourage learning since it is the basis for the creation of new ideas.
In this regard, the key set of organisational factors has been measured on Croatian companies. In field research we used the well known self assessment questionnaire for companies created by Tidd et al. (2005, 566 568) which was further developed to include measurable parts of innovation. The research was conducted electronically in the period from 17 January 2012 to 06 February 2012. The questionnaire was sent by e mail to 2,443 e mail addresses of companies (with more than 10 employees) engaged in production and programming; the information was obtained from the Croatian Chamber of Economy. The questionnaire was completed by 135 companies, representing a response rate of 5.53%. The research included 62.5% of small companies (10 50), 21.52% of medium sized (21.32%) and 14.71% of large companies (over 250 employees).
Apart from descriptive statistics, the questionnaire itself had to be validated, since the validation of the questionnaire had not been found in literature. The questionnaire is well structured and the grouped variables shown in Table 2 really have the ability to explain the phenomenon of innovation in companies. This instrument is considered fully verified. Having done that, it was examined, based on structural equations, how each category defined in the questionnaire (strategy, processes, organisation, links and learning) affects the number of new products, the speed of launching new products and revenues from these new products.
The Tidd et al. (2005) questionnaire measures, among other things, the Innovation Index. The higher the index, the higher the innovation output. However, the innovation output has to be measured as well. Hagedoorn and Cloodt (2003) list several possible innovation output measures. The measures they propose include the number of innovative products that the company launched, the time in months necessary to develop a new product and percentage of revenues generated by new products. The companies that have aligned their strategy, processes, organisation and links with external partners and workers’ learning will have a higher number of successful new product launches. The companies that have a structured way of innovating, measured by the Innovation Index, will need less time to develop new products, because procedures for innovation are known and institutionalised, therefore, save time. As companies have more new products in their portfolio, it is expected that a larger part of their revenues will be generated from the new products. Therefore, the following hypotheses can be made:
H1: A higher innovation index significantly increases the number of innovations.
H2: A higher innovation index increases revenues from innovation.
H3: A higher innovation index reduces the time of innovation.
The research results show that the set of strategy and learning factors has a significant influence on the number of innovation in companies (radical or modified). At first glance it might seem as though big companies have more resources and are thus in a privileged position to innovate, but researches show that the companies that are able to mobilise their employees, their knowledge and expertise in delivering new products or services, obtain better innovation results. The result of this work is a concrete number on a scale from 1 (low level of innovation) to 7 (high level of innovation) for the entire sample of Croatian manufacturing companies. The results are discussed in the context of the relationships identified between the selected organisational factors and innovation management. The research results clearly indicate the relationship between higher innovativeness of the company and higher innovation results. From this point on, we open up the debate on innovation management from an internal organisational context, because this research provides an insight into the selected organisational factors that can influence innovation in the Croatian context. Also, the paper presents the results of the Croatian innovation audit.
2. Theoretical Background
Over the last decades, there has been an increased interest in the field of managing innovation. Innovation management is concerned with the activities the company undertakes to yield solutions to problems related to products, processes and administration. Using the innovation value chain, management can identify organisation’s weaknesses and, as a result, be more selective about which innovation tools and approaches to implement. Failure to identify the weak link (idea selection) and focusing more time and resources on the strong link (idea generation) ultimately undermined the company’s innovation efforts (Hansen, Birkinshaw, 2007). In the same context, Hamel (2006) defines management innovation as ‘a marked departure from traditional management principles, processes and practices or a departure from customary organisational forms that significantly alters the way the work of management is performed’. So, innovation as a process (Weisenfeld, 2012: 199) is the conception, development and introduction of something new into an environment. ‘Something new’ can refer to products, (production) processes, business models or new ways to organise and manage. For OECD (2005, 46), innovation must be ‘new (or significantly improved) to the firm’ and the main point is that neither the idea, nor the invention, is crucial, only the successful implementation on the market or in the company is decisive. So, here we are facing the paradox that innovation, as an internal attempt, depends on internal organisational factors. The question is ‘Which organisational factors can enhance innovation? Which factors do we have to put extra effort in?
Successful innovation is important because it is the creation and implementation of new processes, products, services and methods of delivery which result in significant improvements in outcomes, efficiency, effectiveness or quality (Albury, 2005). Innovation can be utilised to add value to the company, through increased revenues, reduced cost, and similar improvements in financial results. This has two important consequences for the analysis of any innovation in the context of an organisation. First, innovation must be integrated into the operations and strategy of the organisation, so that it has a distinct impact on how the organisation creates value or on the type of value the organisation provides in the market. Second, innovation is a social process, since it is only through the intervention and management of people that an organisation can realise the benefits of an innovation (Hienerth, 2007). Accordingly, innovations are essentially related to learning, changes (sometimes and the risk they require includes initial investments that are returned only in the long term (Prester, 2010: 92). Generally, it's about learning and necessary changes in strategic terms, relationships and communication within and outside the company, the process of learning about the new rules and procedures and adjustments to organisational structure that must also adapt to changes. What has so far been learnt about innovation and that needs to be especially emphasised is the following (Prester, 2010: 201; according to McDonough et al., 2008):
Successful innovation is a strategic issue;
Successful innovation depends on internal and external relationships;
Successful innovation requires innovation climate in the company
Successful innovation requires mechanisms that encourage and enable change.
According to the Global CEO Pulse Survey on Innovation (Percival et al., 2013), most companies: view innovation as organisation’s priority (51%) and value innovation they are good in recognising new ideas and approaches and adopting them quickly (36%). The same companies are looking to innovate over the next 3 years in areas (top three mentioned) such as products (48%), technology (45%), customer experience (44%), systems and processes (43%), business models (41%) %), etc. Furthermore, the most important ingredients for successful innovation for these companies are: having the right culture to foster and support innovation (57%), strong visionary business leadership (44%), willingness to challenge organisational norms and take risks (37%), as well as the ability to capture ideas through the organisation and have the capacity and capability for creativity (31%). In other words, overcoming the barriers to innovation is likely to require new ways of building it into strategic and operational management of the business. It is clear that innovation should be built into everyone’s job description and the opportunities to innovate need to be created. However, according to the same survey, the following constraints are stopping organisations in being more innovative: financial resources (43%), existing organisational culture (41%), lack of talent (39%), etc. The same authors also offered five key questions that organisations will need to address if they are to become genuinely innovative and generate full value from their investment:
(1) Does the way you innovate (collaboration, employee empowerment, customer engagement, time horizons etc.) reflect your vision and appetite for innovation?
(2) How effectively are you articulating your vision and appetite for innovation to employees, investors and business partners?
(3) Do your employees see creating, promoting and executing new ideas as a crucial part of their job description?
(4) Are the processes for decision making and organisational mobilisation quick enough to bring new innovations to market ahead of your competitors?
(5) How effectively do you measure and track the return on investment and ability to meet customers’ changing expectations?
Answering these questions and understanding the influence of organisational factors on innovation can provide management with a new perspective on how to encourage successful innovation.
The literature and practice on innovation over the last decade have revealed that it is, in fact, possible for an organisation to be more systematic about innovation. Following intentional, repeatable processes can allow an organisation to more effectively develop, test, implement, and share new ideas. To clarify these methods, innovation specialists have developed a number of valuable models and typologies that help elucidate successful innovation processes. (Kasper, 2008)
There are authors that explicitly treat the contextual factors, such as Rothwell (1994),Van der Ven (1999), Mulgan and Albury (2003), Cormican and O’Sullivan (2004), Tidd and Bessant (2005) and Jacobs and Snijder (2008), because their opinion is that innovation processes do not exist in a vacuum (Eveleens, 2010)! There are variations in how these factors are described, but the main factors described from an internal organisational perspective are: strategy, culture, leadership, organisational structure, resources/skills.
One of the problems is that while the eyes of the CEO are fixed on innovation, the body of the organisation may not be following (Percival et al., 2013: 3). The ’antibodies’ that inhibit innovation include a culture that sees it as separate from the mainstream operations of the business and is slow to commercialise new ideas (Percival et al., 2013: 3). Therefore, internal structures are important in the process of innovation. They consist of the interaction between the members of the organisation and the communications media behind them, as well as the factors supporting the productivity of the organisation’s members by improving their team work skills. The organisation’s vision, strategies, goals, values, culture and philosophy are also part of the internal structures as well as the links to the external environment of the organisation, e.g. to customers and service providers, constituting the organisation’s external structure. (Ability to Innovate, 2013)
Therefore, this paper focuses on the selected organisational factors which are crucial in order for an organisation to enhance innovation.
3. Research Results
The research shows that Croatian enterprises attach importance to innovation, as can be seen from the percentage of revenues (Figure 1) allocated to research and development. A significant number of companies, 34.6% of them, will increase investment in research and development despite the crisis.

Furthermore, it may be noted that small enterprises reinvest the most. However, we should take into account that their revenues are lower when compared to other categories of companies, and if they do not want to lag behind in research they have to reinvest a higher percentage of their revenues.
The research included 62.5% of small enterprises (10 50), 21.52% of medium sized (21.32%) and 14.71% of large companies (over 250 employees), and the distribution of enterprise by industries is given in Figure 2.
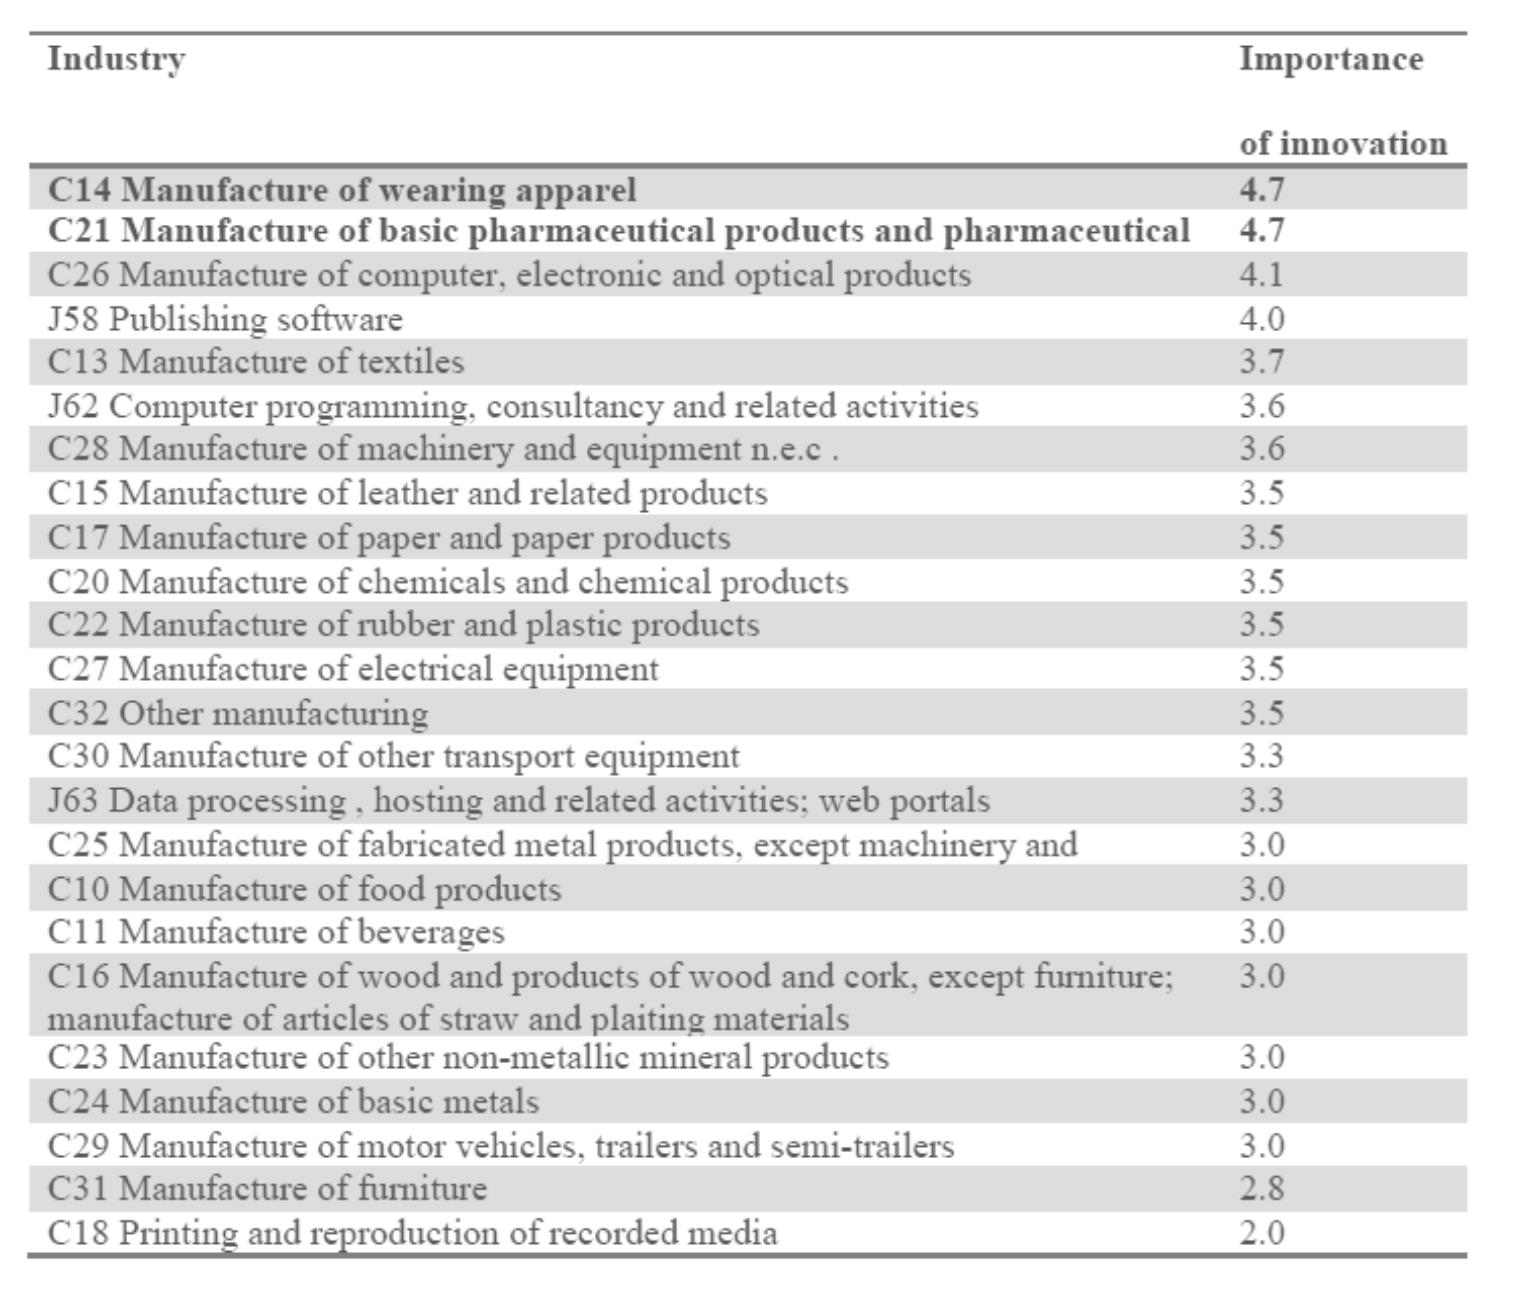
Differences in the perception of the importance of innovation are evident in some industries. Table 1 show that innovations are most important for the companies operating in the apparel and pharmaceutical industry.

According to the research study of innovation by the Boston Consulting Group (BCG, 2010) conducted on a sample of 1,600 U.S. companies, 84% of the respondents said that innovation is important for the survival of their companies. Also, their study showed that there is a correlation between innovation and business performance. In particular, the companies that have innovated achieved 12.4 % better results than those that have not. In Croatia, companies launch an average of four modified products per year and up to 3 completely new products. Figure 3 shows the distribution of new product launches by company size. There are a greater number of modified new products than completely new products, which is logical, since it is easier to modify the product according to customer's wishes than to come up with something completely new. The study did not confirm the rule that small enterprises are the most innovative ones. Many theorists argue that precisely small enterprises generate industry growth through innovation. This study shows that medium sized and large enterprises innovate more, but this can mainly be attributed to the fact that they have greater resources.
An additional argument to why companies focus on modified products is the duration of the new product development process as seen in Figure 4.
The new product development process takes, on average, two months longer than the development of a modified product. According to the study by the Boston Consulting Group (BCG), in the U.S. only 55% of the respondents were satisfied with their innovative results and showed that there is a clear causal link between the success of innovation and the decision to increase the innovation budget. However, according to the BCG report, it is also evident that top management is more satisfied with the results achieved in innovation than the lower levels of management and employees. In addition, 64% of respondents believe that not enough is invested in research and development.
Figure 5 shows the percentage of revenues generated from new and modified products. However, the figure is to be interpreted in the following way: 1 means revenues up to 10%, 2 means revenues from 10-20%, 3 means 20-30% of revenues, 4 means 30-40 % of revenues, while 5 means more than 40% of revenues. It is noticeable that, on average, revenues from modified products are higher than that from new products, which is logical because new products need additional marketing. Large enterprises benefit the most from modified products; the majority of medium-sized enterprises benefit the most from new products. This research did not examine the level of satisfaction with innovation at various levels of management, but the person who filled out the survey said whether the planned budget: 1 - is too low, 2 - covers the basics, 3 - is sufficient to cover most of the research, and 4 - satisfied with investment in R&D (Figure 5).
On average, all groups of respondents belong to group 2, which means that the budget for R&D for the current year covers the basics, while large enterprises are least satisfied with their investment in research and development. If this is compared with the percentage of revenues reinvested into research and development (figure 1) then this result is somewhat logical, because large companies invest the lowest percentage of revenues. However, one should also take into account that the revenues of large enterprises are much greater than those of small and medium sized enterprises. According to the study by the Boston Consulting Group (BCG, 2010), the greatest advocates and drivers of innovation in enterprises are CEOs or top management. However, the study also shows that it is not enough just to be an advocate, but to ''sell'' the "idea" to employees.
According to the BCG study, only 28% of top managers have managed to convey the idea to employees. In Croatian companies, top managers usually trigger ideas about innovation as seen in Figure 6. Whether top management succeeded in conveying the vision of innovating to its employees is the first question of the questionnaire, which reads as follows: "1) The employees in our company have a clear vision of how innovation will help us in a competitive market." Figure 8 shows that the management board only partly managed to convey the vision. The ratings offered were: 1 false, to 7 completely true, while 4 meant partly true.
It is noted that the employees in small enterprises are somewhat better acquainted with the vision of innovation when compared to large enterprises, which can be explained by the assumption that small enterprises more easily convey and explain the vision to innovate because they have a relatively small number of employees. It has already been said that the satisfaction with the innovation results increases the likelihood of further greater investments in innovation. According to the BCG study, the main measures to verify the success of innovation are customer satisfaction and overall return on investment. However, BCG recommended that innovation must be verified by multiple criteria, and the reward system should be aligned with those measures. In Croatia, just as in America, the main measures for monitoring the success of innovation are shown in Figure 9.
It is noted that in Croatia, as well as in America, customer satisfaction is the main indicator of innovation success; followed by revenues from new products and total revenues generated. The BCG report points out that one of the essential measures should be the speed of product launches. No one picked this answer in Croatia. The next research subject refers to barriers to innovation. According to the BCG report, the main problems in the U.S. companies are employee risk aversion and long new product development time. The situation in Croatia is shown in Figure 10.
The main barrier in Croatian companies is the duration of innovating. Figure 4 shows that the development of modified products takes on average 5 months, and the development of a completely new product 7 months. Research also shows that early involvement of all employees in innovation projects can shorten the development time, because most of the actions required for a successful product launch can be conducted simultaneously. Another problem is the selection of criteria for further investment in an innovation project. There are several methods for selecting projects, and the most used methods are the Net Present Value Method, Internal Rate of Return, Analytical Hierarchy Process or the Model Based on Two Criteria. Another barrier to innovation is inadequate marketing of new products. The marketing of new products is really something that needs investing in, since it is one of the basic ways how customers come to realize that a new product exists in the market. Barriers to innovation vary according to company size. The barriers are greater in larger enterprises as seen in Figure 11. The biggest difference between barriers in large enterprises and other categories of enterprises is poor coordination between departments within the company, lack of ideas and inadequate measurement of innovation success. Case studies of the most successful innovative companies resolve such problems by forming cross functional innovation teams which include members from Marketing, Engineering, Research and Development, Production and others. Each innovation team has its own leader who leads the innovation project and, at the same time, as part of ensuring that the project is completed within budget and in time, monitors the performance measures of innovation. These teams are usually appointed by the management board. Ideas are collected from all parts of the company and, based on the criteria (net present value or other), the projects with the greatest market potential are selected.
Innovations are divided into product innovation, innovation of production process and organizational innovation; although at the mere mention of innovation the thought of new products comes to everyone's mind. Even the innovations of products vary, for example, there are radical innovations or just improvements of existing products. This information is essential for a better interpretation of the following result. As shown in Figure 12, product innovation is not a priority for the Croatian manufacturing companies. Product innovation is only at the fifth place. The first place belongs to better product quality, which is achieved through process innovation. This result is somewhat surprising.
Despite the assumption that Croatian companies will compete in the global market through innovation, the key priority seems to be quality. The question is whether this is a good strategy in an era when China is increasingly investing in research and development as well as in its education system. This touches on labour issues. Are there any occupations in demand? The questionnaire asked the question: "If there was no recession, how many employees would be necessary for a particular profession? „ The results are shown in Figure 13.
Skilled workers are most in demand, followed by mechanical and electrical engineers. The occupations in demand are also mathematicians, physicists and chemists. The needs are greater in larger enterprises (Figure 14).
Finally, a summary report was made on the success of innovation management in the Croatian economy. But very few studies have been found in literature that propose a measuring instrument for measuring innovation. Even the validation for the questionnaire that was used in this research had not been found. Therefore, the first step was to check the validity of the questionnaire. First the reliability of the variables was checked using the Crombach Alpha coefficient which is high for all of the observed variables.
Constructed variable | Questions from the questionnaire* | Crombach Alpha | Sig. |
Strategy | f1 f6 f11 f16 f21 f26 f31 f36 | 0.918 | 0.000 |
Processes | f2 f7 f12 f17 f22 f27 f32 f37 | 0.899 | 0.000 |
Organisation | f3 f8 f13 f18 f23 f28 f33 f38 | 0.906 | 0.000 |
Links | f4 f9 f114 f19 f24 f29 f34 f39 | 0.851 | 0.000 |
Learning | f5 f10 f15 f20 f25 f30 f35 f40 | 0.850 | 0.000 |
Then a confirmatory factor analysis was performed to check whether the variables grouped in this way indeed describe the phenomenon of innovation. The satisfactory level of indicators was obtained, as shown in the following table:
METHOD OF ESTIMATION: ML | CHI-SQUARE STATISTIC: 2573.33 |
Discrepancy Function: 19.8 | Degrees of Freedom: 740 |
Maximum Residual Cosine: 7.71E-005 | Chi-Square p-level: 0.000000 |
Max. Abs. Gradient: 0.000149 | Steiger-Lind RMSEA |
ICSF Criterion: 2.53E-006 | --->Point Estimate: 0.13 |
ICS Criterion: 0.000197 | -->Lower 90% Bound: 0.125 |
Boundary Conditions: 0 | -->Upper 90% Bound: 0.136 |
Joreskog GFI=0.822 | RMS Stand. Residual: 0.431 |
According to these factor model parameters, we can conclude that the questionnaire is well structured and that the grouped variables shown in Table 2 really have the ability to explain the phenomenon of innovation of companies. This instrument is considered fully verified.
Figure 15 shows the Croatian innovation audit, created according to Tidd et al. (2005: 566-568). The respondents answered 40 questions that assessed five segments important for innovation. These are: strategy, organizational structure, processes, learning and links. The respondents assign to each question a value from 1 false to 7 completely true. Then the median value is calculated for a particular segment. Figure 14 shows also how the entire sample of companies stands in relation to each segment. Since the values range from 1 7, the overall average rating of 4.7 for innovation management in the Croatian manufacturing sector with more than 10 employees is really great.
All the companies that participated in the research received their own innovation audit with the comments on where they can improve their ratings. The ratings are generally high for the overall sample, but work still needs to be done in individual categories. The company fills out the questionnaire, and when it obtains group ratings by categories, it sees where it deviates most from the target value (maximum 7), follows the questions in this category and tries to fix it.
Finally, the structural model shown in Figure 16 was made, and the parameters which indicate the validity of the model are shown in Table 4.
Some very interesting results can be seen. If the management board explicitly supports innovation, the number of new products will grow, but the process of innovation itself may take a little longer and has a moderate impact on revenues from innovation. Processes, i.e. quickly adapting to rules and procedures, do not significantly affect the number, speed and revenue of innovation. Organisational structure negatively affects the speed of new product launches, but is necessary to ensure revenues from innovation. This indicates the importance of the interdisciplinarity of innovations, that is to say, it is not enough just to come up with ideas and declare that you want to innovate more, it is necessary to ensure that the new product is a commercial success at a reasonable level of research costs. Links, i.e. good communication within and outside the company, most significantly affect the speed of launching a new product, which can represent a competitive advantage. Learning, the basis for the creation of new ideas, has a major positive impact on the increase in the number of new products.
METHOD OF ESTIMATION: ML | CHI-SQUARE STATISTIC: 2604.37 |
Discrepancy Function: 42.7 | Degrees of Freedom: 974 |
Maximum Residual Cosine: 0.00283 | Chi-Square p-level: 0.000000 |
Max. Abs. Gradient: 0.0157 | Steiger-Lind RMSEA |
ICSF Criterion: 0.00173 | --->Point Estimate: 0.124 |
ICS Criterion: 0.00891 | -->Lower 90% Bound: 0.116 |
Boundary Conditions: 1 | -->Upper 90% Bound: 0.132 |
Joreskog GFI=0.927 | RMS Stand. Residual: 0.429 |
Finally, it was verified whether the overall innovation index obtained by the measurement instrument used can actually be a measure of innovation measured by external innovation results. Structural equation modelling was used. The estimated parameters are calculated on the basis of covariance, not correlations, and the parameters can be greater than 1.
PARAMETER ESTIMATION | STANDARD ERROR | T - STATISTICS | SIG. | |
(innovation index)-15->(number of innovations) | 3.135 | 0.327 | 9.592 | 0.000 |
(innovation index)-16->(speed of innovation) | -1.121 | 0.451 | -2.487 | 0.013 |
(innovation index)-17->(revenues from new products) | 0.305 | 0.145 | 2.098 | 0.036 |
The estimated parameters show that the following hypotheses can be confirmed:
H1: A higher innovation index significantly increases the number of innovations
The first row in Table 5 clearly shows that the higher the innovation index is, the higher the number of new products will be. Since significance is p=0.000, it can be concluded that the number of launched new products is significantly higher than in the case of lower innovation index.
H2: A higher innovation index increases revenues from innovation
This hypothesis is shown in the third row in Table 5. The parameter estimation is positive, which means that the innovation index will actually increase revenues. The significance is less than the threshold value of p=0, 05, therefore it can be concluded that the higher the innovation index, the higher the revenues from new products.
H3: A higher innovation index reduces the time of innovation
This hypothesis is shown in the second row in Table 5. The parameter estimation is negative, meaning that the higher the innovation index, the shorter the time needed for new product introduction to market. Significance is also satisfactory, meaning that it can be confirmed that the relationship is valid.
Structural equation modelling was proposed that links the innovation index and these three external measures of innovation presented in Table 6.
METHOD OF ESTIMATION: ML | CHI-SQUARE STATISTIC: 23.47 |
Discrepancy Function: 0.51 | Degrees of Freedom: 11 |
Maximum Residual Cosine: 3.34E-010 | Chi-Square p-level: 0.015162 |
Max. Abs. Gradient: 0.00614 | Steiger-Lind RMSEA |
ICSF Criterion: 2.1E-010 | --->Point Estimate: 0.167 |
ICS Criterion: 4.61E-010 | -->Lower 90% Bound: 0.0803 |
Boundary Conditions: 4 | -->Upper 90% Bound: 0.254 |
Joreskog GFI=0.865 | RMS Stand. Residual: 0.103 |
The Joreskog GFI index is almost 0.9, which means that this model can actually represent the relationship between the innovation index and external indicators of innovation.
4. Conclusion
The research shows that Croatian enterprises attach importance to innovation and it is noted that small enterprises reinvest the most. Also, on average, the investment in R&D is not satisfactory, it just covers the basics and if companies’ innovations are seen as a contribution to their prosperity and competitiveness, the question is: Should companies invest more in R&D in the future? What is good is that in Croatian companies top managers usually trigger ideas about innovation because successful innovation is a strategic issue. Also, we can notice that employees partly (for small companies 4.56; medium sized companies 4.52; and large companies 4.37) have a clear vision of how innovation can help their companies in a competitive market. Furthermore, companies have measured their innovation success by: (1) customer satisfaction (62%) and (2) revenues from new products or services (15%). The barriers to innovation in Croatia are a bit different: new product development takes a very long time (2.8); companies find it hard to decide which potential new product/idea to invest in (2.6); marketing department inadequately promotes new products (2.4), as well as: employees are very risk averse; reward system in the company is not associated with innovation and companies do not have a way of measuring the success of a new product (2.2.), etc. While the priorities are: quality (4.6); timely delivery (4.2); flexibility (4.1.), etc. Moreover, the very important product innovation is not a priority for the Croatian manufacturing companies! Finally, the Croatian innovation audit showed that in the five segments important for innovation: strategy, organisational structure, processes, learning and links, the overall average rating of 4.7 is really great. Croatian companies achieved the best score in: organisation (5.1) and strategy (4.9). From the structural model of links and link strength between the variables that explain innovating and innovation results we can conclude the following: strategy mainly influences the number of innovations; links have a great influence on the speed of launching and learning has the greatest influence on the number of innovations.
Generally, it turned out that the support to innovation management will increase the number of innovations; however, the support to administration will not significantly contribute to an increase in revenues from innovation. Also, organisation has a greater role in ensuring that innovation is successfully commercialised, but the downside is that it slows innovation. On the other hand, the better the communication, the faster the innovation process. Finally, learning has a positive effect on the number of new products. The presented results show that a higher innovation index increases the number of innovations.
The phenomenon of innovation is really complex because it includes a number of factors, such as engineering, employee knowledge, psychological and sociological research, and it indeed is an interdisciplinary process. Therefore, this study is only a fraction of the research dealing with how to increase innovation in Croatian companies in this extremely competitive environment now that they compete in the European market.