Acadlore takes over the publication of JCGIRM from 2022 Vol. 9, No. 2. The preceding volumes were published under a CC BY license by the previous owner, and displayed here as agreed between Acadlore and the owner.
Analysis of Desktop Browser Positioning Based on Users Perception in Indonesia
Abstract:
The increasing of internet users affecting the choice of browsers and for now, desktop users still dominate the usage. The research’s goal is to analyze the well-known browser such as Mozilla Firefox, Google Chrome, Internet Explorer, Opera, and Safari from the Indonesian customer point of view. The variables used in the analysis are the speed to display HTML, the speed of executing ECMA Script, the browser security, the need of hardware resource, and the general feature of each browser. We distribute questionnaire to 400 users of the five browsers in Indonesia. The multivariate statistics of multidimensional scaling used to process the data. The research found that Mozilla Firefox is the best browser on speed criteria when displaying the HTML and general feature, as the Google Chrome win the heart of Indonesian users on the speed criteria when executing ECMA Script. As usual, the Apple Safari excels on the security and the hardware resources consumption (KHR1). The Internet Explorer considered the best on the hardware resources consumption criteria.
1. Introduction
The increasing internet users especially in Asia had form an internet culture. The Asian has huge population which reach 3,9 billion people and 44.8% of them already using internet (Worldstats, 2013). The dawn of the internet drive the growth of the website which provide enormous information, then followed by the development of the browsing application to enhance the experience of surfing the internet. The application called web browser or just simply browser. In business terms, browsing is a store leisure activity whose motives are mainly recreational (Lombart, 2004). Kim and Kim (2008) stated that if consumers having high shopping enjoyment, they are more likely to be browsers. The internet and the countless thousands of website provide information for the user. In fact people now accustom to find the information from the internet. This development is supported by the browsers which act as the gateway to the information. Browsers, now is not just an application to open the websites but also function as the hub for the internet users. This affects the emergences of various browser applications. The developers try to offer the browsers which provide easier access, ease of use, better navigation and the appearance.
Browser can be accessed from several gadgets. Besides the old ways using the desktop computer, now user can use their browser from notebook, phone, or tablet. They become more mobile. The figure from Net Application find that the majority of the user using the browser from the desktop which reach 88%. Compare to the smartphone and other mobile browsing which consist of 11.4%. This clearly prove that the desktop is still become the choice for the internet users.
In 1995, Microsoft released Internet Explorer which then become pioneer in the browser wars. At the end, Microsoft win the market and the closest rival, Netscape try to made their browser as open-source with the new name, Mozilla on 1998. In the mid 90’s, the Opera shown up as the new browser (Grosskurth and Godfrey, 2011).
There are five web browsers which very well known by the users. top five in The most widely used is the Google Chrome which represent 34,88% of users. The next in line is the Internet Explorer (IE) with 32% users, Mozilla Firefox with 22,47% users, Safari with 7,54% users, and Opera with 1,49% users. The other browser represent only 1,62% users. Those ranking based on the Statcounter (2013) which measure the web popularity by the hits from each browsers. From the same sources, the internet users in Indonesia on 2013 show the differences of the browsers popularity. The first choice is the Mozilla Firefox with 63,5% users, followed by Google Chrome with 26,95% users. The Microsoft Internet Explorer (IE) on the third place with 3,02% users, next is Safari with 2,49% users, and Opera placed fifth with 2,08% users, while other browser consist only 1,96% users.
Hawkins et al. (2000) investigate the awareness of the Internet security in various industries ranging from the public and private sectors. Pentina et al. (2011) confirmed that browser satisfaction have a mediating role to increase sales and traffic for online business. Further research by Iwata et al. (2010) examined the children-oriented web browser, which ultimate aims is to keep children’s interest on pages and help them to easily understand the contents of the pages. Other research regarding browsing experience conducted by Nsairi (2012) whose analyzed the browsing experience in retail stores through perceived value. To expand the discussion about the browser management, we analyzed the Indonesia customer perception based on the browser superiority. This research analyzed the browser positioning using different method compare to Statcounter (2013). At the end, we also compare each browsers superiority using the perceptual mapping method.
2. Literature Review
The word ‘Positioning’ is related with the activities to shape or influence the preferences of consumers. In the end this effort aimed to ahieve high consumer loyalty, consumer-derived brand equity, and customer willingness to search for the certain brand (Keller, 2003; Schiffman and Kanuk, 2010). The brand positioning relatively similar to the brand image construct, which is defined as “the concept of a brand that is held by the consumer. This concept inside the customer mind is largely a subjective and perceptual phenomenon that is formed through consumer experience and interpretation, whether reasoned or emotional” (Dobni and Zinkhan, 1990).
In Kotler’s theory, segmentation, targeting and positioning is described as a sequential process (Laforet, 2010). Kotler and Keller (2012) define brand positioning as the “act of designing a company’s offering and image to occupy a distinctive place in the minds of the target market. This mean that the company deliberately create the image of their product, then they make effort to implant this image into the customer mind. They want their customer feel, think their product is the ultimate solution for their certain problems. Peter & Olson (2008) discussed several categories of brand positioning:
(1) product attributes (consumers seek benefit from product features such as quality and price);
(2) uses or applications of the product;
(3) product user (such as based on consumer lifestyles);
(4) product class (a product could be substituted); and
(5) competitors such as position to be a market leader.
Fill (1999) states that the successful positioning can only be achieved by adopting a customer’s perspective and by understanding how customers perceive products in the class, and how they attach importance to particular attributes that can be grouped under a construct (Sweeney & Soutar, 2001). The end result of the positioning is the creation of a customer-focused value proposition. As we all know, the value proposition become the strong reason why the target market should buy the product” (Kotler, 2003, p. 308).
There are several definition regarding the “Attitude.” One of them came from Schiffman and Kanuk (2010). They regard attitude as a learned predisposition to behave in a consistently favorable or unfavorable manner with respect to a given object.” Solomon et al. (2002) argue that attitudes exist simply because of the fact that they perform a particular function to a person; this means that they are determined by motives of an individual. Individuals with good feelings may have favorable ad attitudes (Edell and Burke, 1987). In fact, consumer attitude itself is becoming one subset of feelings, and the traditional marketing paradigm with the optimal function as the ultimate objective is turning into a new one with stress more on feelings and relationships (Hirschman and Holbrook, 1982).
According to Suryani (2012), a perception process initiated by a stimuli that our senses know. Stimuli can lead to the perception of a variety of shapes, like everything that can be smelled, seen, heard, touched. These stimuli would be the sensory organ called sensory receptor. Direct or immediate response from the sensory receptor organs is called sensation. The level of sensitivity in sensation between one individual with another individual is different. The difference in sensitivity occurs because of the ability of the receptor among individuals that are not the same. In addition to the sensitivity factor, other factors that influence the intensity of the stimuli. The conceptual framework is describes on Figure 1.

Mozilla Firefox is the free platform browser which developed by Mozilla and hundred of the volunteer. Firefox can run on various operating system let say Microsoft Windows, Linux, Mac OS X, dan FreeBSD. The newest version is 24.0, which released on August 24 Agustus 2013 with of course several improvement and bug fixes. On the other hand, Google Chrome is the simple, speed, and secure browser. Chrome specially design for the modern websites. And already prove what is intended for. Chrome speed start right after we open the browser, then when web pages loading. Equipped with useful personal setting, Chrome easily enrich with its application, extension and themes. The user can get them through the Web Store Chrome. One of the strength is if you open Chrome using your ID, then you have the exact Chrome setting. So you do not have to be worry about your bookmark. They appear the same on every computer you log on.
As the default browser, Internet Explorer (IE) of course freely distributed alongside the released of Windows operating system. IE start its operation in 1995 and currently the newest version is IE 9 which is available if you using Windows 7, Windows Vista, dan Windows Server 2008. The next web browser was initially design for mobile, The Opera web browser. Opera was developed by the Opera Software from Oslo, Norwegia. Opera can also run in various operating system such as Microsoft Windows, Mac OS X, Solaris, FreeBSD dan Linux. Opera introduce the vector graphics library called Vega, which able to manage the browser rendering. Our next browser is exclusively develop and used for Apple system, the Safari. Its initial intend purpose was for Mac Computer. Now, Safari Browser can run on Mac, iPad, iPhone, dan iPod touch. Safari began its service for Mac OS since 1997. Now, Safari can also run on Windows operating system and the recent version is 5.1.7.
3. Methodology
This study analyze the Indonesian customer’s perception toward the top five brands of web browsers based on Statcounter (2013) which are Mozilla Firefox, Google Chrome, Internet Explorer, Safari and Opera. Online questionnaire was conducted in five-month period, from September 2013-Maret 2014. Using non-purposive probability sampling, the total sample size of our survey was 400 respondents. Items measurement was measured with five-point Likert-type scale.
Based on the theory from Limantara (Sopyani, 2012) about the general feature of the browser and Matamaya (Sopyani, 2012) about the browser performance measurement, we use the operating variables such as:
a. The speed of displaying the HTML (KBH): displaying speed can be measured by calculating time needed by the browser to open the certain size of an HTML file. The browser speed than compare with the speed of other browser.
b. The speed when executing the ECMAScript (KME). ECMAScript is the official name of Javascript (needed to play video and music media). Javascript developed by ECMA (European Computer Manufactures Association). The test which frequently used to measured the speed of executing ECMAScript is the SunSpider online test.
c. The browser security (KB): as we all know, there are not any software which bugs-free. Bug in a browser can be used by the web designer and hackers to seek the crack in computer security. They usually done that to steal or to trasnfer the virus. That is why the browser security is very important.
d. Hardware Resource requirement. This kind of performance measure the amount of hardware consumption needed by the browser. The requirement can be identify from several factors; the size of the installer package, the space needed after installation, (KRH 1), and the amount of memory used when operating the browser (KRH 2).
Multidimensional Scaling (MDS) is a technique for the analysis of similarity or dissimilarity data on a set of object. One of the purpose of MDS, it represents (dis) similarity data as distances in a low-dimensional space in order to make these data accessible to visual inspection and exploration. The most frequently used and the most natural distance function is the Euclidean distance (Ed) which represent by the formula (Borg and Groenen, 2005):
$d_{i j}(X)=\sqrt{\left(x_{i 1}-x_{j 1}\right)^2+\left(x_{i 2}-x_{j 2}\right)^2}$
For technical reasons, most MDS algorithms, like the Alternating Least‐Squares Scaling (ALSCAL) algorithm in the Statistical Package for the Social Sciences (SPSS), are more efficient with dissimilarity measures. As such, data collected with the intention of subsequent MDS analyses is generally dissimilarity data.
4. Result and Analysis
We gather 400 respondents which 62% of them were male and the 38% were female. The age distribution of the respondent is 22% below 20 years, 32% between 20-25 years, 27% between 25-30 years and 19% above the 30 years. Respondent’s profession dominated by the 49% of students, 18% civil servant, 22% private company employees, 8% entrepreneur, and other profession such as housewives and BUMN employees for 3%. The reason for using the internet are 33% of information searching, 11% using internet to communicate, 6% for gaming, 12% for business, and 38% to get some entertainment (Movie/video and music).
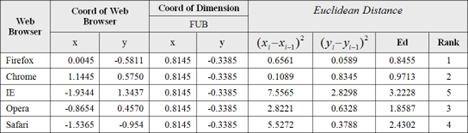
The analysis was conducted by calculating the euclidean distance of each position of web browsers on the related dimensions. In concept, euclidean distance, the closer the web browsers toward the related dimensions, the better the web browsers position based on the dimensions. The calculation of web browsers based on dimensions and Euclidean distance are presented on Table 1 and Figure 2.
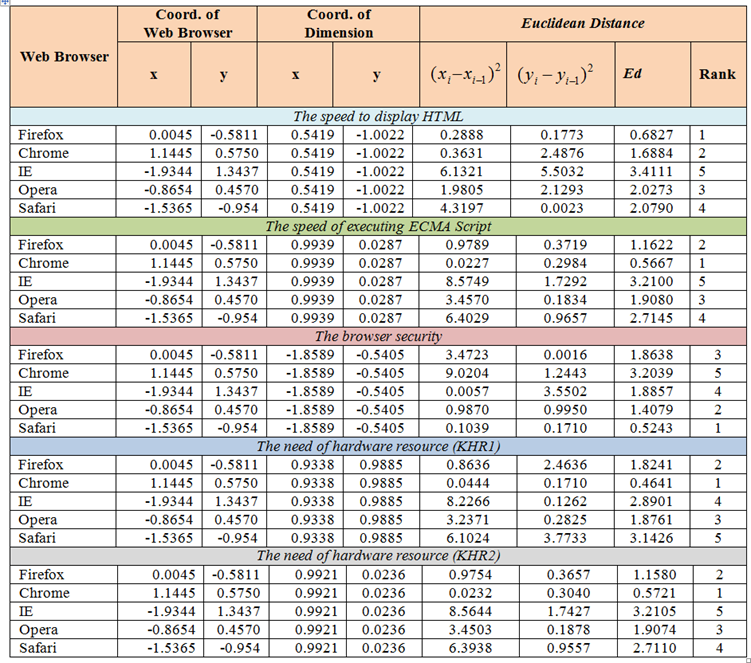
Internet users regards that speed of displaying the HTML is very important. The faster the HTML file displayed on the browser, the easier the users can get access to the information, entertainment, and surfing the web. This facts correspond with the Matamaya (Sopyani, 2012), which argue that the speed of displaying the HTML is one of dimension which consider as an advantage in the browser performance. To display the HTML faster every browser have their own unique system which can support the best performance.
As for the ECMA Script which is the official name for the Javascript (needed to access the media such as video and music) developed by ECMA. This dimension is required especially by the users who actively access the video and audio content. The faster one browser can display the content, the more content the user can access in certain time. Matamaya (Sopyani, 2012) explained that the speed to execute the ECMA Script is one of the important dimension if we are going to measure the browser performance. The result showed that Google Chrome has the advantage when executing the ECMA Script.
Desktop Browser merely a software run on computer to access the internet. As software, Browser also exposed to bugs. Browser with bugs can be used by the web developers or hackers to track and steal the user information. This is related with the security. This make the security as the next important thing a browser should consider. A good browser will have the high end security which can guarantee their users. They need to become immune to the virus and others hacking methods. Matamaya (Sopyani, 2012) argue that the security dimension is also important for internet users. The more secure the browser, the more advantage the browser has compare to their competitors. The result from the perceptual mapping showed that Safari is the browser with the highest security level.
Matamaya (Sopyani, 2012) regard the hardware consumption when installing the browser is also an important attribute to consider by the internet users. The more hardware consumption will decrease the positive perception of the browser. This measured by the used of the memory or storage for installation. User prefer browser which has less memory consumption. The less the better they said. The perceptual mapping showed that Safari is the browser with the lowest consumption. The other hardware consumption is related with the RAM. The more RAM needed mean that the browser will used up more power. This mean that it might hold up the browser performance. This can be saw when users use other program or open several browser tab at once. This practice will decrease the browser performance if they need a lot of RAM. Once again in this case, the less consumption the better. The result showed that Internet Explorer is the Browser with the least RAM requirement.
The next discussion will explore the general feature of the browser. This also become important because user need attractive and interactive browser (Limantara on Sopyani, 2012). This general feature also become the advantages for the browser. Several feature can be state here are Tabbed Browsing, Bookmark, Download Manager, Digital Certificate Verification, Session Manager, Ad Blocking, and Pop-up Blocking. These feature is continue to grow up and develop since the user expectation also increase. All five browser in the research have the general features but each of them have their own differences and advantages. Mozilla Firefox viewed as the most advance feature by the users followed by the Google Chrome and Opera.
Table 2 showed the overall browser performance according to the Indonesia Customer. It also tell us that Firefox is the best browser, followed by the Chrome, Internet Explorer, Opera, and Safari.
5. Conclusion and Further Research
From the discussion it clearly visible that Mozilla Firefox is the best browser in the category of HTML speed display. For this dimension, Safari, Opera, and Internet Explorer still left behind. The Firefox only has close competition from Google Chrome. The second attribute, the speed of executing the ECMA Script, Google Chrome thriumph as the best browser in the category. While Opera, Safari, and Internet Explorer is left too far behind, the Mozilla Firefox become the closest competitor for the Google Chrome. On the third attribute, the browser security, the Apple’s browser, Safari succeded to become the most trusted browser. The second place won by the Opera which beat Interent Explorer, Mozilla Firefox, and Google Chrome altogether. On the next attribute, the hardware consumption (KHR1), Safari once again win the contest followed by the Internet Explorer, then by the Opera, Mozilla Firefox, and Google Chrome. On the hardware resource consumption (KHR2), the Internet Explorer become the first choice of the Indonesia users. Safari took the second place, while Opera, Mozilla Firefox, and Google Chrome respectively follow. On the last attribute, the general feature, Mozilla Firefox regard as the best by the Indonesian users. The Chrome on the second place and followed by Opera, Safari, and Internet Explorer.
Based on the result, it is difficult to choose which one of the five browser which can fulfill the user expectation. Each have their advantages and disadvantages. That’s why we urge that the further research can be explore more about this. Further research also can be conducted based on the strategy from the developer when introducing their browser. This will help us to understand the positioning targeted by the company. The next research also can be conducted using new dimensions which then can help enhance the depth of the user perception analysis toward their preffered browser.