A Hybrid AHP–SAW Model for Evaluating Minimum Fare Equity in Online Transportation: A Multi-City Case Study from Indonesia
Abstract:
The rapid growth of online transportation in Indonesia has raised significant concerns regarding the fairness and transparency of fare structures. Current pricing mechanisms, often reliant on dynamic algorithms, frequently fail to incorporate key socio-economic and operational factors, leading to disparities between fare levels and local economic conditions. This study proposes a hybrid multi-criteria decision-making (MCDM) model to evaluate and recommend more equitable minimum fares. The model integrates the analytic hierarchy process (AHP) to objectively determine criterion weights and the simple additive weighting (SAW) method for robust alternative ranking. Four critical criteria are employed: online transport fare affordability, average travel time, the size of the available fleet, and private vehicle ownership. A case study applying this model was conducted across five major Indonesian cities: Jakarta, Surabaya, Palembang, Bandung, and Medan. The results indicate that Jakarta achieved the highest preference score (0.8661), followed by Surabaya, Palembang, Bandung, and Medan. The analysis identified travel time and fare affordability as the most influential criteria in determining fare equity, whereas private vehicle ownership had a comparatively minor impact. The fare recommendations generated by the model demonstrate a closer alignment with local socio-economic realities than existing fares. These findings provide valuable insights for regulators and service providers, supporting the development of more adaptive, transparent, and equitable fare policies that contribute to sustainable urban mobility.1. Introduction
Transportation plays a crucial role in supporting the social and economic life of modern society in the industrial era. Effective transportation facilitates the mobility of individuals from one place to another and contributes to economic growth and an improved quality of life. As more people move into cities and buy vehicles, serious problems such as traffic congestion, massive fuel consumption, and air pollution are getting worse [1]. This is why good public transportation is very important and is also a major value. Public transportation currently consists of various types, categorized by mode, comprising bus rapid transit (BRT), public transportation, taxis, long-distance trains, and modern transportation, including commuter trains (KRL), mass rapid transit (MRT), as well as light rail transit (LRT) [2].
Despite the essential role of public transportation, Indonesia continues to face structural challenges related to tariff consistency and transparency. Fare discrepancies frequently occur not only across different transportation modes, but also within the same mode operating in different regions [2]. Indonesia’s vast geographical span and heterogeneous regional characteristics contribute to substantial variations in operational costs, demand levels, and regulatory environments, resulting in differing fare structures from one area to another. However, the absence of standardized and transparent fare-setting mechanisms often creates uncertainty for both users and operators. This condition becomes particularly problematic for new transportation providers attempting to enter a specific region, as the unclear tariff framework limits their ability to establish competitive yet fair pricing strategies.
Recent developments in digital technology have been a factor affecting changes in the public transportation landscape in Indonesia, particularly since the advent of online transportation services such as Gojek, Grab, and Maxim. These services have quickly become an integral part of public mobility in various major cities, offering easy booking through apps, flexible time schedules, and convenient digital payment methods [2]. Independent study data shows that Indonesia is a large market for online transportation in Southeast Asia, with millions of trips taken daily. Besides facilitating travel access, online transportation also has the potential to help reduce congestion when incorporated with public transportation [3].
Public transportation, such as buses and trains, helps reduce traffic in cities because many people can ride together instead of using personal vehicles [1]. This saves time as well as fuel, and also helps keep the air cleaner and makes the city a healthier place to live [4].
The online transportation fare in Indonesia still faces various challenges despite its significant benefits. In general, fare policy is regulated by the Minister of Transportation Regulation Number 12 of 2019. This policy sets upper and lower fare limits for online motorcycle taxis in different areas [5]. However, daily fare determination is largely affected by the internal algorithm of the company, which considers the balance between supply and demand (supply-demand pricing) [6]. This often makes prices go up when many people need rides, particularly during rush hours or bad weather, which triggers complaints from users due to a lack of transparency in the calculation mechanism [7].
Many studies in Indonesia about online transportation fare only look at data from the platforms, such as travel distance, travel time, and the number of people who need a ride. This method does not consider external factors such as the income of people in the area, traffic density, how many cars are available, or the number of people with personal vehicles [8], [9]. Due to this reason, the fares do not often match real-life prices and may cause the drivers to be upset.
Previous studies considered only one factor to decide travel fare, but in Indonesia, travel costs were influenced by factors such as geography, economy, and society [10], [11]. As a result, the pricing system often does not match the expectations of people. When the process is allowed to continue, this can cause a problem for online transportation providers in the future.
This study forms a recommender system to help decide fair fares for online riders in Indonesia using the multi-criteria simple additive weighting (SAW). However, the main limitation of the SAW lies in its weighting process, which often relies solely on subjective judgment or simplistic assumptions. In order to improve the validity and objectivity of the model, the weighting is calculated through the analytic hierarchy process (AHP), making the total methodology of this study a combined multi-criteria AHP–SAW model. This approach enables a more rigorous and systematic determination of weights through pairwise comparisons and consistency verification [12], [13].
The criteria used in this model include online transportation affordability, vehicle travel time, how many cars are available, and vehicle ownership. The process is analyzed in different cities such as Jakarta, Bandung, Palembang, Medan, and Surabaya. The choice of these five cities reflects multiple considerations, encompassing traffic congestion, levels of urban development, and heterogeneity in socioeconomic conditions [14]. These contextual differences are likely to shape demand dynamics, price elasticity, and the purchasing capacity of online transportation users [15].
The analysis is expected to provide a theoretical contribution by incorporating various internal and external data in determining online transportation fare, considering socio-economic indicators of the Indonesian population. Furthermore, this study is expected to serve as a reference for regulators and service providers in formulating fairer, more transparent, adaptive, and realistic fare policies. By focusing on case studies in several cities in Indonesia, the analysis is expected to support the achievement of the Sustainable Development Goals (SDGs), specifically SDG 10 on reducing inequality, as well as SDG 11 on sustainable cities and communities, through the development of an inclusive and equitable public transportation ecosystem [16].
2. Literature Review
The chapter discusses the ideas and studies that help build a system to check online transportation fares. It initially explains how fares are decided, then shows how the system can recommend fair prices for public services, and finally describes the multi-criteria decision-making (MCDM) method used to make good decisions in complex situations. Related studies are discussed as the starting point for the analysis, and gaps that underlie the contributions are reviewed.
Fare determination on online transportation platforms is generally conducted using two main schemes, namely fixed pricing and dynamic pricing. These schemes can be used in various industrial sectors, including transportation, as follows [6].
(1) Fixed pricing
In this system, fare is calculated according to a base rate that remains relatively stable over a certain period. Fares are often calculated based on travel distance and time, considering the company policy or government regulations.
(2) Dynamic pricing
The system adjusts fares in real time based on market conditions, particularly the comparison between demand and car availability (supply). A popular implementation is a price increase, which includes a significant fare increment during periods of high demand, such as peak hours, rainy seasons, or major events.
As price increment is considered effective in boosting car availability when demand increases, this method has several drawbacks, which include the following [7].
1. Users do not often understand the process of fare increment, and this method is considered non- transparent to people.
2. The method does not consider how much low- income people can afford to pay, making it less fair for some groups [9].
3. This approach can result in higher rates in areas with limited transportation infrastructure, so the potential for regional discrimination is very high [17].
In Indonesia, the regulation on forming online motorcycle taxi fares is stipulated in the Minister of Transportation Regulation Number 12 of 2019, which divides operational areas into several zones with upper and lower fare limits [5]. However, implementation in the field is often adjusted by the algorithm of the company, as the regulation serves only as a baseline. This is often considered unfair to customers using online transportation [8], [9].
A recommender system is a tool that provides users with recommendations or the best options based on data analysis and specific preferences [18]. In public services, it supports decision-making by considering multiple factors or criteria, leading to more informed and organized decisions [19]. Examples include resource distribution, transportation route planning, and budget allocation.
The application of a recommender system in the transportation sector includes the following [20], [21].
1. Finding the fastest or most affordable route for users by considering traffic conditions and available vehicles.
2. Developing optimal transportation schedules to maximize operational and service efficiency.
3. Providing fair and socially appropriate fare recommendations by considering demand, available vehicles, and the unique characteristics of each community.
Conventional systems often overlook important aspects such as social dimension and fare fairness, while recommender systems can assist technical optimization, including minimizing costs or travel time [22]. As a result, the resulting decisions may be operationally efficient but less sensitive to the ability of the community to pay or the infrastructure conditions of a particular area.
This situation inspires the use of an MCDM method in an online transportation fare recommender system [23]. Using MCDM, various technical and socio-economic criteria can be analyzed simultaneously to produce more comprehensive, fair, and accountable recommendations.
MCDM is a decision-making framework used when multiple criteria need to be considered simultaneously [24]. The method is widely applied in various fields because it can incorporate quantitative and qualitative factors simultaneously to produce more comprehensive as well as objective decisions [25]. In the context of online transportation fare evaluation, MCDM enables policymakers to consider interrelated socio- economic, operational, and infrastructure factors [26].
Various MCDM methods have been widely used, including:
1. AHP: a hierarchical method that uses pairwise comparisons to determine criterion weights, complemented by a consistency test systematically.
2. SAW: a simple aggregation method that calculates a total value for alternatives based on normalized criterion weights and ratings.
As each method has its advantages, a literature review shows that no single MCDM method is universally superior. The selection of the method should be modified according to the characteristics of the problem, data availability, and decision-maker preferences [27].
This study uses a combination of AHP and SAW. AHP is used to determine criterion weights as it generates weights through pairwise comparisons and incorporates a consistency test using the Consistency Ratio (CR), increasing the validity of the results [28]. Subsequently, SAW is selected for the alternative ranking stage because the procedure is simple, easily traceable, and able to provide objective assessments based on predetermined criterion weights [29]. The AHP–SAW combination allows the incorporation of consistent, expert-judgement-based weighting with transparent ranking calculations.
The criteria selection in this study was conducted by amalgamating internal and external data, guaranteeing that the indicators utilized are both theoretically pertinent and reflective of the real conditions in Indonesia’s online transportation sector. Establishing these criteria is essential for the creation of the AHP–SAW model, since the efficacy of the recommended outcomes significantly relies on the extent to which the criteria include the fundamental aspects affecting minimum fare determination. Several criteria used in this study include:
1. Regional minimum wage
The regional minimum wage serves as a proxy for the purchasing power of the community in a region. Analysis of travel patterns of online transportation users in Yogyakarta shows that lower-income groups tend to use motorcycles for short, inexpensive trips. Consequently, higher-income groups use a wider variety of transportation modes for longer, more expensive trips [30]. This shows that income differences can affect online transportation mode preferences.
2. Vehicle travel time
Travel time reflects traffic conditions and affects vehicle operating costs (VOC). Rizki et al. [31] showed that travel time reliability significantly affected the frequency of online transportation use.
3. Number of online transportation fleets
Adequate fleet availability improves service and reduces waiting time, inspiring the use of online transportation [32].
4. Private vehicle ownership
The level of private vehicle ownership affects the dependence of the community on online transportation services. Wang et al. [33] found that regular or active users tended to own fewer private vehicles than occasional users. Therefore, as vehicle ownership increases, dependence on online transportation services decreases.
AHP is a decision-making method developed by Saaty [34] to determine criterion weights objectively through pairwise comparisons. The steps are as follows:
1. Constructing a Hierarchy: The problem is divided into levels: main objective (e.g., determining optimal fare), criteria (e.g., minimum wage, travel time, number of fleets, vehicle ownership), and alternatives (e.g., fares in different cities).
2. Pairwise Comparison Matrix: Each pair of criteria is compared using a scale of 1–9 [34]: 1 = equally important, 3 = slightly more important, 5 = more important, 7 = extremely more important, 9 = absolutely more important. Intermediate values (2, 4, 6, 8) refine comparisons.
3. Calculating Weights and Consistency Test: Eigenvector values are used as criterion weights. Consistency is checked using CI and CR:
| Matrix Size | RI |
|---|---|
| 1 | 0.00 |
| 2 | 0.00 |
| 3 | 0.58 |
| 4 | 0.90 |
| 5 | 1.12 |
| 6 | 1.24 |
| 7 | 1.32 |
| 8 | 1.41 |
| 9 | 1.45 |
| 10 | 1.49 |
where,
$\lambda \max$: the largest eigenvalue of the comparison matrix,
$n$: number of criteria,
CI: measures the consistency of the matrix (Consistency Index),
CR: measures the extent to which assessments are consistent compared to a random matrix (Consistency Ratio), and
RI: random index, the average CI value of a random matrix at the same size (as shown in Table 1). Table 1 shows RIs according to matrix size [35].
Interpretation:
CR $<$ 5% → the 3 $\times$ 3 matrix is accepted.
CR $<$ 9% → the 4 $\times$ 4 matrix is accepted.
CR $<$ 10% → the $>$ 4 $\times$ 4 matrix is accepted.
When the CR exceeds the limit, the matrix should be revised for a more consistent assessment.
SAW ranks alternatives by summing normalized values multiplied by criterion weights. The steps are:
1. Creating a decision matrix ($X$):
a. A decision matrix consists of alternatives (e.g., fare options for different cities) and criteria (e.g., minimum wage, travel time, number of fleets, vehicle ownership).
b. Each cell $x_{ij}$ represents the original value of alternative $i$ for criterion $j$.
c. Values can be:
i. Quantitative (e.g., minimum wage in currency, travel time in minutes).
ii. Qualitative, converted into numeric scores using a Likert scale or ranking system.
2. Normalizing the decision matrix:
Normalization ensures that all criteria are comparable on the same scale (0 to 1). Two formulas are used depending on the type of criterion:
For benefit criteria:
where,
$R_{ij}$: Normalized value of alternative $i$ for criterion $j$,
$x_{ij}$: Original value of alternative $i$ for criterion $j$,
$\max (x_j)$: Maximum value among all alternatives for criterion $j$, and
Meaning: Higher values are better (e.g., number of fleets, affordability). The alternative with the highest value gets normalized to 1.
For cost criteria:
where,
$R_{ij}$: Normalized value of alternative $i$ for criterion $j$,
$x_{ij}$: Original value of alternative $i$ for criterion $j$, and
$\min (x_j)$: Minimum value among all alternatives for criterion $j$.
Meaning: Lower values are better (e.g., travel time, fare amount). The alternative with the lowest value gets normalized to 1.
3. Value of Alternative Preferences ($V$)
The final stage in the SAW method is the computation of the Value of Alternative Preferences ($V$), which represents the overall score of each alternative based on all evaluated criteria. This value is obtained by summing the normalized scores that have been multiplied by their respective criterion weights. Through this process, the method integrates both the performance of each alternative on individual criteria and the relative importance of the criteria.
The preference value for each alternative is mathematically expressed as follows:
where,
$V_i$: Preference value of the $i$-th alternative,
$W_j$: Weight assigned to the $j$-th criterion, and
$R_{ij}$: Normalized value of alternative $i$ for criterion $j$.
Meaning: Higher values indicate a more preferred alternative. $V_i$ represents the overall preference score of alternative ($i$), obtained by multiplying each criterion's weight by the normalized value and summing the results.
The criterion weights $W_j$ are typically determined based on predefined priority levels, with the total weight satisfying $\sum W_j=1$. The computed value $V_i$ serves as the basis for ranking the alternatives. An alternative with a higher $V_i$ value is considered more favorable and thus represents the optimal choice within the decision-making context. By combining normalized performance scores and weighted importance, the SAW method facilitates an objective and systematic evaluation process, enabling the selection of the most suitable alternative from the available options.
A review of relevant previous studies is necessary to strengthen the foundation of the analysis. Several studies have been conducted on fare evaluation and online transportation service selection. This review provides a basis for identifying the strengths, limitations, and opportunities for developing a multi-criteria online transportation fare recommender model.
Jiao [36] examined the characteristics of Uber’s increment pricing during July 4, 2015, in Austin using data from the Developer API. The data included estimated trip fare, distance, waiting time, and surge multiplier for UberX, UberXL, and UberSelect. The analysis showed that July 4 experienced a significantly higher fare increment compared to other days. A simple regression analysis found that trip request time significantly affected the increment multiplier, while wait time showed no significant effect. This study confirmed that an increase in price occurred during special events with specific spatio-temporal patterns, and the underlying mechanisms remained unclear due to limited internal data.
Sun et al. [37] analyzed optimal fare determination strategies on ride-hailing platforms, considering trip details and driver location, as it focused on per-ride pricing. The optimal fare structure found consists of three main components, namely (1) a base fare based on travel distance (ride length-based fare), (2) a rush hour congestion fee, and (3) an emergency fee. The analysis shows that optimal fare tends to be lower than regular taxi fare when traffic conditions are good, profit expectations of drivers are low, and platform commissions are not high. However, platforms may charge higher fares than conventional taxis under certain conditions, such as rush hour or emergencies.
Saripudin [38] examined decision-making in selecting ride-hailing services in Indonesia using the AHP model with the help of Super Decisions software. The study focused on six criteria: performance, service, security, price, promotion, and branding, to determine the best alternative between Goride and Grabbike. Data were collected through online questionnaires from 100 respondents who actively use these services. The results indicated that security was the most important criterion (36.02%), followed by service (23.73%), price (16.36%), promotion (11.29%), performance (7.79%), and branding (4.81%). Among the alternatives, Grabbike ranked highest due to its competitive pricing and strong branding, while Gojek excelled in service quality. This study reinforces the applicability of AHP in evaluating multiple criteria for transportation service selection and highlights the importance of safety and service in user preferences.
Several previous studies on the evaluation and recommendation of online transportation fares have been conducted using various methods. However, most of these studies focus primarily on internal aspects, such as travel distance–based fare analysis, fare comparisons between platforms, or internal company operational data. Such an approach tends to produce partial analysis results and fails to capture the full complexity of real-world conditions. External variables, such as socioeconomic indicators, affordability, number of available fleets, and private vehicle ownership, are rarely incorporated, even though these factors significantly influence the dynamics of supply and demand in online transportation services. This condition highlights a clear research gap: the need to develop a fare recommendation system for online motorcycle taxis that accounts for a broader and more comprehensive set of criteria.
The present study addresses this gap by proposing a multi-criteria model that integrates both internal and external factors. The criteria include online transportation affordability, vehicle travel time as an indicator of service efficiency, the number of online transportation fleets as a proxy for provider capacity, and private vehicle ownership as a reflection of socioeconomic conditions. Furthermore, this study introduces a hybrid approach combining AHP for objective weighting and SAW for efficient ranking, thereby reducing subjectivity and ensuring methodological rigor. Data are processed using a cutoff mechanism instead of real-time updates, making the model suitable for policy-oriented and time-sensitive decision-making. Sampling from five major cities, Jakarta, Bandung, Palembang, Medan, and Surabaya, ensures data diversity and representativeness. By incorporating these innovations, this research offers a fairer, more adaptive, and sustainable solution for determining online transportation fares compared to previous works.
3. Proposed Method
This study used the Design Science Study Methodology (DSRM) method, which showed the development of artifacts as solutions to identified problems. The method was selected because it was suitable for studies focusing on information technology innovation based on real user needs. The DSRM used in this study consisted of the following stages (refer to Figure 1).

In the proposed Design Science Research Methodology (DSRM), two primary models were developed. The process begins with problem identification, which serves as the foundation for defining both the objectives and the solutions to be achieved through model development. The study produces two distinct models: a mathematical model that integrates the AHP and SAW, and an AI model utilizing Machine Learning techniques. Both models are constructed using data obtained from internal and external sources, enabling the development of solutions that are more accurate, credible, and applicable over time.
The main focus of this study lies in the development of the mathematical model, which is designed and implemented from Step 3 through Step 7 of the DSRM framework. The development process begins with the formulation of the SAW model, which determines the criteria to be incorporated into the subsequent AHP calculations. These two models are then integrated to produce a unified AHP–SAW mathematical model, as illustrated in Figure 2. This model constitutes the primary documented output of the first modeling component.
The second component focuses on the development of the AI-based model using Machine Learning, continuing the DSRM stages through Step 14. This model is built through a series of data-driven procedures, including data preparation, cleaning, Exploratory Data Analysis (EDA), training, testing, and evaluation. Multiple algorithms are compared to identify the most suitable single algorithm for the final model. Upon completion of the development process, the results of both models are documented and subsequently integrated into an AI-based Multi-Criteria Recommendation System, utilizing both the current criteria and future predictive values.
The initial stage of this study aimed to identify the challenges in determining online transportation fares in Indonesia, particularly in the context of traffic congestion in major cities such as Jakarta, Bandung, Palembang, Medan, and Surabaya. The identified problems include suboptimal fare setting due to limited data utilization (primarily relying on internal operator data) and insufficient consideration of external factors such as online transport fare affordability, the number of operating fleets, average travel time, and private vehicle ownership rates.
To address these issues, this study utilized historical data from the year 2024. The dataset was compiled using various official and credible sources, including statistical data from Indonesia’s Central Bureau of Statistics (BPS) [39], [40] for each respective region, local government regulations related to transportation and wage policies [41], [42], [43], [44], as well as traffic congestion and travel time data obtained from the TomTom Traffic Index [45], [46]. The use of historical data ensures consistency and uniformity across sources while adequately representing real-world conditions relevant to fare analysis.
This approach underscores the importance of relying on stable, validated, and comparable datasets when developing a fare policy recommendation model designed to support systematic and evidence-based decision-making.
At this stage, the main objective was formulated, namely to design an online transportation fare recommender system that considered various relevant criteria, making the resulting fare adaptive, fair, and potentially reducing congestion [22], [24]. This system was expected to produce online transportation fare recommendations for several large cities based on several selected criteria.
The artifact developed was fare recommender model according to the SAW method incorporated with the AHP. This incorporation was conducted to reduce the subjective weighting used in the method and to base the process on a scientific model. Moreover, the incorporation led to a new mathematical model, as shown in the following Figure 2.
The SAW method was first used to establish the criteria and construct the initial decision matrix. The AHP method was then applied to determine and validate the criterion weights through a consistency test. Finally, the SAW method was employed again to normalize the decision matrix and compute the alternative preference values.
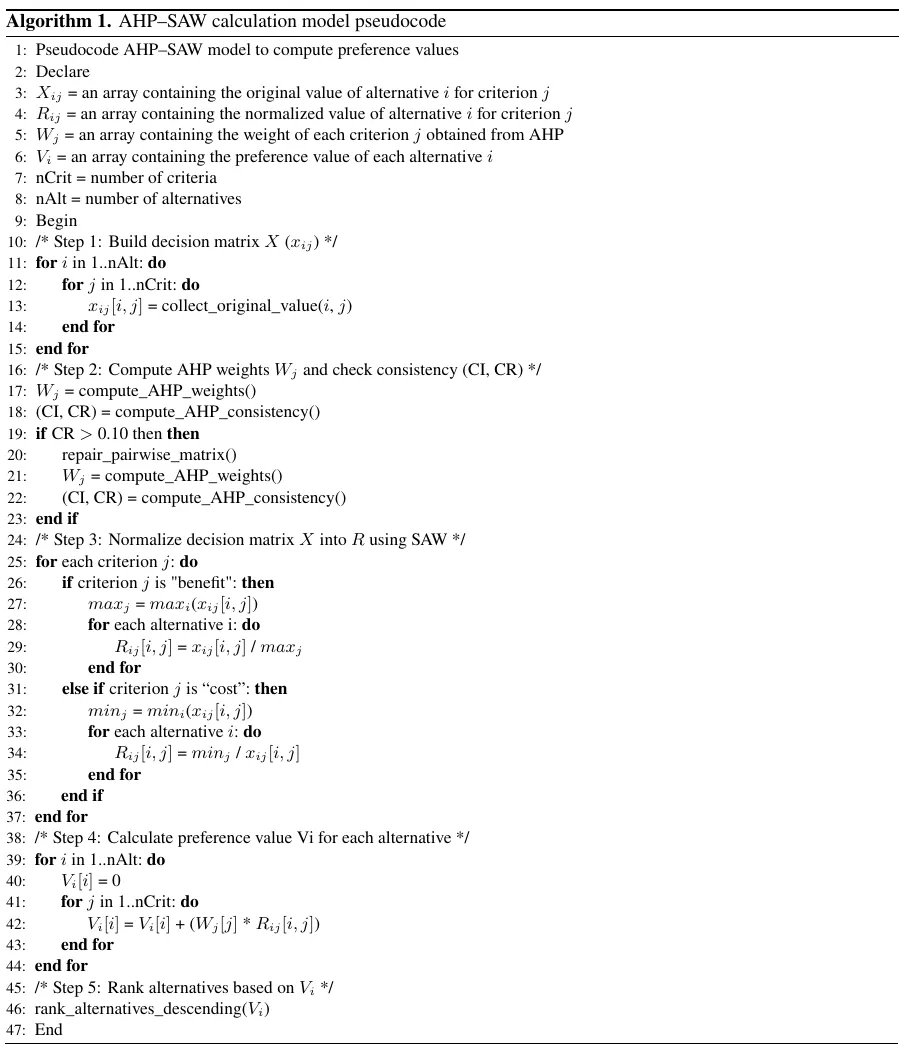
To enhance the clarity and reproducibility of the proposed AHP–SAW integration, the computational workflow is presented in the form of pseudocode. This pseudocode summarizes the complete sequence of operations carried out in the model, starting from the construction of the decision matrix by using SAW, the derivation and consistency validation of the AHP-based criterion weights, the SAW normalization procedure, and finally the calculation of the preference values for all alternatives.
4. Results and Discussion
The development of the AHP–SAW mathematical model begins with an initial stage derived from the SAW method, namely the identification of evaluation criteria and the determination of their respective value types. The criteria used in this study were based on external and internal data obtained.
1. Affordability of online transportation fare (C1) calculated by dividing the local Regional Minimum Wage (expressed in Indonesian Rupiah per month) by the minimum online transportation fare (expressed in Indonesian Rupiah per trip). This data was categorized as internal and external because the information was sourced from regulatory data and online transportation information providers.
2. Average travel time (C2), according to city traffic conditions, is approximately 10 kilometers per unit. This data was categorized as external data, referring to the city traffic data obtained.
3. Number of available online transportation fleets in a particular city (C3), based on external data obtained. This data was categorized as internal because the information originated from the online transportation providers.
4. The number of private vehicles owned in a city (C4), calculated per private vehicle, not per person. This data was categorized as external data sourced from population data in a city.
After establishing these four criteria, the corresponding alternative values were compiled for the five cities evaluated in this study: Jakarta, Bandung, Palembang, Medan, and Surabaya. All data for each criterion and each city were obtained from three authoritative sources: BPS, local government regulations, and the TomTom Traffic Index, using complete datasets from the year 2024, as elaborated in Section 3.1 Problem Identification and Motivation. The collected data were then structured into a 4 $\times$ 5 decision matrix, as presented in Table 2, which served as the foundational input for the subsequent AHP-based weighting process and the second-stage SAW normalization.
| Alternative | C1 (Benefit) | C2 (Cost, min/10 km) | C3 (Benefit) | C4 (Cost) |
|---|---|---|---|---|
| A1 | 526.16 | 1957 | 30000 | 2360000 |
| A2 | 471.14 | 1923 | 2000 | 3690000 |
| A3 | 459.70 | 1675 | 25000 | 1640000 |
| A4 | 590.68 | 1619 | 15350 | 3810000 |
| A5 | 513.98 | 1531 | 1000000 | 24356669 |
Determining the priority weight for each criterion started with compiling a pairwise comparison matrix, in accordance with the AHP methodology. This process aimed to measure the relative importance of one criterion to another. The comparative assessment was based on the results of study- based group discussions [47]. During the analysis, each assessment was then quantified using the Saaty fundamental scale with a value range of 1 (equal importance) to 9 (absolutely more important). The comprehensive results of the pairwise comparison were presented in matrix format in Table 3.
| Criterion | C1 | C2 | C3 | C4 |
|---|---|---|---|---|
| C1 | 1.0000 | 2.0000 | 3.0000 | 3.0000 |
| C2 | 0.5000 | 1.0000 | 3.0000 | 5.0000 |
| C3 | 0.3333 | 0.3333 | 1.0000 | 3.0000 |
| C4 | 0.3333 | 0.2000 | 0.3333 | 1.0000 |
The matrix in Table 3 showed the initial assessments of the decision-makers. Criterion C1 is rated as more important than C2 with an importance value of 2, and it is considered moderately more important than both C3 and C4 with importance values of 3. Criterion C2 is evaluated as less important than C1 (0.5) but equally important as C3 (1), while being strongly less important than C4 (0.2). Criterion C3 is judged as moderately more important than C2 (3) but moderately less important than C1 and C4 (0.3333). Finally, C4 is assessed as the most dominant among the lower-ranked criteria, being moderately more important than C2 and C3 (values 5 and 3, respectively). From this matrix, the next step was to calculate the final weights for each criterion and conduct consistency tests to validate the assessments.
The pairwise comparison matrix in Table 3 was normalized to determine the priority weights of each criterion. The results of the initial comparison matrix are presented in Table 4, while the normalization process and the calculated eigenvector (weight vector) are shown in Table 5.
| Criterion | C1 | C2 | C3 | C4 |
|---|---|---|---|---|
| C1 | 1.0000 | 2.0000 | 3.0000 | 3.0000 |
| C2 | 0.5000 | 1.0000 | 3.0000 | 5.0000 |
| C3 | 0.3333 | 0.3333 | 1.0000 | 3.0000 |
| C4 | 0.3333 | 0.2000 | 0.3333 | 1.0000 |
| Amount | 2.1667 | 3.5330 | 7.3330 | 12.0000 |
| Criterion | C1 | C2 | C3 | C4 | Amount of Rows | Weight ($\boldsymbol{W_j}$) |
|---|---|---|---|---|---|---|
| C1 | 0.4615 | 0.5660 | 0.4091 | 0.2500 | 1.6867 | 0.4216 |
| C2 | 0.2308 | 0.2830 | 0.4091 | 0.4167 | 1.3395 | 0.3348 |
| C3 | 0.1538 | 0.0943 | 0.1364 | 0.2500 | 0.6345 | 0.1586 |
| C4 | 0.1538 | 0.0566 | 0.0455 | 0.0833 | 0.3392 | 0.0848 |
| Total | 1.0000 |
1. Calculating the Maximum Eigenvalue ($\lambda$max)
2. Consistency Index Calculation (CI)
3. Consistency Ratio Calculation (CR)
With $n$ = 4 and Random Index (RI) value = 0.90,
The results showed a CR value of 0.0834, which is below the accepted threshold of 0.10. This indicates that the pairwise comparison matrix is consistent and that the judgments provided by the decision-makers are logically coherent. With the consistency requirement satisfied, the derived AHP weights are considered reliable and methodologically valid for use in the subsequent SAW calculations. These weights therefore serve as a sound and defensible foundation for the hybrid AHP–SAW model employed in this study.
The criteria weights used were:
C1 (online transport fare affordability) = 0.4216,
C2 (travel time per 10 km) = 0.3348,
C3 (number of online fleets) = 0.1586, and
C4 (number of private vehicles) = 0.0848.
The next stage during the process was the application of the SAW method. The initial decision matrix used in the analysis is shown in Table 6.
| Alternative | C1 | C2 | C3 | C4 | Total Preference Value ($\boldsymbol{V}$) | Ranking |
|---|---|---|---|---|---|---|
| A1 | 0.8908 | 0.7823 | 0.0300 | 0.6949 | 0.7012 | 4 |
| A2 | 0.7976 | 0.7962 | 0.0020 | 0.4444 | 0.6409 | 5 |
| A3 | 0.7782 | 0.9140 | 0.0250 | 1.0000 | 0.7230 | 3 |
| A4 | 1.0000 | 0.9456 | 0.0154 | 0.4304 | 0.7772 | 2 |
| A5 | 0.8701 | 1.0000 | 1.0000 | 0.0673 | 0.8661 | 1 |
The decision matrix was subsequently normalized, ensuring that each criterion was on a comparable scale. The normalization process was conducted based on the nature of the requirements (benefit or cost).
1. Online transport fare affordability (benefit)
2. Travel time (cost)
3. Online fleet (benefit)
4. Private vehicle (cost)
5. Preference value results ($V_i$)
Based on the calculations performed in the previous stage, preference values were obtained for each city alternative. The combined AHP–SAW method, using four main criteria, including online transport fare affordability (C1), travel time (C2), number of online fleets (C3), and number of private vehicles (C4), showed that Jakarta (A5) ranked first with the highest preference value of 0.8661. This result reflects Jakarta’s strong performance across the most influential criteria, particularly its competitive fare affordability (C1), the fastest travel time among all cities (C2), and the highest number of online fleets (C3).
Surabaya (A4) ranked second with a value of 0.7772, supported by consistently strong performance in both travel time and affordability, which together contributed significantly, given the relatively high weights of C1 and C2. Palembang (A3) ranked third with a value of 0.7230, primarily due to its advantage in having the lowest number of private vehicles (C4), which positively influenced congestion conditions, although its fleet availability remained limited.
The analysis showed that Bandung (A1) scored 0.7012, ranking fourth. Its performance benefited from relatively good fare affordability (C1), yet this advantage was offset by its higher number of private vehicles and moderate fleet availability. Medan (A2) ranked last with a value of 0.6409, influenced by its limited number of online fleets and relatively high density of private vehicles, which negatively impacted the performance across the weighted criteria.
The results confirmed that the online transport fare affordability (C1) and travel time (C2) were the two most dominant factors influencing the final ranking, consistent with their highest assigned weights (0.4216 and 0.3348, respectively). Although the number of online fleets (C3) and private vehicles (C4) had lower weights, these criteria remained relevant in distinguishing performance differences between cities, particularly those with contrasting levels of service availability and congestion. Therefore, the results of this study followed real conditions, where cities with a large online transportation fleet and a high minimum fare tended to rank higher in the analysis.
The results obtained during the analysis were preference values for each city alternative. These values served as a reference for setting the recommended minimum fare for a city, as shown in Table 7.
The recommended minimum fare in the table was based on Bandung’s actual minimum fare of IDR 8,000. Fare was also similar to the minimum fare in Medan, Palembang, and Surabaya, making it representative of nearly all available alternatives. The recommended minimum fare in the table was calculated by simply dividing the city preference value by the actual city preference value, then multiplying by the specific city’s actual minimum fare as a reference value. Based on this calculation, the model indicates that Medan’s recommended minimum fare is lower than its actual fare, while Palembang and Surabaya have recommended fares that are higher than the actual fare. In Jakarta’s case, the recommended minimum fare is slightly lower than the actual minimum fare of IDR 10,500. A similar trend was observed when the minimum fare reference was changed to IDR 10,500 for Jakarta, as shown in Table 8.
| City | Preference Value | Recommended Minimum Fare (IDR) | Actual Minimum Fare (IDR) |
|---|---|---|---|
| Jakarta | 0.8661 | 9880.56 | 10500.00 |
| Medan | 0.6409 | 7311.73 | 8000.00 |
| Palembang | 0.7230 | 8248.02 | 8000.00 |
| Surabaya | 0.7772 | 8866.99 | 8000.00 |
| City | Preference Value | Recommended Minimum Fare (IDR) | Actual Minimum Fare (IDR) |
|---|---|---|---|
| Bandung | 0.7012 | 8501.55 | 8000.00 |
| Medan | 0.6409 | 7770.13 | 8000.00 |
| Palembang | 0.7230 | 8765.12 | 8000.00 |
| Surabaya | 0.7772 | 9422.89 | 8000.00 |
When Jakarta’s actual minimum fare of IDR 10,500 was used as the reference value, the model showed that all other cities had recommended minimum fares lower than Jakarta’s benchmark. Based on the recalculation, Bandung’s recommended minimum fare was IDR 8,501.55, Medan’s was IDR 7,770.13, Palembang’s was IDR 8,765.12, and Surabaya’s was IDR 9,422.89. These results indicate that even when using Jakarta’s fare as the baseline, the recommended fares for all other cities remained below the reference value, reflecting their lower preference values relative to Jakarta.
The fare comparison was presented in a graph, making it easier to identify the differences between the actual and recommended minimum fare. The graph used in the analysis was shown in the following Figure 3 and Figure 4.
To validate the robustness of the proposed AHP–SAW model, a benchmark analysis was performed using the TOPSIS method with the same AHP-derived weight vector. TOPSIS produced the following closeness coefficients: Jakarta at 0.6666, Surabaya at 0.3632, Palembang at 0.3317, Bandung at 0.3288, and Medan at 0.2946. This ordering is identical to the ranking generated by the AHP–SAW model, confirming consistency in the directional interpretation of city performance. However, the TOPSIS results exhibit substantial score polarization, with Jakarta positioned far above the other alternatives and the remaining four cities clustered within a narrow interval of 0.29–0.36. Such compression suggests that TOPSIS is more sensitive to extreme criterion values, particularly the exceptionally high fleet count and private vehicle density in Jakarta, thus amplifying outliers rather than reflecting proportional multi-criteria interactions. Conversely, the AHP–SAW model yields a smoother and more discriminative preference distribution, aligning more closely with socio-economic reasoning and producing results that are more interpretable and fair for policy formulation. Hence, while TOPSIS confirms the relative order of alternatives, the AHP–SAW model provides a more balanced and policy-relevant assessment of minimum fare fairness.
This study showed the application of the developed AHP- SAW model across various cases. During the process, the mathematical model generated recommendations for minimum online fare for vehicles based on government-set references or specific regulations. The outcome showed that the results were both practical and adaptable to different criteria, as shown in studies [48-49]. This signifies that the rule- ranking method and pruning strategy in an adaptive rule model can improve the flexibility and efficiency of a cross-domain recommender system.
5. Conclusion
In conclusion, this study proposed and implemented an online transportation fare recommender model based on the AHP–SAW method. The results showed that Jakarta ranked first with the highest preference value, followed by Surabaya, Palembang, Bandung, and Medan. This outcome signified that online transport fare affordability and travel time were the dominant factors in determining fare fairness, while the number of online fleets and the number of private vehicles had less influence.
In practice, the developed AHP–SAW model produced minimum fare recommendations that were more representative than the actual applicable fare. Comparisons between preference values and existing fares showed significant deviations. This signified the importance of incorporating internal (operational) and external (socio-economic) data in formulating fairer, more transparent, and adaptive online transportation fare policies.
As a direct policy implication, regulators could utilize this multi-criteria framework to establish more localized and equitable minimum fares. For instance, instead of relying on a uniform zonal fare, policies could be adapted to better reflect each city's unique socio-economic profile, particularly its local wage levels and travel-time conditions. While this model provides a robust quantitative foundation, it is acknowledged that final policy determination must also integrate other complex qualitative and political considerations.
Future studies could expand the scope to five large cities and to mid-sized cities with varying socio-economic characteristics, inspiring more general as well as inclusive analysis results. The process should be recommended to add other, more varied criteria, such as population density, public transportation accessibility, or real-time user demand data for future studies. Furthermore, the incorporation of machine learning-based predictive methods could improve model accuracy in addressing the ever-changing dynamics of the online transportation market.
Conceptualization, E.H., W.M., and M.I.P.; methodology, E.H.; software, M.I.P. and F.R.S.; validation, W.M. and M.I.P.; formal analysis, E.H. and W.M.; investigation, W.M.; resources, E.H.; data curation, F.R.S.; writing—original draft preparation, E.H.; writing—review and editing, W.M. and M.I.P.; visualization, F.R.S.; supervision, E.H.; project administration, M.I.P.; funding acquisition, E.H. All authors have read and agreed to the published version of the manuscript.
The data used to support the findings of this study are available from the corresponding author upon request.
The authors declare that they have no conflicts of interest.