A Delphi-AHP Analysis to Identify Key Green Port Determinants for Dry Bulk Terminals: A Case Study of Lumut Port
Abstract:
As the volume of dry bulk and other cargo handles at ports rises, the question of guaranteeing sustainability of ports has developed into an essential subject globally. In Malaysia, green port initiatives were only introduced by the government in 2016. Therefore, limited research on green ports can be traced in the open literature. Compared to other cargo types, dry bulk cargo handling is regarded as one of the more demanding undertakings to the environment. Hence, the aim of this study is to ascertain the dry bulk terminals’ key green port performance determinants by using the Delphi method to identify the key determinants and Analytic Hierarchy Process (AHP) to quantitatively weigh the selected determinants, through a case study of Lumut Port. The main output of this study is a decision-making model that can be utilised to guide the efforts towards achieving a green port status by Lumut Port or other dry bulk terminals with similar characteristics. The research found that the cluster with the highest weightage is the Water Pollution Management Cluster (WPM), followed by the Environmental Awareness and Training cluster and the Air Pollution Management cluster. These three clusters presented 57.14% of the total weightage in achieving a green port status, which is worthy to be given serious consideration.
1. Introduction
International trade is mostly conveyed by ships and handled through various seaports across the globe. As seaports attempt to improve their capacity and efficiency in response to the continuous increase in vessel size and volume of cargo, environmental issues may have been given the least priority resulting in unsustainable seaport operations in the long run. As activities in the seaport continue to grow, the question of the ways and means to achieve an enduring sustainability of seaports have grown into an imperative agenda internationally. In response to the ecological and sustainability challenges, a number of developed nations have taken individual initiatives to introduce policies and legislation concerning green or sustainable ports in their countries since 1994 [1], [2], [3]. However, preliminary steps towards developing a green port policy in Malaysia only started at the end of 2016 with an emphasis on three elements, namely the environment, community engagement, and sustainability [4]. It involves initiatives such as the management of ballast water, identifying the fuel quality of ships in ports and the surrounding environment, and green initiatives involving the saving of fuel, energy, and electricity [5]. Additionally, green initiatives have been recognized as one of the four action plans to support the Logistics and Trade Facilitation Masterplan under Strategic Shift No. 5 that involves Internationalising Logistics Services since 2015 [6]. However, coordination efforts at the ministerial or national level to ensure ports work on green initiatives are still minimal [7].
Moreover, most research on green port that started to gain momentum since 2010, has focussed on ports in general. As seaports and terminals are differentiated into specialisations such as general cargo, container, roll-on/roll-off (RORO), liquid bulk, passenger, and dry bulk, it is imperative for the authorities and terminal operators to establish suitable guidelines and required actions to be acknowledged as green ports. Failure to ensure sustainable management of the seaports, which is part of the global marine eco-system poses significant risk that will expedite rising sea level and may incur annual coastal protection costs of between 200 billion USD to 1 trillion USD by year 2100 [8].
The aim of this study is to develop a decision-making model comprising of key green port performance determinants for dry bulk terminals through a case study on the dry bulk terminals in Lumut using the Delphi and Analytic Hierarchy Process (AHP) approaches. The Delphi technique has the ability to solicit qualitative judgments from expert respondents, whilst the AHP is able to provide weightage to the qualitative judgments identified in the Delphi process [9], [10]. It is expected that this effort could assist the seaport operators handling dry bulk cargo and the relevant regulatory authorities to identify and concentrate on the significant green determinants that can deliver a greater impact on their ports’ sustainability. This study is important for people in the maritime industry especially the port sector, surrounding community, students and government agencies, to understand the important determinants and their potential effectiveness towards the achievement of a green and sustainable port. The research questions developed to guide this study are:
$\bullet$ What are the key green port determinants for dry bulk terminals in Lumut?
$\bullet$ How decisive are the key green port determinants within the formulated decision making model for green dry bulk terminal?
Additionally, it is hoped that this research will benefit the relevant organisations and agencies in providing a clear understanding of the factors involved in ensuring an environmentally friendly port operation especially those involving dry bulk terminals. This study is focused on four dry bulk terminals situated in Lumut area that handle iron ore, coal, grain, and limestone, which characterise other dry bulk terminals in Malaysia and the sub-region of Southeast Asia based on the cargo variety involved. Nonetheless, the respondents selected are not limited to experts employed within those terminals. Other respondents include related government agencies, ship officers who frequented the ports, port contractors and researchers with suitable experience.
Lumut is a coastal town situated on the eastern shore of the Straits of Melaka. Its geographical location is as per Figure 1. The ports in Lumut are divided into Lumut Maritime Terminal Private Limited (LMTSB), which operates two terminals i.e. Lekir Bulk Terminal (LBT) and Lumut Maritime Terminal (LMT) that could handle up to 4.7 million metric tons (mt) of cargo annually [11]. Besides Lumut Port, another terminal, which specialises in iron ore handling is operated by Vale Malaysia Minerals (VMM). VMM is a subsidiary of Vale International and has the capacity to handle and distribute 30 million mt of iron ore throughout the Asia Pacific region annually [12]. Another private terminal owned by Malayan Flour Mill (MFM), which together with its sister terminal in Pasir Gudang, Malaysia handles about 660,000 mt of grain annually added to the variety of dry bulk cargo handled by dry bulk terminals in Lumut [13].

2. Literature Review
The World Bank [14] defines green ports as infrastructure and operational measures ports can adopt to reduce their energy and resource consumption with minimum environmental impacts. Additionally, through the review of earlier green port research, Lin et al. [15] espouse green ports as ports with an ecologically healthy environment, reasonable resources consumption, low energy utilisation, and pollution reduction involving an organic combination of environmental protection, port development and efficient resource utilisation. Mahmud et al. [2], surmise that although green port and sustainable port are used interdependently in contemporary literature, sustainable port focuses on the environmental, economic, and social perspectives of port operations, whilst green port protects the environment using eco-friendly procedures to lessen its negative impacts to the immediate environment.
Port operations produce many negative impacts, which arise in multiple forms such as pollution, health deterioration of the surrounding population, and degradation of the environment. As seaports normally operate on a continuous basis, they are largely mindful of the effluence that is released into the surrounding environment [16], [17]. Accordingly, ports are compelled to tackle the adverse ecological and social consequences of their operations and expansion [2], [18]. Therefore, the green port concept, which was officially introduced at the United Nations Climate Change Conference 2009 advocates seaports and terminals to reduce or eliminate harm to the environment that will contribute to the improvement in the port’s efficiency [19], [20].
These positive outcomes will in due course improve employees’ healthiness and social stability, besides ensuring sustainable economic development. In achieving a green status, the seaport needs to abide by the recommended determinants and gauge its green performance based on its compliance with these determinants. These adverse effects can be alleviated by applying the concept of the green port that uses technologies and systems, which inhibit environmental contamination and make possible the elimination of the adverse effect of port activities on the surrounding environment. In their efforts to transform into a sustainable entity, the attitude towards such transformation is normally positive among the management team. However, for various reasons not all port managers actively implement the green transformation, partly due to their unawareness of the green initiatives [16].
Generally, most port equipment is not energy efficient and does not provide for the protection of the environment and sustainable development due to their outdated energy consumption measurement technology [21]. It has also been argued that smaller ports due to their small size, have limited clean energy production capacity, which are normally carried out among others, through the installation of solar panels, hydropower generating water turbines and wind turbines [22], [23], [24]. The preceding equipment are normally installed to replace the consumption of fossil fuel with eco-friendly technology but requires plenty of space [23]. Additionally, the efforts need to be complemented with suitable policy, incentives and the necessary management systems that will lead to operational efficiency [2].
Business practices with new information on energy utilisation can be augmented by energy and environmental management systems and permit stakeholders to appreciate their processes and activities better [25], [26]. The development of green ports can be inhibited by the scarceness of resources, as seaports require more resources for their growth and improvement. According to Marzantowicz and Dembiñska [27], the sustainable port concept logically utilises natural resources from its surroundings. Consequently, the green ports development is advantageous to the future health of the surrounding environmental resources. Additionally, environmental planning is imperative in ensuring in what way sustainable seaports are constructed and operated [3]. Therefore, it is imperative for individual ports to have their own guideline on the measures required for them to fulfil the green port requirements.
As highlighted in the introduction, most research on green port that started to gain momentum since 2010, has focussed on ports in general [3], [15]. As seaports and terminals are differentiated into various specialisations, it is imperative for the authorities and terminal operators to establish suitable guidelines to be able to identify and implement the required actions for their specialised terminals. Therefore, this study is expected to fill up the research gap concerning green port research that specialises on dry bulk terminals.
3. Methodology
By employing a mixed-method approach, the methodology for this study comprised the process of collecting qualitative data to discover the phenomenon, which is the requirements to become a green bulk terminal. The collation of qualitative data was conducted through content analysis of the recent literature and qualitative feedback during the first round Delphi survey. The Delphi is a technique that emphasises the anonymity of the participants and permits them to express their opinions without any constraint. Another characteristic of Delphi is iteration, which allows participants to make adjustment on their views in response to the feedback given on the group's aggregate performance from round to round. It also requires controlled feedback to be given to inform the participants of the other participants’ perspectives in aggregate form. The last characteristic of Delphi is the statistical aggregation of group feedback, which allows for quantitative examination and data interpretation [28], [29]. A second round Delphi was performed to facilitate for the attainment of unanimity amongst participating respondents and to ascertain the significance for the determinants selected in the first round Delphi by means of a seven-point Likert scale.
To kickstart the research, qualified employees of the Lumut Port’s four terminals, port users (PU), staff of regulating agencies (RA), as well as researchers (R) were identified. Due to the flexibility in determining the sample size and the difficulty in assembling the expert respondents at an appropriate time, the Delphi technique is considered suitable to be utilised to gather the judgments from the experts in this research [28]. In order to qualify for the Delphi study, respondents must have at least 5 years of experience at supervisory level or higher. Through the articulated guidelines, 40 prospective respondents were initially requested to partake in this study. Nonetheless, only 24 experts have contributed in the two rounds of Delphi survey. A sample size of between 20 and 30 is acceptable in Delphi survey since the respondents are subject matter experts and is enough to provide a moderate replicability [30]. The itemization of the Delphi participants is as per Table 1.
| Organisation | LMTSB | VM | MFM | PU | RA | R | Total |
|---|---|---|---|---|---|---|---|
| Invited | 10 | 7 | 6 | 3 | 10 | 4 | 40 |
| Responded | 7 | 5 | 3 | 3 | 4 | 2 | 24 |
In order to shorten the process of the Delphi survey, a modified Delphi technique was utilised. A modified Delphi is the same to the original Delphi in terms of procedure to arrive at a consensus [29]. The slight different involves beginning the Delphi process with a set of carefully chosen elements to furnish the respondents with available information from earlier studies. In the context of this research, a qualitative content analysis was carried out by the researchers to identify the important green port determinants that have been identified in earlier research. These determinants were then included in the survey, where respondents were requested to provide their judgments on the significance of the determinants by means of a 7-point Likert Scale. Additionally, respondents were also requested to identify other determinants that have not been listed in the Delphi questionnaire.
Subsequently, in developing a decision-making model and providing a weightage for each determinant (D), the shortlisted determinants through the Delphi survey and their clusters were included in an AHP pairwise comparison process. The AHP is a type of multi-criteria decision analysis developed by T. L. Saaty in 1980. It is a method that uses a hierarchical model having a level of goal, criteria, sub-criteria, and alternatives [9]. It is arguably one of the most utilised instruments to address unstructured and complicated problems. The strong point of the AHP method is its capability to rank alternatives or choices, based on their effectiveness in satisfying differing objectives involving both tangible and intangible criteria. This can be done by allocating a necessary weightage to the factors or variables involved based on their relative importance [31]. Another forte of the AHP is its ability to notice inconsistent judgments through the various methods introduced by Saaty and other authors [32], [33]. However, the requirement for the judgments to be consistent, especially when it involves pair-wise comparisons involving more than five variables may become one of the significant weaknesses of the AHP [34], [35]. Saaty considers it to be a tolerable error in measurement when the extent of the error is equal or lower than 10 percent, or in AHP terms when the Consistency Ratio (CR) is equal to or less than 0.1 [32]. However, in many examples, Saaty and other authors have tolerated a CR of between 0.1 to 0.2 especially when the comparison involves five or more variables or matrices, but not more than 0.2 [36], [37], [38].
In this study, after the AHP questionnaire was successfully pilot tested, it was disseminated to the same 24 respondents that have participated in the two rounds of Delphi survey. However, only 22 respondents participated before the given dateline, which is considered adequate. There is no minimum sample size for AHP, but [39] argue that a minimum sample size of 8 will ensure a more comprehensive perspective and improve the results reliability [39]. The breakdown of the respondents is as per Table 2.
| Organisation | LMTSB | VM | MFM | PU | RA | R | Total |
|---|---|---|---|---|---|---|---|
| Invited | 7 | 5 | 3 | 3 | 4 | 2 | 24 |
| Responded | 7 | 5 | 3 | 3 | 4 | 0 | 22 |
4. Results and Discussion
The findings of the Delphi survey have introduced 9 new determinants for the green port to the proposed 49 determinants that were obtained through a content analysis of the available literature. All the 58 determinants have been grouped under 13 clusters as per Figure 2.
Briefly, Cluster I consists of nine determinants, Cluster II with 15 determinants and Cluster III with 18 determinants. Clusters IV, V, VI, VII, and VIII comprise two, three, three, five, and two determinants respectively. Additionally, Clusters IX and X comprise five determinants each, Cluster XI with three determinants followed by two determinants for Cluster XII. Only Cluster XIII is comprised of a single determinant.
All the original clusters and their determinants shortlisted in Round 1, were forwarded for re-evaluation by similar expert respondents in Round 2 Delphi. The median score for each determinant was included as part of controlled feedback and respondents were permitted to modify their decisions if desired. In order to be incorporated into the decision-making model, a mean score of between 6 (Important) and 7 (Very Important) must be achieved by the determinant. Based on the feedback received, 27 determinants were selected and grouped into seven clusters as listed in Appendix. This was a reduction from an earlier 49 determinants and 13 clusters, which has enabled for subsequent AHP pair-wise comparisons.
Between the seven clusters, the “Water Pollution Management Cluster (WPM)” is the most important cluster selected by the respondents. The five determinants in the cluster obtained an average rating of 6.57 on a 7-point Likert scale. Besides the determinants under the preceding cluster, other determinants that were highly rated are “reduction of air pollution from toxic gas from ships” that scored 6.52 points, “hazardous cargo management” with 6.48 mean score, and “efficient planning and port development” with a similar 6.48 score. The next three important determinants are “solid waste management” (6.44), “development of awareness among workers” (6.40) and “recycling of waste, garbage, and resources” with 6.36 mean score on a 7-point Likert scale [10].
The AHP questionnaire that was administered online using Google Forms were divided into 8 pairwise comparisons involving comparisons of determinants within each of the seven clusters and a comparison between the clusters. The challenges of the AHP process were to ensure high consistency with a CR of not more than 0.2. Due to these reasons, some respondents were requested to re-look into the earlier judgment and make some modifications using the recommendation given by an online AHP software as a guideline. The research team was very fortunate that all the respondents involved had given their fullest cooperation. The AHP software used was developed by study [40] and its accuracy was successfully tested by comparison with manual calculations before usage. The outcome of each comparison is attached in Appendix. The overall result of AHP pairwise comparisons is as per Table 3 and Figure 3. The global weightage (GW) identified will help users to determine the determinants that can provide higher impacts to the achievement of green port when implemented. GW is the outcome of internal weightage (IW) multiply by weightage (W) for its cluster. Additionally, the internal ranking (IR) is the ranking of the determinant within its cluster, whilst the global ranking (GR) is the overall ranking of the determinant.
Cluster | W | CR | D | IW | IR | GW | GR |
|---|---|---|---|---|---|---|---|
APM | 0.1605 | 0.11 | 1 | 0.4127 | 1 | 0.0662 | 3 |
2 | 0.3123 | 2 | 0.0501 | 7 | |||
3 | 0.2768 | 3 | 0.0444 | 9 | |||
WPM | 0.23 | 0.12 | 4 | 0.2559 | 2 | 0.0589 | 5 |
5 | 0.3109 | 1 | 0.0715 | 1 | |||
6 | 0.1832 | 3 | 0.0421 | 11 | |||
7 | 0.0877 | 5 | 0.0202 | 22 | |||
8 | 0.1636 | 4 | 0.0376 | 12 | |||
CPMLSS | 0.113 | 0.08 | 9 | 0.2636 | 2 | 0.0303 | 15 |
10 | 0.1750 | 3 | 0.0201 | 23 | |||
11 | 0.1732 | 4 | 0.0199 | 24 | |||
12 | 0.3668 | 1 | 0.0422 | 10 | |||
RCWG | 0.097 | 0.10 | 13 | 0.4617 | 1 | 0.0448 | 8 |
14 | 0.2818 | 2 | 0.0273 | 19 | |||
15 | 0.2563 | 3 | 0.0249 | 20 | |||
EMCR | 0.1041 | 0.12 | 16 | 0.3005 | 1 | 0.0313 | 13 |
17 | 0.2077 | 2 | 0.0216 | 21 | |||
18 | 0.1913 | 3 | 0.0199 | 24 | |||
19 | 0.1170 | 5 | 0.0122 | 27 | |||
20 | 0.1836 | 4 | 0.0191 | 26 | |||
EPDO | 0.1182 | 0.06 | 21 | 0.2506 | 3 | 0.0296 | 17 |
22 | 0.2627 | 1 | 0.0311 | 14 | |||
23 | 0.2511 | 2 | 0.0297 | 16 | |||
24 | 0.2356 | 4 | 0.0278 | 18 | |||
EAT | 0.1809 | 0.12 | 25 | 0.3348 | 2 | 0.0606 | 4 |
26 | 0.3854 | 1 | 0.0697 | 2 | |||
27 | 0.2797 | 3 | 0.0506 | 6 |
Based on the overall judgments presented in Table 3, the cluster with the highest weightage is WPM with a score of 0.23, followed by Environmental Awareness and Training (EAT) with a score of 0.1809. Air Pollution Management (APM) cluster with 0.1605 points lies third in the ranking. These three clusters presented 57.14% of the total weightage in achieving a green port status, which can be considered as worthy to be given serious consideration due to the limited resources that may be experienced by some of the dry bulk terminals. Eight of the top ten determinants also come from these three clusters. Other clusters involved are Conservation and Preservation of Marine Life, Soil & Sediment (CPMLSS), Recycling of Solid Waste and Garbage (RSWG), Effective Management, Cooperation and Regulations (EMCR), and Efficient Port Development and Operations (EPDO).
In addition to the eight determinants, “solid waste management” ranked eight with 0.0448 points and “monitoring and periodical analysis on activities that may affect port ecosystem” ranked at number ten with 0.0422 points can also be included in the priority list together with the top three clusters. Together, the determinants in WPM, EAT and APM clusters plus 2 additional determinants discussed in the preceding sentence present a weightage of 65.84% of the total weightage. Therefore, by implementing the 10 determinants in Clusters I, II, and VII and two additional determinants as discussed, it will be able to assist the dry bulk terminals to be more environmentally sustainable at a relatively low cost. Therefore, the decision-making model that is proposed in Figure B1 in Appendix can be utilised by the dry bulk terminals of Lumut port and other terminals with similar characteristics. The decision-making model comprises of 7 clusters with their respective weightages and 27 determinants with their respective GW.
From Table 3 and Figure 3, it can be visualised that WPM is the most dominant cluster, followed by EAT and APM. The three clusters together formed a total weightage of 0.5714 or 57.14%. Therefore, implementing the determinants inside these clusters will arguably result in a significant impact towards the attainment of a green port status.
The reliability of AHP model is demonstrated in the lower CR permitted in the AHP pair-wise comparisons [41], while a sensitivity analysis by reducing the IW of the top 10 determinants by 2 percent and 5 percent was carried out to test the robustness of the decision making model. At 2% reduction, 7 determinants continue to remain at their original GR and 3 determinants that are ranked 6, 8 and 10 are relegated only one rank lower. Additionally, when a 5% reduction is imposed on the IW, only determinants ranked 3, 5, 7 and 9 retained their positions, while 6 other determinants are relegated one rank lower. In both simulations, 9 of the top 10 determinants continue to remain in the top 10 rankings, which demonstrates the robustness of the model [42]. The simulations data are tabulated in Table 4. The determinants that retained their GR despite the 2% and 5% reductions of IW are highlighted in bold.
GR | D | GW | GW (IW-2%) | GW (IW-5%) |
|---|---|---|---|---|
1 | 5 | 0.0715 | 0.0701 | 0.0679 |
2 | 26 | 0.0697 | 0.0681 | 0.0657 |
3 | 1 | 0.0662 | 0.0649 | 0.0627 |
4 | 25 | 0.0606 | 0.0594 | 0.0573 |
5 | 4 | 0.0589 | 0.0577 | 0.0559 |
6 | 27 | 0.0506 | 0.0496 | 0.0478 |
7 | 2 | 0.0501 | 0.0491 | 0.0475 |
8 | 13 | 0.0448 | 0.0439 | 0.0439 |
9 | 3 | 0.0444 | 0.0435 | 0.0432 |
10 | 12 | 0.0422 | 0.0406 | 0.0383 |
11 | 6 | 0.0421 | - | - |
12 | 8 | 0.0376 | - | - |
In comparing the outcomes of the Delphi survey with top ten environmental priorities given by European Ports in 2021, similarities with six determinants chosen through the European Sea Port Organization’s (ESPO) survey can be identified. Although the determinants have not been labeled with similar names, they arguably encompass similar activities. They are “Air Quality”, “Climate Change”, “Water Quality”, “Ship Waste”, “Port Development” (land-related), and “Garbage/Port Waste” [10], [39]. Four other important determinants selected by ESPO i.e., “Energy Efficiency”, “Noise”, “Relationship with the local community”, and “Dredging Operations” are also identified by the Delphi respondents as among the 27 important green port determinants [39].
Similarly, the outcomes from the AHP pair-wise comparisons have also highlighted similar findings with the Delphi by highlighting through its top ten determinants i.e.—Enforcements of Oil Control Measures” and “Preventing Ship Bilge Discharge” that contribute to ESPO’s “Water Quality” determinant. Additionally, “Dust Pollutant Control”, “Reduction of Air Pollution from Toxic Gas from Ship” and “Frequent Dust and Area Cleaning” contribute to the ESPO’s “Air Quality” and “Climate Change” determinants. Finally, “Solid Waste Management” is a major component to the ESPO’s “Garbage/Port Waste Management”. The high similarities between both Delphi survey and AHP pair-wise comparisons with ESPO findings provide a construct validity to these research outcomes [43]. The differences in the priorities are likely due to the emphasis of this study, which focuses on dry bulk terminals as compared to multiple types of terminals in the ESPO survey. The differing priorities between developed Europe and developing Southeast Asia is another important reason. This can be seen in three of the top ten determinants generated through the AHP, which are “Development of Awareness Among Workers”, “Port Staff Training”, and “Community Awareness Promotion and Education”, which may not be on the top agenda in developed economies like Europe compared to developing economies like Southeast Asia. The changing of priorities among the respondents also happened in Europe as witnessed through the nine ESPO surveys conducted from 1996 to 2021 [26].
5. Conclusions
In retrospect, this study has successfully employed a combined method of Delphi and AHP to identify the key determinants that need to be observed in order to ensure the achievement of a green dry bulk terminal in Lumut Port. In achieving the first Research Question, the Delphi technique was used to identify 27 key determinants from a total of 49 determinants identified through the literature review and Round 1 Delphi survey. The 27 determinants placed under 7 clusters were subsequently evaluated through the AHP pair-wise comparisons technique. Based on the outcome of the pair-wise comparisons, global weights have been allocated to all determinants as presented in the Decision-Making Model to achieve Green Dry Bulk Terminal in Figure B1 at Appendix. Seaport terminals with limited resources may focus on the determinants under the WPM, EAT and APM clusters. In addition, two additional determinants, namely “solid waste management” and “monitoring and periodical analysis on activities affecting port ecosystem” can be considered, since they can arguably provide a significant impact towards the achievement of a green dry bulk terminal. The preceding findings support the second Research Question as mentioned in the Introduction part. Determinants from six out of the seven clusters shortlisted in this research have similarities with the findings of the ESPO survey in 2021, which provide a construct validity to this research. Whilst the research is focused on the dry bulk terminals in Lumut, the decision-making model may arguably be used as a guideline to other ports that handle the same cargo within a similar geographical environment.
Academically, this study contributes to the dearth of literature on green ports that focuses on the handling of dry bulk cargo at dry bulk terminals, which is the novelty of this research. In comparison, earlier literature has mostly focused their studies on green port in general rather than on specialised terminals. For policy makers, it helps to emphasise that the green port determinants for various terminals may differ depending on their types. As for the industry, the outcome of this study will provide guidelines to terminal operators and port authorities in selecting the determinants with a greater impact in case of budget constraint.
Due to the limitation in the scope of this study, the findings of this study only provide actionable recommendations for enhancing green performance of dry bulk terminals at Lumut Port and other ports with similar characteristics. These include the development of customised decision-making model, the adoption of innovative technologies, improvements in operational processes, and strategies for stakeholder engagement. In order to further generalise the findings of this study, similar studies on other dry bulk terminals in Malaysia and neighbouring countries are strongly recommended.
Conceptualization: A.M.A and A.Z.; methodology: A.M.A, A.Z., and R.M.H; analysis: A.M.A, A.Z., and N.S.F.A.R.; investigation: A.M.A, A.Z., and I.C.I; data curation: A.M.A., A.Z., and I.C.I.; writing—original draft: A.M.A and A.Z; writing—review and editing: A.M.A, N.S.F.A.R., and R.M.H.; visualization: A.M.A. and A.Z; project administration: A.M.A.; funding acquisition: A.M.A. All authors have read the published version of the manuscript.
The data used to support the research findings are available from the corresponding author upon request.
The authors are immensely grateful for the financial support provided by the Ministry of Higher Education under the Fundamental Research Grant Scheme (FRGS), which made this research possible. The authors would like to extend their gratitude to all those who contributed to this study, providing invaluable insights and data that were essential for the AHP analysis. Additionally, we wish to acknowledge the unwavering support and resources provided by Universiti Kuala Lumpur (UniKL) in fostering an environment conducive to academic excellence.
The authors declare no conflict of interest.
AHP | Analytic Hierarchy Process |
APM | Air Pollution Management |
APSN | APEC Port Services Network |
CR | Consistency Ratio |
CPMLSS | Conservation and Preservation of Marine Life, Soil & Sediment |
EAT | Environmental Awareness and Training |
EMCR | Effective Management, Cooperation & Regulations |
EMS | Environmental Management System |
EPDO | Efficient Port Development & Operations |
ESPO | European Sea Ports Organisation |
FRGS | Fundamental Research Grant Scheme |
ISO | International Organization for Standardization |
LBT | Lekir Bulk Terminal |
LMT | Lumut Maritime Terminal |
LMTSB | Lumut Maritime Terminal Sdn. Bhd. |
Mt | Metric tons |
RCWG | Recycling of Solid Waste and Garbage |
RORO | Roll-on/Roll-off |
UNESCAP/ESCAP | United Nations Economic and Social Commission for Asia and the Pacific |
USD | United States Dollar |
VMM | Vale Malaysia Minerals |
WPM | Water Pollution Management |
Table A1. Air pollution management
Factors (No.) | Total Score | Internal Weightage |
Dust Pollutant Control (1) | 9.08 | 0.4126 |
Reduction of Air Pollution from Toxic Gas from Ships (2) | 6.84 | 0.3110 |
Frequent Dust Removal and Area Cleaning (3) | 6.08 | 0.2764 |
Total | 1.0000 | |
CR | 0.11 | |
Table A2. Water pollution management
Factors (No.) | Total Score | Internal Weightage |
Preventing Ship Bilge Discharge (4) | 5.63 | 0.2559 |
Enforcement of Oil Spill Control Measures (5) | 6.84 | 0.3109 |
Sewage Management (6) | 4.03 | 0.1832 |
Ballast Water Polluting Control (7) | 1.93 | 0.0877 |
Prevention of Waste Dumping (8) | 3.60 | 0.1636 |
Total | 1.0014 | |
CR | 0.12 | |
Table A3. Conservation and preservation of marine life, soil and sediment
Factors (No.) | Total Score | Internal Weightage |
Soil and Sediment Pollution Prevention (9) | 5.8 | 0.2636 |
Marine Biology and Wetland Preservation (10) | 3.85 | 0.1750 |
Strict Control of Dredging Activities (11) | 3.81 | 0.1732 |
Monitoring and Periodical Analysis of Activities Affecting Port Ecosystem (12) | 8.07 | 0.3668 |
Total | 0.9786 | |
CR | 0.08 | |
Table A4. Recycling of solid waste and garbage
Factors (No.) | Total Score | Internal Weightage |
Solid Waste Management (13) | 10.16 | 0.4617 |
Recycling of Waste, Garbage and Resources (14) | 6.20 | 0.2818 |
Modernisation of Waste Management and Facilities (15) | 5.64 | 0.2563 |
Total | 0.9998 | |
CR | 0.10 | |
Table A5. Effective management, cooperation and regulations
Factors (No.) | Total Score | Internal Weightage |
Collaboration to Improve Computer-Aided Operations (16) | 6.61 | 0.3005 |
Adoption of ISO 14001 EMS (17) | 4.57 | 0.2077 |
Effective Leadership (18) | 4.21 | 0.1913 |
Hazardous Cargo Management (19) | 2.57 | 0.1170 |
Standardisation of Rules and Regulations for all Dry Bulk Terminals (20) | 4.04 | 0.1836 |
Total | 1.0000 | |
CR | 0.12 | |
Table A6. Efficient port development and operations
Factors (No.) | Total Score | Internal Weightage |
Research on Port Development (21) | 5.51 | 0.2506 |
Efficient Planning on Port Development (22) | 5.78 | 0.2627 |
Identification of Key Green Projects (23) | 5.52 | 0.2511 |
Management of Land Transport and Intermodal Hinterland Connection (24) | 5.18 | 0.2356 |
Total | 1.0000 | |
CR | 0.12 | |
Table A7. Environmental awareness and training
Factors (No.) | Total Score | Internal Weightage |
Port Staff Training (25) | 7.37 | 0.3348 |
Development of Awareness Among Workers (26) | 8.48 | 0.3854 |
Community Awareness Promotion and Education (27) | 6.15 | 0.2707 |
Total | 0.9999 | |
CR | 0.06 | |
Table A8. Comparisons between clusters
Clusters | Total Score | Internal Weightage |
Air Pollution Management | 3.52 | 0.16 |
Water Pollution Management | 5.06 | 0.23 |
Conservation and Preservation of Marine Life, Soil and Sediment | 2.53 | 0.11 |
Recycling of Solid Waste and Garbage | 2.13 | 0.10 |
Effective Management, Cooperation and Regulations | 2.29 | 0.10 |
Efficient Port Development and Operation | 2.60 | 0.12 |
Environ-mental Awareness and Training | 3.98 | 0.18 |
Total | 1.0000 | |
CR | 0.06 | |
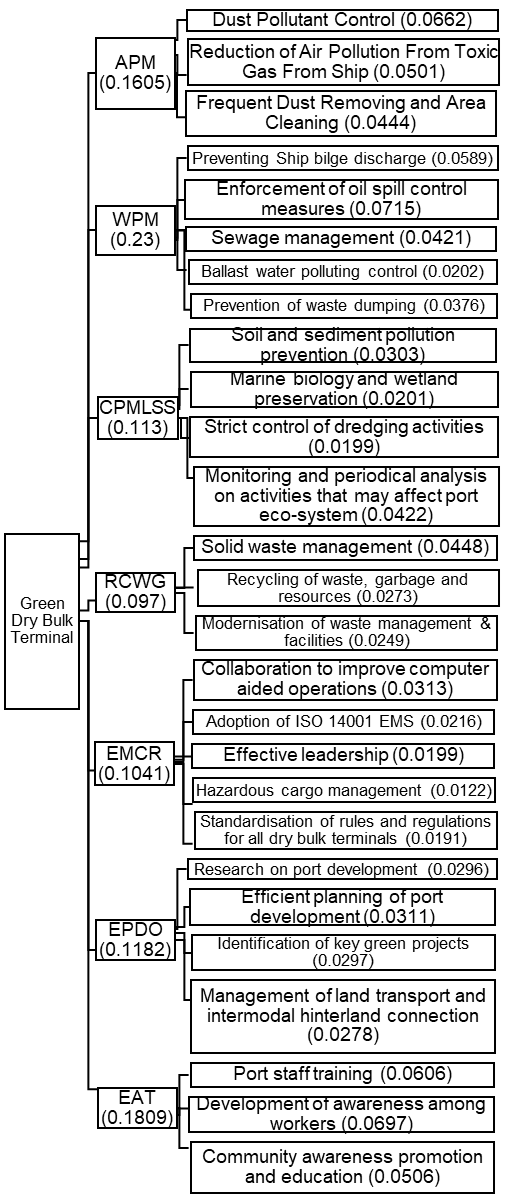
Figure B1. Decision-making model to achieve green dry bulk terminal