
 Open Access
Assessment of the Effectiveness of Solar Energy in Marginalised Communities: A Case Study in Diepsloot Township, Gauteng Province, South Africa

 View Full Article|
 Download PDF
Abstract:
Access to modern energy services is crucial for reducing energy poverty, which involves lowering costs, increasing access to energy appliances, ensuring safety and efficiency, and providing renewable energy sources for household needs like cooking, heating, and lighting. Marginalised communities often use fire-prone energy sources, leading to fire accidents and incidents. Off-grid renewable energy systems are gaining popularity in these communities, but energy stacking remains a common practice. This study aims to understand the uptake and acceptability of solar power in underprivileged areas by analysing home energy consumption trends, identifying energy-related problems, and proposing solutions considering the needs and circumstances of the impacted communities. The study involved 40 households and found that paraffin, firewood, and liquefied petroleum gas (LPG) were used for cooking, while solar energy was mainly used for lighting. However, households believed solar energy was not affordable and insufficient, and 98% of participants believed the availability of renewable energy sources was the main reason for using it. Implementing renewable energy technologies for cooking and heating and financial investment in solar energy is necessary to ensure affordability and sustainability.
1. Introduction
Millions of households in South Africa still lack safe access to power and contemporary energy services, despite the country's high electricity rate of 86% [1]. Poor households are burdened by relatively high energy costs, which frequently surpass household’s income by 10%, as opposed to wealthier households, which normally spend between 2% and 3% on energy [2]. According to Lesala et al. [1], low-income households are particularly susceptible to energy poverty, which still affects roughly 38% of South Africans. According to the United Nations in South Africa, energy poverty is the inability to use contemporary cooking fuels for cooking and the absence of basic electric lights for reading or other domestic and useful tasks after sundown [3]. According to Statista Research Department, there are about 746 million people globally without access to electricity and sub-Saharan Africa accounts for 80% of this global total in 2023 [4]. A significant hindrance towards supplying electricity into informal settlements is the unprecedented urban growth which exceeds governmental efforts to redress the infrastructure constraints with South Africa’s rates of urban migration and population growth [5]. According to Kovacic et al. [6], one of the problems with improving the electricity supply is the difficulty in estimating the exact number of households in such settlements. For example, in South African illegal immigrants from other African countries such as Zimbabwe, Nigeria and Lesotho reside in these informal settlements. According to Statistics South Africa [7], there was a net immigration of 852,992 individuals into South Africa between 2016 and 2021, with roughly 47.8% of them settling in Gauteng, which puts further strain on the nation’s economy. The United Nations Sustainable Development Goals (SDG) 1 and 7 aim by 2030 to eliminate poverty and provide people with access to affordable and clean energy. Thus, South Africa must reduce its reliance on coal-based energy generation from 90% to 65% by 2030 and switch to renewable energy sources [8]. This can be accomplished using renewable energy, such as solars in informal settlements where electrification is not possible. To safeguard the nation's energy security, the South African government has primarily concentrated on electrification by integrating on-grid and off-grid technology, particularly household solar systems. According to Igamba [9], around 90% of South Africa's electricity is now generated by coal, with the remaining 5% being generated from nuclear fission, 5% from hydropower, solar and wind energy. The preparation and execution of energy strategies with parallel expansion in terms of social and economic factors, while considering environmental implications, is a critical effort to promote sustainability [10]. The South African government established the Renewable Energy Independent Power Producer Procurement Programme, which allows enterprises to place bids on green energy projects to supply electricity to the national grid at a fixed price thereby providing opportunities for private sector investment in renewable energy [11]. Although there are many publications on the implementation of renewable energy in marginalised communities, there is still a challenge in implementing renewable energy to cater for all household needs. For example, Tlhatlha [12] concluded that the first challenge that must be tackled is to replace fire prone energy sources such as candles, and paraffin with safer alternatives in Diepsloot informal settlement.
However, this researcher also acknowledged that it is difficult to acquire renewable energy systems that cater to the energy needs of all informal settlements households. According to Lin and Kaewkhunok [13], there is still a lack of clarity surrounding the decision to adopt renewable energy sources. The findings reported in study[14] show that solar energy accounts for only 0.1% of the energy sources used for cooking in South Africa, whereas solar energy accounts for 0.7% of the country’s overall energy use for lighting. This 0.6% difference suggests that there are more people who utilise renewable energy sources such as solar power for lighting than for cooking, in comparison to the around 2.7% of South Africans who still use paraffin for cooking and the 3.2% who still use candles for lighting [14]. According to Makonese et al. [15], service backlogs and delays in energy poverty alleviation mean that the National Electrification Programme and the provision of cheap energy are far from meeting sustainable development targets. Solar panels are photovoltaic (PV) energy generating systems, but the cost of utility-scale PV installations is higher than fossil fuel power plants [16]. However, Kannan and Vakeesan [17] argue that solar energy is a viable, low-cost renewable alternative for addressing energy challenges. In Diepsloot there is a private renewable energy company that offers services to the informal settlement for which households must pay a monthly fee. Akter and Bagchi [18] reported a correlation between energy poverty and household attitudes towards solar powered electricity. Hence affordability is a very important determining factor in this regard as Diepsloot is said to have a high unemployment rate and an above average household energy expenditure [8]. Thus, there is a need to assess the effectiveness of solar energy in marginalised communities to determine the cost of solar energy system and compare this with the savings realised through reduced electricity bills. In addition, no previous research has involved Diepsloot’s informal settlements in a case study to examine the effectiveness of solar energy within a marginilised South African community.
2. Methodology
The Rand provincial administration established Diepsloot in 1995 as a temporary sanctuary for people who had been removed from informal communities in Honeydew, Sevenfontein, and Alexandra [19]. There are three types of residences in the area: (1) shacks made of corrugated iron sheets; (2) Reconstruction and Development Programme (RDP) houses built of brick walls and iron sheet roofing; and (3) bond houses in Tanganani (extension 3) consisting of brick walls and tile roofing [20]. The following extensions are informal settlements with energy poverty: 1, 12, and 13. RDP houses can be found in the following extensions: 2, 4, 5, 6, 7, 8, 9, 10, and 11, but shacks are also present in these regions. Extension 3 (Tanganani) has bond houses and no energy poverty [19]. According to STATS SA [7], the 2022 census indicated that Johannesburg has a population of about 4,803,262 of whom 10.2% live in informal settlements.
The observation guidelines represent a traditional qualitative methodology that centers on the genuine everyday experiences of the study participants. Such data gathered through the researcher's observation cannot be reduced to figures [21]. The researcher used a general study area observation checklist so that during data collection, when the researcher observed any solar installation, maintenance, street solar powered streetlights, or any damage to solar cables, the researcher noted these and also took pictures. The researcher’s cell phone was utilised for taking pictures, where a Global Positioning System (GPS) camera application was used to further support the accuracy of the observations.
According to de Vos et al. [22], questionnaires are a type of research instrument that includes a series of questions on a form that are intended to collect data from study participants. In this study, semi-structured questionnaires were employed. The semi-structured questionnaire included closed-ended questions where participants could choose from the provided answers as “Yes” or “No”. Study participants were also given the opportunity to provide extra information not covered by the structured inquiry [22] that focused on DCGO solar energy company, the sole direct current solar energy provider in Diepsloot informal settlements, that was the only company included in the study from whom the researcher collected data.
The researcher used non-confidential secondary data from the solar energy company and also included the answers to the questionnaire provided by the company manager, the leaflet showing monthly costs and appliances provided by the company, published pictures from the company’s website, online newspaper articles, and other online publications. Secondary data were ideal to address the study objectives, such as in calculating the amount of electricity generated by solar panels. Here, the researcher used solar specifications obtained from published online articles or company websites and obtained the solar panel’s rated power (W, the SI unit of power; $1~\mathrm{W}=1~\mathrm{kg}\cdot\mathrm{m}^{2}\cdot\mathrm{s}^{-3}$) from a questionnaire completed by the company manager to calculate the electricity generated by the solar panels. The researcher made use of a formula by Allen et al. [21] to determine the amount of electricity generated by a solar panel. This was calculated as follows:
Power in $\mathrm{W} \times$ Average hours of direct sunlight = Daily W-hours
where, Gauteng’s average daily peak sun hours are between 5.3–5.5 hours per day [23].
Although several South African studies have examined energy poverty and the adoption of renewable energy technologies in low-income communities, most have focused on access to electricity, renewable energy policy, or the technical performance of solar systems. Limited attention has been given to evaluating whether off-grid solar energy systems adequately meet the diverse household energy needs of residents living in informal settlements. Furthermore, few studies have investigated how affordability, energy stacking practices, and household socio-economic conditions influence the long-term effectiveness of solar energy interventions.
This study addresses this knowledge gap by focusing on Diepsloot informal settlement, one of South Africa's largest and most densely populated informal settlements. Unlike previous studies that primarily assessed access to renewable energy technologies, this research evaluates the effectiveness of solar energy in addressing household energy poverty by examining affordability, energy consumption patterns, user experiences, and the continued reliance on alternative fuels. The findings provide context-specific evidence that can assist policymakers, municipalities, and renewable energy providers in designing more appropriate energy interventions for marginalised communities.
Strydom and Venter [24] explain that a sample can either be people or an object, studied to make sense of a larger population from where samples are drawn. The population size ($N$) of the present study are heads of households of Diepsloot informal settlement that utilise solar energy, are between the ages of 18 and 60, and are available during the period of study. No person with mental illness, heavily pregnant women or any person under the influence alcohol or drugs was included in the study. Furthermore, a non-probability sampling was utilised as there is no certainty that each population member was represented in the sample [24].
The sample size ($n$) was determined by making use of a method [25], which shows that a study’s $n$ is determined at a population confidence level 95% with an error margin of ±5% where ($n$) is the sample size, $N$ is the population size and $e$ is the level of precision that is equal to 0.05.
The following formula was used to calculate the sample size ($n$):
\[ n=\frac{N}{1}+N e^2 \]
The Diepsloot informal settlement direct current solar users has a population size of 3330 and the number of households per solar panel is 356 [26]. Thus, based on the above formula, the sample size was calculated as follows:
\[ n=\frac{(356)}{1}+356(0.05)^2 \]
\[n=\frac{(356)}{1}+0.89\]
\[n=188 \text { households }\]
However, during data collection the researcher reached data saturation after interviewing 40 households. Data saturation refers to the number of study participant responses to which fresh data duplicates information from past data. This occurs during the research process when the researcher has acquired sufficient data to make the necessary findings but gathering further data will not provide further valuable insights [27]. According to Hennink and Kaiser [28], a qualitative research study requires a minimum sample size of at least 12 to achieve data saturation. The saturation point in this study was influenced by repetition of study objective outcomes. As an example of this, one of the researchers’ objectives were to calculate the initial installation cost of the solar energy system and compare it with the savings realised through reduced electricity bills. Participants indicated the expense of the installation costs; which appliances were included and the monthly energy bill. All participants selected “no” to a question that asked: “do you consider solar energy to be affordable” with the participants’ reasoning being that solar energy does not meet all household needs as the solar energy company does not offer cooking and heating appliances and services. Additionally, the researcher used secondary data to determine the amount of electricity generated by solar, according to the manager, the solar panels have back-up batteries, which have different energy storage capacities. The energy generated is calculated on a 24-hour period and there is a system used to track each solar panel battery.
The amount of energy generated in 24 hours is dependent on the amount of energy consumed by households. For example, a household on a blue package will consume more energy than a household on a red package due to the appliances used. The solar energy company uses energy storage batteries and these should be carefully charged and discharged to maximise battery life. This system has an energy storage component that can be used with banks of lithium-ion (li-ion) batteries. The solar tower has a load profile of 3,200 W over 24 hours, and because all connected residences utilise the same bundled DC appliance with a load profile of 200 W during the same time, it can effectively supply energy to 16 houses daily.
A gridded system has the advantage of not requiring all consumers to use their maximum demand profile at the same time, allowing for a better energy balance. This is calculated according to the following equation: Power (watts) × average hours of direct sunlight = daily watt-hours.
Bearing in mind that Gauteng’s average daily peak sun hours are between 5.3 to 5.5 hours in length [23]. According to the solar energy company manager, an average solar panel is around 3200 W and receives 5.5 hours of sunlight peak each day, then the total power output is calculated as 3,200 $\mathrm{~W} ~\times$ 5.3 hours $=$ 16,960 $\mathrm{~Wh}$ or 16.96 kWh.
In this regard the total amount of electricity generated by the solar panels over a period of a month of 30 days is determined by: Total power in Watts $\times ~30$ days: 16.96 $\mathrm{kWh} ~\times$ 30 days $=$ 508.8 $\mathrm{kWh}$.
Although the calculated sample size using Yamane’s formula was 188 households, qualitative data collection was concluded after interviews with 40 households because thematic data saturation had been achieved. During the interviews, participants consistently reported similar experiences regarding solar energy affordability, appliance limitations, energy use patterns, and continued dependence on paraffin, liquefied petroleum gas (LPG) and firewood. After the fortieth interview, no new themes, perspectives or information emerged that contributed additional insights to the study objectives. Consistent with study [28], data collection was therefore terminated because further interviews would have generated repetitive information without improving the quality of the findings.
There was an Ethical clearance application to the College of Agriculture and Environmental Sciences, University of South Africa. Only after ethical clearance had been granted did the researcher conduct a pilot study. The ethical clearance letter is available upon request. The researcher strictly abided by the moral guidelines established by the University of South Africa and other organisations, all participants’ consent was sought in writing. This research study involved human participants and therefore the following issues were taken into consideration: confidentiality, privacy and anonymity of participants were ensured, participation in the study was voluntary, no participants below the age of 18 years and over the age of 60 participated in the study. Additionally in the study no persons with mental disability and persons under the influence of drugs or alcohol was allowed to participate.
The purpose of the study was explained to participants in a language that each participant understood best, and standardised consent form and confidentiality forms from the University were used. Apart from the DC solar energy company in Diepsloot informal settlements, no other company was included in the study. As part of the application procedure, the researcher established that data gathering would not cause harm to the participants and, in addition, ensuring that informed consent is genuine and correct, that privacy and confidentiality are respected, and that informed consent is confirmed. A signed and stamped letter of permission to conduct the study was acquired from the DCGO solar energy company. The company is the sole DC solar energy supplier in study area, and another signed and stamped permission letter from Diepsloot informal settlement ward councilor.
The researcher made copies of the same questionnaires thus the information that was asked was repetitive or the same for all the households so that the researcher could identify similarities and consistencies in the answers. Primary data was collected by using self-designed, semi-structured questionnaires to interact with residents in the informal settlements who utilised solar energy and who were willing to participate in the study as well as the management solar of the energy company that supplies solar units to households in Diepsloot. The questionnaires were prepared in English but explained in vernacular language to accommodate the uneducated participants or participants who do not understand English. The questionnaire consisted of closed-ended and open-ended questions [29]. The researcher printed out the questionnaires and distributed these to participants one at a time. For participants who could not read or write, the researcher read and explained the questions in a language that the participants understood, before writing down the answers given by the participants. Questionnaires were given numbers such as “Questionnaire 1” and “Questionnaire 2”, until Questionnaire 40. The data were initially scanned and saved on “one Drive” linked to the researcher’s University email which is password encrypted.
Data analysis is the systematic process of giving data order, structure, and meaning and can be evaluated or summarised [22]. The method [30] was used to examine the data. According to these authors, data analysis begins while the data are still being collected, such as when the first set of questionnaires was completed by study participants. Additionally, the raw data were divided into more manageable portions, allowing the researcher to start analysing data after the first day of data collection [30]. This aids the researcher in identifying the traits and composition of the data gathered.
Thus, the data were analysed, the results were discussed, and data presented using graphs and tables. The data gathered from the first to the last day of data collection were presented as graphs, to make the collected data easier to read, comprehend, and explain [31]. The researcher recognised recurring themes and patterns from data gathering to confirm the information. The data collected from the questionnaires were manually recorded and analysed by the researcher. For example, if the researcher managed to complete 20 questionnaires filled by households’ heads on day 1, on the very same day the researcher captured the information in a book. Question 1 is about age range therefore in the book the researcher wrote 1 up to 40 to correspond with the questionnaire number, since question 1 is age range, the options are numbered using a, b, c’s. The researcher numbered the questionnaires in sequence from 1 to 40, these numbered are vital when quoting participants comments where in a number is used to identify different household rather than using their name thus participants remain anonymous.
3. Results and Discussion
This study questioned direct solar energy users in Diepsloot informal settlements. Table 1 shows the gender and age range of the participants, 53% of the participants were males and 47% were females. The Researcher had made an option for other genders on the questionnaire but none of the participants chose other genders except for these two options. Most of the participants were in the age range of 41 to 50 years, The age ranges from 18 to 30 years showed the lowest frequency with just 2.5% participants.
Gender | Frequency | Percentage (%) |
|---|---|---|
Female | 19 | 47% |
Male | 21 | 53% |
Other | 0 | 0% |
Age Range in Years | Frequency | Percentage (%) |
18–30 | 1 | 2.5% |
31–40 | 14 | 35% |
41–50 | 19 | 47.5% |
51–60 | 6 | 15% |
Below Table 2, shows that 90% of the study participants chose “single” as their marital status, this means that most of the participants are not legally married by law. The household members were consisting of single mother and children; dating couples not legally married and their children; grandmother, daughter and grandchildren; and Siblings to name but a few. Only 2.5% of the participants chose “married” as marital status, including the only household head from Lesotho. In South Africa, for one to be married there must be a signed letter from the Department of Home Affairs and a certificate, and the participant who selected marital status as “married” did not produce a marriage certificate as proof. Table 2 shows household family members, including a person’s dwelling on a full-time basis in the households, for example husband, wife, children and grandparents. This means that even when a household head is a single parent staying alone in Diepsloot informal settlement but has 3 children who are staying in a different area with other family members, the household family members will be one. There was only one household head, i.e. 2.5% of the study participants, who lived alone. Of the remaining households, 5% comprised two members, 27.5% of the households had three members—two of these household heads indicated that girlfriends were heavily pregnant. Most commonly, 42.5% of the households consisted of four family members, and 22.5% had the maximum number ($n=$ 5) of family members.
Marital Status | Frequency | Percentage (%) |
|---|---|---|
Single | 36 | 90% |
Married | 1 | 2.5% |
Divorced | 2 | 5% |
Widowed | 1 | 2.5% |
Household Family Members | Frequency | Percentage (%) |
1 | 1 | 2.5% |
2 | 2 | 5% |
3 | 11 | 27.5% |
4 | 17 | 42.5% |
5 | 9 | 22.5% |
6$^{+}$ | 0 | 0% |
Table 3 shows the participants highest level of education and employment status. The level of education ranges from no schooling, some primary education, completed primary, some high school education, matric, tertiary education and others. The employment status shows whether participants are employed either on a temporary basis, contract or permanent basis. The “no” option is for when participants are unemployed, self-employed and or receiving a social grant.
Highest Level of Education Obtained | Frequency | Percentage (%) |
|---|---|---|
No schooling | 7 | 17.5% |
Some primary education | 16 | 40% |
Completed primary | 13 | 32.5% |
Some high school education | 3 | 7.5% |
Matric | 1 | 2.5% |
Tertiary education | 0 | 0% |
Other | 0 | 0% |
Are You Employed? | Frequency | Percentage (%) |
Yes | 9 | 22.5% |
No | 31 | 77.5% |
Regarding education, 17.5% of the household heads had no formal education, and so could not read or write. Of the participants who were literate, able to read and write, 40% had some primary education and 32.5% had completed primary education. Regarding secondary school education, 7.5% of the household heads had some high school education, including completion of grade 8 to grade 11, while only 2.5% had obtained matric and none completed tertiary education. Unemployment is known to be very high in the country particularly in underprivileged areas such as informal settlements, so that from the 40 participants, nearly two thirds (65%) marked “No” to the question “are you employed” and the remainder (35%) chose “Yes”.
Figure 1 shows the household head’s source of income and monthly income range. The income sources range from temporary employment, self-employment, and social grant. None of the study participants were permanently employed. Reported monthly salaries ranged from R350 to R6,000 and above. Figure 1 shows that all the participants who are employed are on a temporary or contract basis. Of these, 28% of the participants were self-employed, with self-employment ranging from selling snacks, secondhand clothes on the streets and taxi rank, to recycling rubbish. Another 17% depend on a social grant. The indicated social grants included the unemployment grant, which is R350 for unemployed people below the age of 60, the child grant which amounts to R530 per child under the age 18, and the pension grant amounting to R1,980 for persons over the age of 60. In terms of the salary range of study participant earnings, over a quarter (27.5%; $n =$ 11) earned from R350 to R1,000 per month, while most (60%; $n =$ 24) of the participants earned an income between R1,000 to R3,000 per month, and some (10%; $n =$ 4) of the study participants earned a salary between R3,001 to R6,000 per month. A single study participant earned more than R6,000 per month.


A comparison of household income categories suggests that lower-income households (earning below R3,000 per month) relied more heavily on low-cost traditional fuels such as paraffin, firewood and candles for cooking and heating, while using only the basic solar package for lighting and cellphone charging. Higher-income households were more likely to subscribe to larger solar packages that included appliances such as televisions and refrigerators. However, irrespective of income category, households continued to practise energy stacking because none of the available solar packages adequately supported cooking or water heating. This indicates that income influences the level of solar service that households can afford, but does not eliminate dependence on traditional fuels.
The solar energy company offers different colour-coded packages offered by the DCGO solar energy company. These are the red package, yellow package, purple package, and blue package. The packages determine the type of appliances to be used and so, for example, a household on a red package cannot plug in a solar television and if plugged in the main switch will trip due to overloaded system. Households who are on a red package will have to upgrade to either a yellow or blue package to watch the television. According to all the participants, the installation fee is R200 followed by the monthly service fees, which are dependent on which package/appliances a household uses. The installation fee is a fixed amount paid, for the company to connect cables and a DB box to a household. The monthly service fee is an amount that is different for the different packages offered by the company, monthly service fee is the same as paying for electricity, whereby the more appliances you use the more you pay, this is because more appliances used result in more electricity being consumed. Monthly service fee does not depend on how much electricity the household uses, as the amount is fixed for the different packages.
Figure 2 below shows participants’ energy sources utilised for lighting, additionally, there are details given by participants with respect to solar energy usage times and the results of energy-related challenges. The manager of the solar energy company provided details on the quantity of energy produced by a solar panel. Figure 2 below is a pie chart illustrating the energy source used by participants for lighting prior to using solar energy, all the participants are currently utilising solar energy for lighting. These energy sources include candles, lanterns, illegal electricity and others. About 95% of the participants indicated that candles were used as the energy source for lighting and the remainder (5%) used illegal electricity.
The energy used prior to using electricity only applies to the period the area of study, for example if a participant was utilised electricity for lighting in another area but when moving to Diepsloot the participant used candle for lighting then the candle option will be selected in this regard. There was no household head that chose lanterns as the energy source used prior to using solar energy. According to Figure 2, over 95% of participants were using candles and were in energy poverty before having access to solar energy. With solar energy available in the informal settlement, 100% of the participants utilise solar energy for lighting.
There are several different reasons why individuals choose solar energy namely; affordability, availability and that solar energy as a renewable energy is environmentally friendly. Figure 3 shows participants reasons for why households chose solar energy.
Nearly all (97.5%; $n=$ 39) of the household heads mentioned that the reason for choosing solar energy was that it is available to them. Only one (2.5%) chose affordability and no one selected the option for choosing solar energy as being environmentally friendly. Since no study participant selected the environmentally friendly option, this suggests that the household heads have insufficient knowledge about solar energy. Likewise, 97.5% of the study participant indicated that if there was legal prepaid electricity available from Eskom, the household heads would have not opted to use solar energy, while only one household head indicated that solar energy would have been an alternative during load shedding if Eskom was supplying the informal settlement with electricity.
According to the company’s website and leaflets the solar energy appliances offered are television, radio, refrigerator, freezer, Digital Satellite Television (DSTV), charging station and lights. All the appliances except lights and charging station are charged separately and the monthly service depends on the number of appliances used, so that the more the appliances used, the higher the monthly service fee. During data collection, the researcher found that only 2 of the households had a refrigerator, a television and DSTV, while another seven of the households were using a television and DSTV. The remainder ($n=$ 29) of the households were only using lights and charger.
The study participants indicated that at some point there has been cable theft in the area whereby cables had been stolen in the middle of the night. However, the solar energy company did not take time to respond to the problem, according to the household heads. The cable theft in the area happened because solar cables are made from copper wires. People who steal cables in South Africa to make money or using them for unauthorized connections or selling them to scrap dealers. are referred to as “$izinyoka$”, which means Copper theft has become more common in South Africa, especially in Gauteng, due to the metal’s many qualities that attract thieves [32].
Around 70% of the household heads indicated they had experienced power outages at some point. The reasons for this varied from bad weather or change of season when there is a connection problem. This connection problem happens because solar panels use a wireless networking protocol (WiFi). The other reason that was brought up was the solar panel battery not having had enough time to charge, due to many people having been using the electricity during the day, so that at night when everyone was switching on their lights, the power went off at times.
The energy consumption per household is dependent on the type of package they use, as different packages have different appliances and correspondingly different energy consumption. Most of the participants are on the red package, which has appliances loading profile of 200 W per hour and this allows up to 16 households to be connected to a solar panel. On each solar panel there is streetlight, which aids with illumination. The study findings show that solar energy is mainly utilised for lighting and charging cellular phones, and non-renewable energy sources such as paraffin, LPG gas and firewood are used for cooking and heating water.
Participants who are on the red package and only using solar energy for lights, pay a once-off installation fee of R200 plus a R195 monthly service fee. The price of 6 pack of candles in South Africa costs R35 so a household in Diepsloot may use three packs of candles (totalling R115) for lighting only per month. This unfortunately shows that participants spend more money to use solar for lighting, but this is balanced by the great advantage about solar in that there is a reduction in fires caused by candles in the informal settlements. With the solar energy available in Diepsloot, traditional energy sources for cooking, and heating are still being used due to solar energy companies not offering solar appliances for cooking and heating. For households using the blue package, after the expense of installation, the rental cost is R650. However, this does not include a solar cooker or solar water heater and so households on this package are still making use of fire prone energy sources for cooking and heating.
The affordability of the available solar packages remains a significant challenge for low-income households. Approximately 87.5% of participants earned less than R3,000 per month, yet even the basic solar package required an installation fee of R200 and a monthly payment of R195. Although this monthly payment may appear relatively modest, it represents a substantial proportion of disposable household income after meeting essential needs such as food, transport and education. Consequently, many households continue using paraffin, LPG and firewood because these energy sources can be purchased incrementally according to available income rather than through fixed monthly service fees. These findings demonstrate that affordability remains one of the major barriers to expanding renewable energy use beyond lighting.
During data collection, the researcher observed the different energy sources, excluding solar energy, being utilised by informal households. These include paraffin, LPG, use of illegal electricity and firewood. The researcher noticed that participants use a mixture of energy sources, so that in a household where solar is used for lighting, a different energy source will be used for cooking or heating. As indicated, most of the study participants use solar energy for lighting, which eliminates the usage of candles, but still use paraffin, gas and/or firewood for other energy requirements.
The continued practice of energy stacking has important long-term implications for household welfare and energy poverty. Although solar energy successfully reduced dependence on candles for lighting, households continued to rely on paraffin, LPG and firewood for cooking and water heating because the available solar packages did not support these energy services. Continued dependence on paraffin and firewood exposes households to indoor air pollution, burns, accidental fires and respiratory illnesses. Furthermore, energy stacking increases household energy expenditure because families must simultaneously purchase several different energy sources. These findings suggest that providing access to solar lighting alone is insufficient to eliminate energy poverty unless renewable energy technologies also address cooking and heating requirements.
About 70% of the participants stated that they had gone through a solar energy power outage at some point, but that power outages are infrequent and are rapidly fixed by the solar energy company. These power outages are said to sometimes occur during bad weather, but not because there is no sunshine but due to loss of signal. As the solar panels are provided with batteries that can store power even on a cloudy cold day, there will still be an energy power supply to households. Participants indicated that on average a household might experience power outage 1–3 times a year at most. Therefore, solar energy is reliable and consistent throughout different seasons.
This study demonstrates that participants had experienced solar energy cable theft, which according to the household heads occurs at night, however participants mentioned that stolen cables are replaced within days by solar energy company. Despite more consistent source of electricity, the study participants still viewed solar energy as being expensive and not meeting all household needs. The solar energy company manager said that one of the main challenges facing Diepsloot is the illegal electricity connection cables.
This study was limited to households using one solar energy provider within Diepsloot informal settlement and therefore the findings cannot be generalised to all informal settlements in South Africa. Household energy practices may differ across provinces because of differences in socio-economic conditions, energy infrastructure and renewable energy programmes. Future research should include multiple informal settlements from different provinces and compare the effectiveness of different off-grid renewable energy systems under varying socio-economic conditions.
4. Conclusion
This study builds on previous research on energy poverty undertaken by scholars, non-profit organisations (NGOs), and international organisations. Energy services should be provided in South Africa starting right away, with safer fuels such as paraffin and gas being substituted for other, more volatile fuels. The findings have important policy implications. Government departments, municipalities and renewable energy providers should expand solar programmes beyond lighting by promoting affordable solar cooking and water-heating technologies suitable for low-income households. Financial mechanisms such as targeted subsidies, flexible payment plans and micro-financing could improve access to renewable energy technologies among poor households. Community-based renewable energy programmes that include maintenance support, technical training and consumer awareness campaigns would further enhance sustainability and increase public acceptance of solar technologies. These interventions would contribute towards achieving Sustainable Development Goal 7 by improving access to affordable, reliable and clean energy.
Conceptualization, M.F.M. and K.S.; methodology, M.F.M.; validation, M.F.M. and K.S.; formal analysis, M.F.M.; investigation, M.F.M.; resources, M.F.M.; data curation, M.F.M.; writing—original draft preparation, M.F.M.; writing—review and editing, M.F.M. and K.S.; visualization, M.F.M.; supervision, K.S.; project administration, M.F.M. All authors have read and agreed to the published version of the manuscript.
The data used to support the research findings are available from the corresponding author upon request.
I would like to convey my heartfelt gratitude to the University of South Africa and the individuals whose efforts and assistance have significantly improved the quality and rigour of this research. I would like to thank Diepsloot ward councilor and DC Go company manager for granting me permission and giving me permission to collect data. Finally, thanks to my friend P. Mphahlele for accompanying me to Diepsloot during the data collection period. I am thankful for my mother’s encouragement and support.
The authors declare no conflicts of interest.
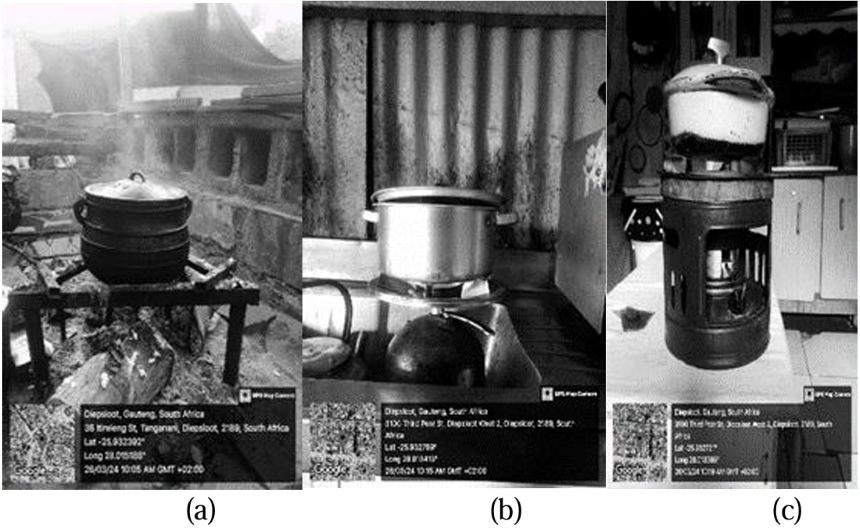
Figure A1. Energy sources used for cooking in Diepsloot informal settlement by solar energy users: (a) Firewood used for cooking; (b) Liquefied petroleum gas used for cooking; (c) Paraffin stove used for cooking
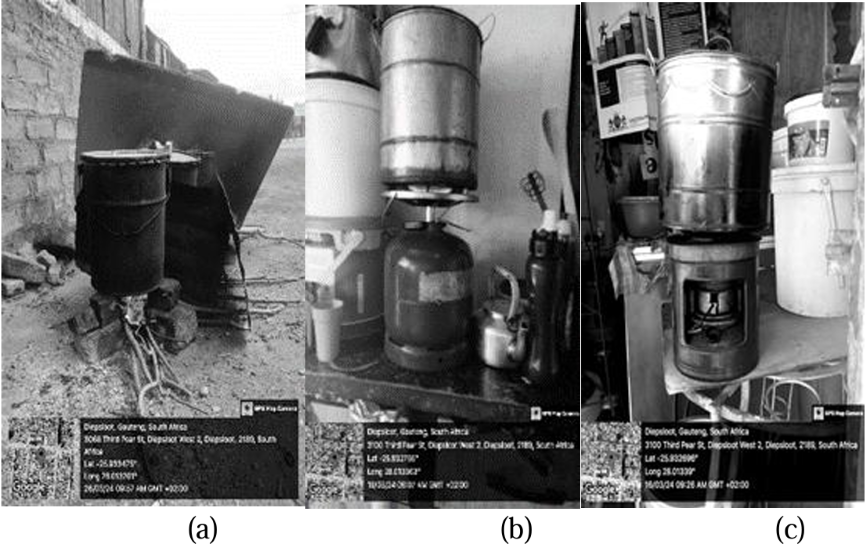
Figure A2. Energy sources used for heating water in Diepsloot informal settlement by solar energy user: (a) firewood used for heating water; (b) liquefied petroleum gas used for heating water; (c) paraffin stove used for heating water
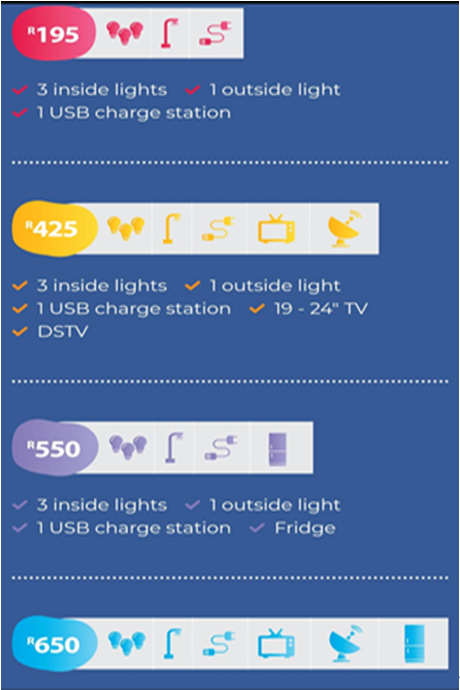
Figure A3. Solar energy company leaflet displaying, solar service plan packages available in Diepsloot informal settlement [26]
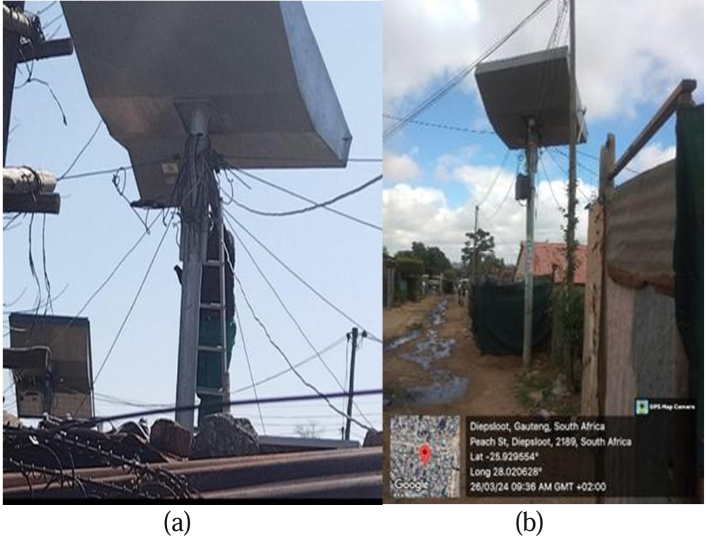
Figure A4. Solar panels in Diepsloot: (a) solar panel maintenance; (b) solar panel
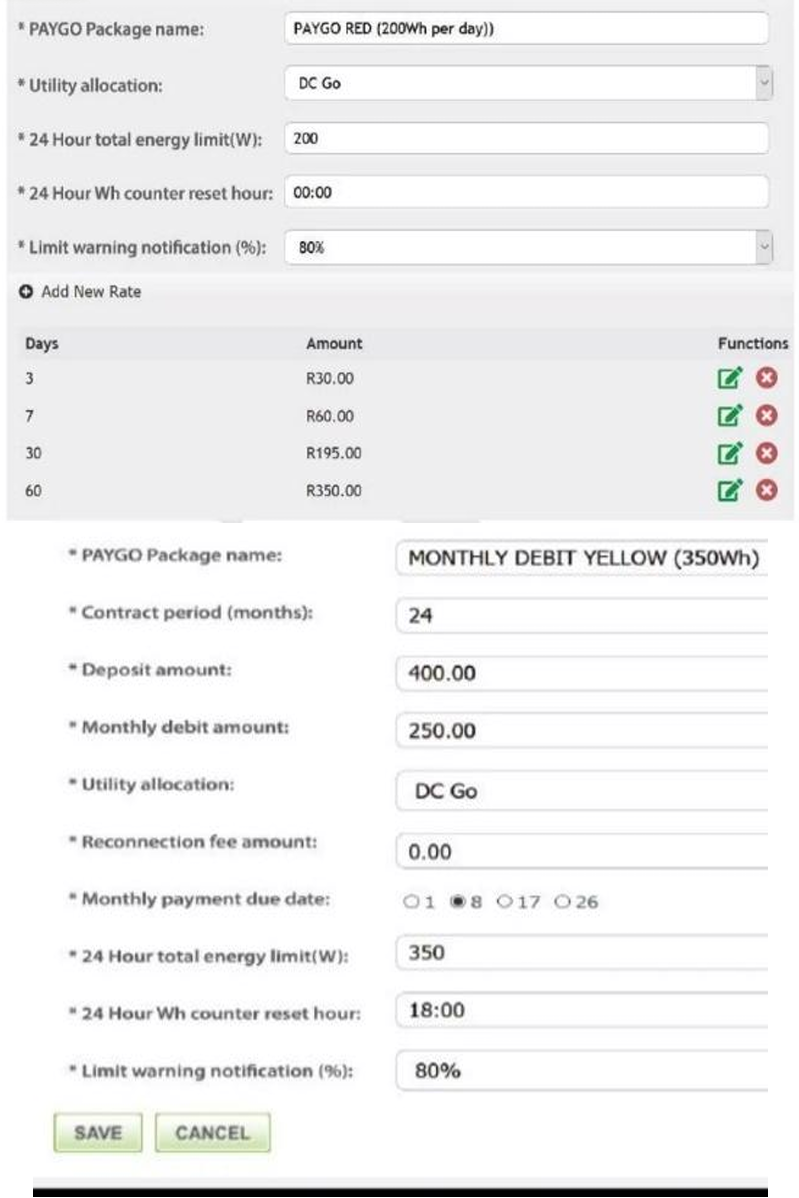
Figure A5. Screen shot of system used by solar energy company to monitor each solar panel [26]





 Views: 283
 Crossref: 0