Acadlore takes over the publication of IJEPM from 2025 Vol. 10, No. 3. The preceding volumes were published under a CC BY 4.0 license by the previous owner, and displayed here as agreed between Acadlore and the previous owner. ✯ : This issue/volume is not published by Acadlore.
Sustainable Management Model Based on Renewable Energies for the First Capital of the Californias, Loreto, Mexico
Abstract:
The Mexican state of Baja California Sur has a high rate of population growth. It is also one of the states that are most vulnerable to climate change. Due to its location on the southern side of a roughly 900-mile long peninsula, and its natural separation from mainland Mexico, its power trans- mission networks are completely independent of the rest of the country. Thus, nearly all the energy used to generate electricity must be shipped to the state in the form of fossil fuels. The importation of energy supplies from the mainland results in higher costs for the state than in other areas of the country, causes greater environmental damage, and prevents a steady supply of energy to the state. This study’s objective is to propose a sustainable management model and to provide a reference to feasible sites available that could serve the Loreto region. An analytical model has been developed with multiple criteria and geographic information systems. This will allow for a wide range of spatial analysis of information covering the calculation of slopes, orientation, irradiation, infrastructure, etc. The municipal region of Loreto has roughly 288 square kilometres of land deemed suitable for the installation of solar plants. This area comprises 1.62% of the municipality. In 2016, the maximum electrical power demand for the entire state of Baja California Sur was 628 Megawatts per hour according to the Federal Electricity Commission (CFE). Loreto’s electrical capacity is currently 17MWh. Based on calculations that one photovoltaic plant located on two acres of land can produce one MWh, solar plants in the region could, theoretically, produce up to 14,403.35 MWh. Clearly, this potential capacity would be well above the demands of the municipality, which encompasses 3.8% of the state territory.
1. Introduction
In its Executive Summary of 2015, the International Energy Agency highlights the significant increase in the generation of renewable energy from non-fossil sources in the world. Renewable energy currently makes up 19\% of the total share of generated global energy. This percentage reflects the large investments made in renewables in 2014 , of 270,000 million dollars ( 270 billion USD). It is estimated that by 2030, global demand for energy will increase by $34 \%$. However, most of the world's energy production - $80 \%$ - is still expected to come from fossil fuels [1]. As a result, significant - and dangerous - levels of carbon emissions will continue to be produced in the years ahead. To reduce emissions, a rapid development of renewable energy production around the world is underway and reflects profound strategic changes in the way energy systems are now being produced. These important changes increasingly focus on creating diverse, efficient, and sustainable energy systems. In addition, the commitments made at the Kyoto Summit, to mitigate climate change through the reduction of carbon emissions, have yet to be fully implemented.
Mexico's transition from traditional energy sources to renewables will provide great opportunities for investors to tap into the country's enormous potential for developing solar, wind, geothermal, hydroelectric, bioenergy, tidal, and other energy sources. In Baja California Sur, the average rates of solar radiation range between $4.4 \mathrm{kwh} / \mathrm{m}^2$ day and $6.9 \mathrm{kwh} / \mathrm{m}^2$ day [2]. In contrast, the Loreto region produces an average of $5.2 \mathrm{kwh} / \mathrm{m}^2$ day [3], which makes it particularly attractive for establishing photovoltaic energy production. Moreover, Loreto's location and high solar energy potential are important factors for the state when it considers policy measures and actions to achieve sustainability, as well as decisions regarding the exploitation of its region's vast energy sources.
1. | Identification of variables |
2. | Classification by levels of suitability |
3. | Assignment of value to variables |
4. | Generation of digital maps of the variables in Quantum GIS software |
5. | Intersection of values, overlapping of layers and calculation of suitable areas |
6. | Simulation of the model |
2. Methodology
The methodological process of this study uses a conceptual approach that follows the diagram flow (below) in its six stages. The first three stages are identified as areas of importance, list various conditions used to determine technical, economic, legal, and social feasibility, and are based on specific criteria. These stages can be extended or modified, depending on the needs and conditions required in a chosen study area.
A digital elevation model with a $15-\mathrm{m}$ resolution used by INEGI, Mexico's national geographical and statistics agency is employed and features topographical maps of an area's level of suitability in Loreto, referred to as UTM zone 12. The maps are scaled at 1:50,000 and are in an SHP form. These maps were cut and selected according to variables listed above and show the municipality as one complete unit, since some maps will intersect with other municipal maps. Transitioning from raster layers to vector layers of orientation area's and slopes facilitates the superposition of other vector layers. To determine the area's levels of suitability, maps can be superposed and will indicate their relative values. The layers that indicate protected and non-viable areas serve as boundary markers that must be taken into account when considering Mexico's environmental protection laws. The illustrations indicate where the most relevant aspects of the selected variables coincide and show areas most suitable for photovoltaic installations, according to criteria established in the following tables.
By using an impact/suitability model, formulated by Gómez Orea [4], an area's potential photovoltaic capacity can be analysed. Suitability is defined as the set of conditions required for a location and the variability of factors that produce an impact on new activities. This is a fundamental part of the procedure and is based on analysis and spatial modelling from the GIS proposed by Fischer and Nijkamp [5], and the planning tools of Birken [6] and Lavalle [7]. Feedback obtained from the dynamic model of Eastman et al. [8] will also improve assessment techniques.
3. Research Results
Category | Variables | Key |
Infrastructure | Communication routes Electrical transmission lines | Vs Rt |
Area | Slope Orientation | Pe Or |
Climate | Solar irradiation Temperature | Irs Tp |
Conservation restrictions | Protected areas Hydrological protection zone Archaeological sites | Ap Ph Sa |
Management constraints | Type of property Land use and vegetation Flood prone zones | Tp Usv AI |
Natural phenomenon restrictions | Hurricanes Earthquakes | Hu Si |
Suitability levels | Features |
Level (5) very high | The characteristics of the variables meet the criteria |
Level (4) high | The variables almost entirely meet the criteria |
Level (3) middle | Midpoint between the areas that meet the criteria |
Level (2) low | The conditions are limited |
Level (1) none | The conditions are not considered appropriate |
Electrical transmission lines: In order to protect solar energy structures, electrical lines must be at least 50 m from solar plant installations. These installations must also be located within a 10 km (6.2 miles) radius of electrical transmission lines (Dominguez, 2002) [9].
Infrastructure | |
Network transmission (in meters) | |
Suitability levels | Features |
Level (5) very high | 150 m to 1000 m |
Level (4) high | From 1000 m to 3000 m |
Level (3) middle | From 3000 m to 7000 m |
Level (2) low | 7000 m to 10000 m |
Level (1) none | More than 10000 m |
Road network: Two important constraints must be considered: One must focus on safeguarding the solar installation structure and the other on protecting nearby structures or areas. These structures must not be located within 150 m of a roadway or at a distance greater than 5 km (3.1 miles) (Rodriguez, 2010) [10].
Infrastructure | |
Road distances | |
Suitability levels | Features |
Level (5) very high | 150 m to 1000 m |
Level (4) high | 1000 m to 2000 m |
Level (3) middle | From 3000 m to 4000 m |
Level (2) low | 5000 m to 4000 m |
Level (1) none | More than 5000 m |
Slopes: Although solar structures must not be installed on slopes greater than $4^{\circ}$, according to Dominguez (2002) [9], in order to protect landscapes, solar installation manufacturers claim to have rotating structures that can face the sun at all times. This feature, they say, allows installation on slopes up to $20^{\circ}$.
Area | |
Slopes (in degrees) | |
Suitability Levels | Features |
Level (5) very high | Slopes between $0^{\circ}$ and $4^{\circ}$ |
Level (4) high | Slopes between $10^{\circ}$ and $5^{\circ}$ |
Level (3) middle | Slopes between $15^{\circ}$ and $11^{\circ}$ |
Level (2) low | Slopes between $16^{\circ}$ and $20^{\circ}$ |
Level (1) none | Slopes that exceed $20^{\circ}$ |
Orientation: In order to provide an effective map, an illustration of viable areas facing south is required, since it is known that south-facing land areas receive more hours of daily sunshine, and installations in these areas will generate more efficient energy production.
Area | |
Orientation (in degrees) | |
Suitability levels | Features |
Level (5) very high | Facing South, $180^{\circ}$ |
Level (4) high | Facing South, $135^{\circ}$ between $225^{\circ}$ |
Level (1) none | Invalid orientation |
The solar resource is determined by the amount of sunshine, or insolation, which can be harnessed and converted into electricity. This is the amount of solar radiation received at a given time on a given surface area. Establishing the site of the project in an area with an excellent solar resource provides a maximum and efficient use of the soil and minimizes its environmental impact.
Climate | |
Solar radiation (in kilowatt hours per square meter) | |
Suitability levels | Features |
Level (5) very high | Greater than 6.5 kWh/m2 |
Level (4) high | Between 4.5 kWh/m2 and 6.5 KWh/m2 |
Level (3) middle | Between 2.5 kWh/m2 and 4.5 kWh/m2 |
Level (2) low | Between 1.8 kWh/m2 and 2.5 kWh/m2 |
Level (1) none | Less than 1.8 kWh/m2 |
Average ambient temperature: Silicon cells deliver their highest voltage at $25^{\circ} \mathrm{C}$. With each additional degree, performance decreases between $0.3 \%$ and $0.7 \%$.
Climate | |
Temperature (in Celsius centigrade) | |
Suitability levels | Features |
Level (5) very high | From 20°C to 25°C |
Level (4) high | 26°C/29°C |
Level (3) middle | 30°C to 35°C |
Level (2) low | 36°C to 40°C |
Level (1) none | More than 40°C and less than 15°C |
Lithology: This will take into account specific points of interest in the physical characteristics or formations of the area as well as considerations for natural, protected spaces and land uses, such as residential, hydrological, etc.
Conservation restrictions | |
Protected areas | |
Suitability levels | Features |
Level (5) very high | Areas without protection |
Level (3) middle | Human settlements |
Level (3) middle | Sustainable use of natural resources |
Level (3) middle | Recovery |
Level (1) none | Protected natural areas |
Hydrological protection | |
Level (5) very high | Areas without Hydrological protection |
Level (1) none | Areas with Hydrological protection |
Archaeological areas | |
Level (5) very high | Areas that do not have archaeological sites |
Level (1) none | Areas that have archaeological sites |
Land uses: The lands considered as non-viable areas that must be taken into account are the following: ponds $(100 \mathrm{~m})$, shorelines $(200 \mathrm{~m})$, green spaces $(100 \mathrm{~m})$, beaches, dunes and sandbanks (200 m), dams (100 m), residential areas, scattered and continuous roads (500 m), and saline areas $(200 \mathrm{~m})$. Lands with some anthropogenic derivation have at least 100 m of protection. Areas that merit special protection status include land from a natural origin as well as land from anthropogenic sources and shall have 200 m of protection (Quijano, 2011) [11]. 500 m of protection is suggested for population centres (Rodriguez, 2010) [10].
Management constraints | |
Type of property | |
Suitability levels | Features |
Level (5) very high | Private individuals |
Level (1) none | Land in common use |
Land use and vegetation | |
Level (5) very high | Unused agricultural land |
Level (4) high | Marginal areas |
Level (4) high | Treated land |
Level (3) middle | Areas without vegetation |
Level (3) middle | Halophile and induced grassland |
Level (1) none | Crops, Livestock, forestry |
Subject to flood land | |
Level (5) very high | Flood safe zones |
Level (1) none | Flood prone zones |
Natural phenomena: The occurrence of hurricanes and earthquakes in the region is an important consideration when planning the construction of photovoltaic energy structures. These structures should support a minimum wind speed of 150 kmh and have a solid foundation for earthquakes.
Restrictions by natural phenomena | |
Hurricanes (on the Saffir-Simpson scale) | |
Suitability levels | Features |
Level (5) very high | Category 0 to 1 |
Level (4) high | Category 1–2 |
Level (3) Media | Category 2–3 |
Level (2) low | Category 3–4 |
Level (1) none | Category 5 |
Earthquakes (in degrees Richter scale) | |
Level (5) very high | Size 0–2 |
Level (4) high | Magnitude 2–3 |
Level (3) Media | Magnitude 3–4 |
Level (2) low | Magnitude 4 to 5 |
Level (1) none | Greater than 5 magnitude |
4. Factor Assessment
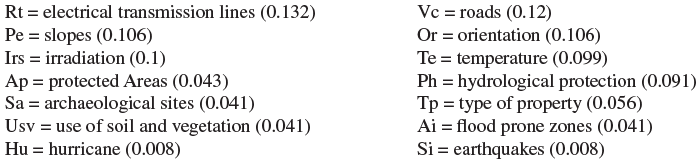
This study places great importance on the selection of the most viable sites available. In fact, site selection is considered the most important factor. Other important considerations include electric transmission lines, the location of roads, slopes, orientation, and irradiation. A comparative values procedure was drawn up by Saaty (12). This is a procedure that employs a 'method of analytical hierarchy' and is used in the Expert Choice application. By applying the Super Decisions program, an assessment of the relative importance of the criteria is made with the use of the model below. A good result (an inconsistency of 0.07828), which ensures reliability, was obtained from the procedure. The inconsistency index must always be less than 0.1 .
5. Equation
The equation results from the sum of the weighted and normalized variables and is multiplied by the degree of suitability.
The main selection of the variables is first made by using an economic feasibility assessment. Then, techniques, restrictions, and environmental impacts are considered.
Weighting is required to make decisions on obtaining a value or indicators, which are classified according to their relative importance. (Romero, 1996) [13]. Standard units tend to be very different, therefore, they should be normalized according to the following formula:
Normalization of the criterion - value of the criterion/ (best-worst value)
6. Simulation
In order to test and adjust the model, a simulation was developed using a Quantum GIS 2.16 program. By combining a superposition of layers with previously defined variables, a functional and realistic map is created, which illustrates appropriate and feasible locations for solar plant installations.
Maps are used with various polygons in the program and reflect data drawn from different variables. A blue polygon is used to represent a buffer zone for transmission networks and roads. In this case, a 1 km buffer zone is used. Likewise, areas most suitable for slopes of 0 to 4 degrees (indicated by pink polygons), as well as south-facing areas positioned at $180^{\circ}$ (green polygons), are also defined. Loreto is a very small region, so information regarding municipal temperatures and irradiation do not appear due to the fact that there are no significant differences in this area. When the polygons are layered over each other or intersected, the resulting surface area (yellow polygons) emerges. The size of the combined areas suitable for solar plant installations is calculated to be 288.1 square kilometres ( 179 square miles, or $1.62 \%$ of the Loreto region).

There is evidence that solar field installations on two hectares (4.9 acres) can produce one megawatt per hour. Thus, it is calculated that $14,403.35 \mathrm{MWh}$ could potentially be generated in this region. This amount would be well above Loreto's current electrical demand. The region's enormous potential for developing renewable energy should attract the attention of Mexico's political leaders interested in achieving environmental sustainability in the state, as well as investors eager to take advantage of these vast, untapped resources.
7. Discussion
Loreto does not have its own power plant, so all of its energy must be supplied by power plants in the La Paz area, 217 miles away. Having a small solar energy plant in the region would eliminate the problematic dependency on energy supplies from outside of the area. It would also provide important energy security and would significantly reduce pollution in the state. And given that the economy is based mainly on tourism, it would provide real opportunities for environmental sustainability in the region.
This model is applicable to any region, and can be modified or changed to accommodate the particular conditions of an area, as long as the following conditions to ensure a sustainable energy system are met:
That it is theoretically sustainable; that its construction is possible within the limits of current technology, and where the critical elements of its operational system are not compromised.
That it is economically viable. The project will consider environmental and social considerations as a part of its economic viability.
That it is socially sustainable. The community must accept the project and be willing to collaborate in its development, with the idea in mind that community participation fosters social development.
That it is environmentally sustainable. The renewable energy project will provide environmental benefits to the community, unlike traditional energy plants, which cause environmental damage.
The data used to support the findings of this study are available from the corresponding author upon request.
The authors declare that they have no conflicts of interest.