
Acadlore takes over the publication of IJEPM from 2025 Vol. 10, No. 3. The preceding volumes were published under a CC BY 4.0 license by the previous owner, and displayed here as agreed between Acadlore and the previous owner. ✯ : This issue/volume is not published by Acadlore.
Cultural Impacts on Occupant Behaviour and Energy Efficiency
Abstract:
Canadian cultural and consumer trends have established high household energy consumption rates, as compared to other first world nations. This study examines the correlation between cultural influence, occupant behaviour, and the resulting effectiveness of optional or mandatory energy efficiency strategies in Canadian homes. Energy efficiency has historically been approached from a design and construction perspective; however, monitoring and verification during a post-occupancy period has gone largely undocumented. Given the lack of data, the effectiveness of any policy or standard towards sustainability is difficult to quantify. In two case studies, located in Calgary, AB (Canada), the impacts of housing typology, construction methodology and occupant behaviour were researched to collect post-occupancy energy use data. The results of the first case study demonstrate a +300% variation in consumption rates when comparing same unit type, location, construction and solar photovoltaic array. A second case study examines a home designed to be Net-Zero Energy (NZE), which is coupled with renewable technology and subsequently monitored post-occupancy, then compared to modelled/predicted loads. A third case, which strives to reduce both operational and embodied energy pre- and post-occupancy, is examined to illustrate the pre-occupancy energy required by various standard and alternative construction materials. This paper aims to provide context and validation of energy efficient design, construction, standards/codes, and in conjunction with occupant behaviour or cultural patterns of consumption. The results strive to identify which strategies may ultimately have more impact on national goals of energy efficiency and carbon reduction, and whether or not top down policy can be an effective way of managing energy use in households.
1. Context
Globally, Canada produces roughly 5% of crude oil and 4.6% of Natural gas (2015). The Canadian oil and gas industry ranks 3rd and 4th in the world for exports, respectively. The country is rich in other resources, being the second largest producer of hydro-electric energy in the world (and 7th for renewable energy all around) but is lesser known for these energy sources [1].
The oil and gas industry is directly and indirectly responsible for the creation of more than 740,000 jobs; 4.2% of the national population. At an individual household level, the fossil fuel economy supports millions of people, and in many areas (Alberta in particular) a family’s livelihood could be entirely dependent on a thriving oil and gas economy. Often unrecognized, is the value the industry adds to the provincial and federal budgets. Royalties alone, the government collected over 11 billion dollars from 2015 to 2016 [1].
Primary industry has a direct correlation with carbon emissions as a result of processes for extracting, transporting and refining energy. As various governments work to diversify industry and reduce dependence on fossil–fuel-derived energy, there remains another culprit for high emissions and consumption rates in Canada. Looking specifically at household consumption and construction, there is evidence that initiatives to reduce energy dependence and emissions need to start at the molecular level - home.
A thriving oil and gas industry is often fraught with other challenges, such as combatting carbon footprint and greenhouse gas emissions. In 2014, the country's population was 35.54 million people and was responsible for nearly 555 million tonnes of $\mathrm{CO}_2$ emissions (15.6 million tonnes (Mt) per capita). Comparatively, France saw $4.3 \mathrm{Mt} /$ capita, the UK at $6.3 \mathrm{Mt} /$ capita and the United States at $16.2 \mathrm{Mt} /$ capita) [2].
Financial dependence within a family unit, coupled with high availability and low cost of energy in the country, has created little financial incentive for individuals and homeowners to make significant changes to their consumption habits or carbon footprint at a household level.
According to the 2013 census, Canadian households consumed 1.4 million terrajoules of energy, and that number was on the rise from 2011 [3]. In 2011 ( 2016 values to be released in May 2017), single family detached dwellings made up over $55 \%$ of homes ( $64 \%$ in Alberta) [4]. The statistics translate, in many urban centres, to a pattern of sprawl and satellite cities.
As the population continues to steadily grow, additional housing units are being added in relatively the same manner as neighbourhoods were developed for the last half century. Low density, predominantly single family homes in commuter suburbs are the norm in most of urban Canada. Residential construction accounted for 43 billion dollars of Canada's gross domestic profit in 2016 [5]. There is a strong financial incentive for many businesses and industries to maintain the status quo of home construction. Households are responsible for $321,727 \mathrm{Kt}$ of GHG emissions (direct and indirect) and this figure does not evaluate embodied carbon of home construction prior to occupancy [6].
Household income and demographics show interesting trends in energy consumption. Households earning less than 20k/year use 60.4 GJ while households that earn 60-80k (middle class, average income earners) use 89.6 GJ , and households earning 150k or more use 140.6 GJ [7]. Although not directly stated, it is fair to assume that size of home is a contributing factor to this trend.
So it begs the question, where do we start to decrease our footprint and energy consumption rates? If individuals are contributing across the spectrum (at work, home and in the marketplace), where can the most impact be had? This is the question that provincial and federal governments are still grappling with. Provincially, incentives, rebates, and policies all differ and try to approach the challenges of energy efficiency slightly differently in both punitive- and reward-based systems. One such example is the Alberta carbon tax (introduced 2017) and rebate program for insulation, LED lighting and high efficiency hot water heaters in existing homes.
It could be argued, that understanding how, where and when households use the most energy should drive the policy and incentive structure. In a cold climate, it is well known that household heating requires a large proportion of the energy but beyond that there is little data available from monitoring and assessment post-occupancy. This paper examines some of the trends noted in research at the Southern Alberta Institute of Technology and applies lessons learned to recommendations for optimal top down approach, in the form of incentives or policies, to curb emissions and improve energy efficiency across a broad scale.
2. Case Studies
Three case studies are presented to illustrate energy efficiency measures both pre-post occupancy and analyze their effectiveness and greater value towards carbon emission and energy use reductions at a household level.
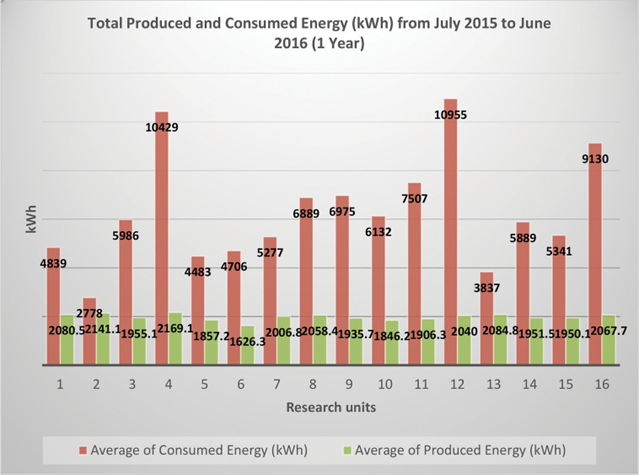
Case study #1 presents 16 units (4 fourplexes) constructed in Southern Alberta in the same manner, with similar (if not identical) unit layouts and relatively similar solar photovoltaic arrays mounted on the roof of all four buildings. The data collected analyzes energy produced vs. energy consumed on an individual unit basis. All units have been designed and constructed to meet building code standards prior to the 2016 implementation of Section 9.36 which saw an increase in minimum required thermal performance and building air-tightness, through either modelled or prescriptive compliance paths. The primary material used for insulating was mineral wool between structural members.
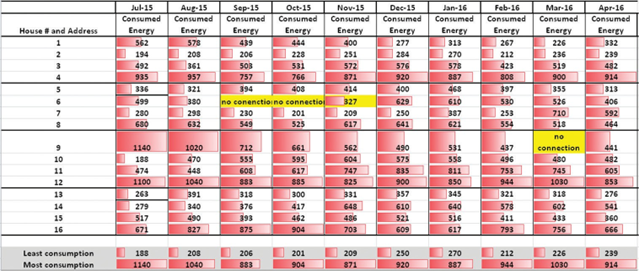
Denser developments and multi-family units have inherently less roof area and solar access when compared to single family detached dwellings. The ability for each unit to produce the full amount of energy required to offset consumption is limited, as can be seen from the results of this study. On an annual basis, units offset a maximum of $21 \%$ of their consumption, while some units saw as low as $6 \%$ based on a 1.5 kW capacity photovoltaic array (refer to Table 1). It should be noted that this study aimed to compare production values of slightly different racking systems in slightly different site conditions, and as such the efficiency of PV systems varies by $\sim 10 \%$ across all systems throughout the year. However, regardless of production values the trends noted in consumption were among the most significant realizations of the research. During 1 month, one unit used 277 kWh (Unit 1) of energy, while a directly comparable unit in the same fourplex used 920 kWh (Unit 4). Across all 16 units, the pattern of disparity holds as can be seen in Table 2. Further investigation of the $\sim 330 \%$ variation between both units revealed occupant behaviour as the predominant factor and resulted from household differences in temperature set-points, use of in floor heating, hours of electronics operation (televisions, etc.) and frequency of use of major appliances (such as dishwasher, dryer, etc.).
The average energy use across all 16 units was just under $500 \mathrm{kWh} /$ year and $215 \mathrm{kWh} /$ year generation. Factors that affected data collection and energy generation included severe hail storms in 1 month, and monitoring device connectivity failures at sporadic times which affected two units at most per month.
 |
|---|
 |
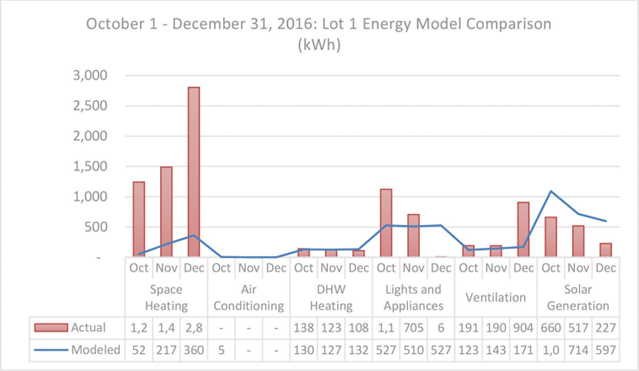
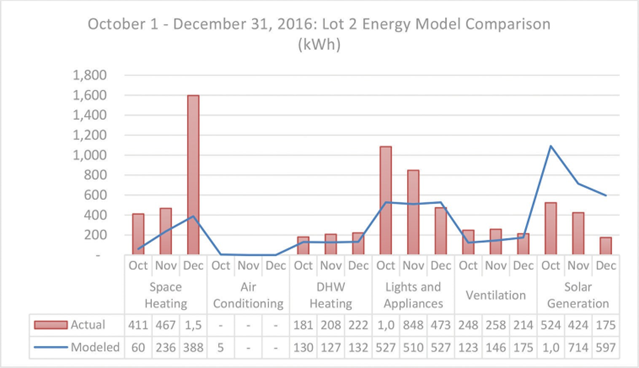
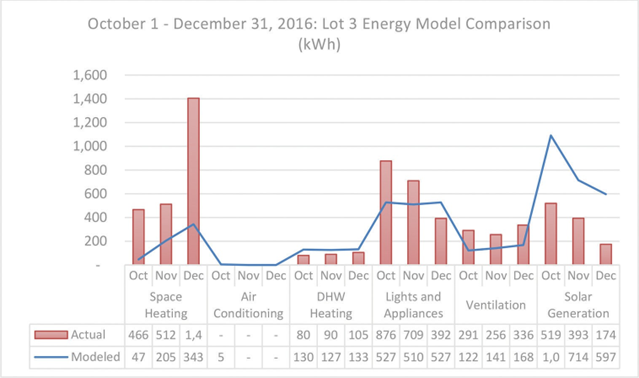
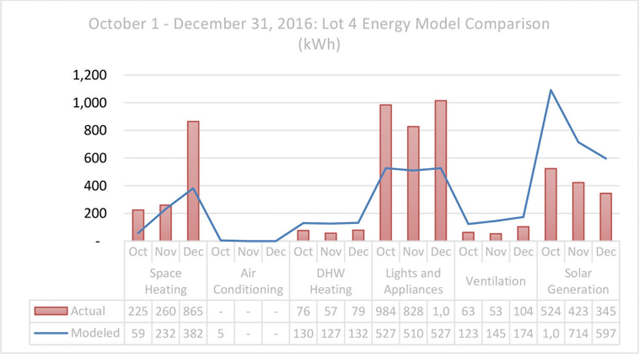
Case study #2 presents five single family homes constructed to a Net-Zero Energy standard, using conventional and modern building materials. The case study highlights the variation between modelled energy use and actual household consumption across five similar single family dwellings in the same location with identical construction materials and methods, also equipped with equivalent roof mounted solar PV arrays. The primary materials used for insulating were extruded polystyrene (continuous layer) and fiberglass batt between structural elements.
The average variation between modelled and actual energy consumption required during a 3 -month period is demonstrated in Table $3-7$ below. Of this, occupants had most direct impact on lights, appliances and plug loads within the home, and indirectly on space heating loads through temperature set points and ventilation rates. In all five cases, space heating loads exceeded modelled loads excessively during the month of December. This may have resulted from air source heat pump (ASHP) which has a COP of $1: 1$ at days below $-30^{\circ} \mathrm{C}$, coupled with a colder than average month based on local weather data used in the modelling software. More likely, however, it is the result of incorrect electrical wiring of the units mechanical systems to perform as designed, and adoption of relatively new to market technology which has not been verified for use in the Alberta climate.
 |
 |
|---|
 |
|---|
 |
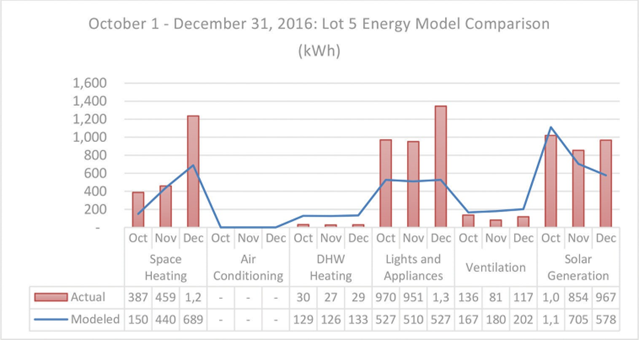 |
Other contributing factors include occupants leaving electric resistance heaters in garages on 100% of the time when only designed for occasional use, and higher than modelled temperature set-points. Corrective action through building commissioning has pin-pointed the source of discrepancy and provided the feedback loop critical to correct construction deficiencies and inform homeowners where they may be using more energy than required. Had the project not included a monitoring period post-occupancy, the homes would have continued to operate at levels far exceeding their ability to achieve NZE and the average homeowner would have been unaware that the home was not operating properly, and corrective action was needed. Future reporting is expected to show less variation between modelled and actual loads.
Case study #3 presents a unique home which has been designed to reduce both operational and embodied energy. Designed to meet a NZE standards, using alternative materials such as straw bale and rammed earth, the home is a one of a kind single family design and currently under construction.
The value of energy saved operationally will be monitored during a post-occupancy period, and therefore actual data are not yet available for the home.
The home is roughly half the size of the other case studies presented by this paper, and the assemblies differ substantially in materials and form (with the exception of the roof). The primary insulation for walls of the home is structural grade straw bales. Materials were sourced as locally as possible and minimized the use of Portland cement wherever possible, while still ensuring structural stability and fire rating requirements were met. The primary insulation material for exterior envelope is a building grade bale. Oak Ridge National Laboratories (1998) carried out ASTM test standard C1363 to determine the current industry accepted value of R1.45 per inch for straw bales [8]. At 23.5 inches per bale, the effective R value is R33.5. To further improve the thermal performance of the wall assembly, an exterior wrap of mineral wool is set between a $2 \times 6$ structural post and beam frame. The complete wall assembly achieves an R50 effective value necessary to meet the NZE target.
The predominant construction materials of all three case studies have the following embodied energy (EE) and embodied carbon (EC) values:
Material type (density in kg/m3) | Physical properties | ||
EE (MJ/kg) [9] | EC (kgCO2/kg) [9] | R-Value/cm* | |
Mineral wool (32) | 16.60 | 1.20 | 1.57 |
Expanded polystyrene (14) | 109.20 | 3.45 | 1.97 |
Polyurethane/Polyisocyanurate rigid foam (4) | 101.50 | 3.48 | 2.36 |
Straw (115) | 0.24 | 0.01 | 0.57 |
Fibreglass batt | 28.00 | 1.35 | 1.30 |
The data shows, that despite better thermal performance per unit of thickness ( 4.14 times higher for plastics derived polyisocyanurate), the embodied energy is $27.6 \mathrm{MJ} / \mathrm{m}^3$ for straw bale and $4060 \mathrm{MJ} / \mathrm{m}^3$ for rigid foam; equating roughly 147 times higher. Embodied carbon of straw bale follows a similar trend, in comparison to plastic-derived insulators. Other popular materials, such as mineral wool have substantially less impact ( $\sim 15 \%$ that of plastics) and achieve a relatively high insulation value comparative to embodied energy per cubic metre.
This information is not readily available and sourced through one single reference, making it almost impossible for end-users or builders to understand the impact of their material choices without engaging specialized consultants. Thorough analysis of complex and hybrid wall systems often requires energy modelling, life cycle analysis and building science professionals during design and construction; often at a prohibitive cost to homeowners. The added costs of such an analysis and the lack of familiarity with alternative building materials at a trades level is likely the root cause for lack of uptake of particular methods and materials. Currently, rebates are structured around value of energy saved compared to a code-built or existing standard and do not take into account the embodied energy and carbon required for building materials. Many industries are dominated by very few manufacturers who have undergone the required testing for commercial sales and as a result, choice is limited and often mandated by budget.
3. Interpretation and Analysis
In all cases, the most significant impacts and strategies for reduction come prior to construction and are primarily affected by volume of conditioned space, and building envelope air-tightness. Limiting heat loss and air infiltration reduces heating loads substantially. Material selection to improve thermal performance is critical to the success of secondary measures.
Occupant loads have the greatest impact on variable energy consumption values. In general, the order of operations for design of NZE homes is (1) Reduce consumption (through scale, orientation and form). (2) Improve building envelope. (3) Improve mechanical efficiency. (4) Add renewable energy generation to offset consumption.
This order of operations is critical to the success of energy reduction in households both new and old. Incentives that work in reverse (i.e. adding solar PV to existing, poorly insulated homes) will be inherently less effective and typically cost more to implement. The International Living Future Institute accepts the following values for materials required for production of photovoltaic panels [10]:
- Monocrystalline 242 Carbon $\mathrm{kg} \mathrm{CO}_2$ per $\mathrm{m}^2$
- Polycrystalline 208 Carbon $\mathrm{kg} \mathrm{CO}_2$ per $\mathrm{m}^2$
- Thin film 67 Carbon $\mathrm{kg} \mathrm{CO}_2$ per $\mathrm{m}^2$
In Canada, 1 kWh of electricity generated, produces $150 \mathrm{~g} \mathrm{CO}_2$. In Alberta, the number is substantially higher at $820 \mathrm{gCO}_2 / \mathrm{kWh}$ [11]. The emissions created per panel show that long term, it is still more environmentally responsible, however, that is not to say that it comes without an environmental cost worth consideration.
Occupant behaviour has shown a lack of education and awareness regarding building design and operation both pre and post-occupancy. Consumer education and feedback loops specific to individual household use is necessary to encourage voluntary changes.
4. Conclusion
Each case study illustrates specific factors for consideration in developing meaningful policy, incentives and strategies for the reduction of national energy consumption and emissions. No single strategy is sufficient to make sweeping impacts; however, it alludes to where government incentives may be more valuable for new and existing homes. From the data and design data collected in these three projects, the following conclusions may be derived:
- In existing homes, the greatest potential for initial reduction should be occupant behavioural changes and secondary strategies should target the improvement of existing envelopes but not until the end of that material lifecycle (unless using materials with a low embodied energy and carbon value).
- In new homes, construction should focus on scale and envelope design (including the prioritization of low EE and EC materials), and then follow the NZE design order of operation, adding renewable generation technology sparingly and based on energy modelling.
- Use of low impact materials should be encouraged and leveraged through rebate programs, increased development of manufacturing and material processing which achieves lower EE and CO2 emissions and incentives for use of locally sourced and manufactured products to expand and diversify consumer options.
- Energy modelling has substantial value in a design optimization aspect; however, modelling has less value if not followed by commissioning, and monitoring to assess true value of performance and provide occupant feedback loops regarding specific patterns of behaviour.
Consumption patterns are reflective of several cultural factors including: dwelling type and design, household income, climate, predominant regional industry and cost of conventional energy to consumers. While general information is known, specific energy use and emissions patterns have not been widely published or reported on. This paper acknowledges the interdependence between global economies, regional industries and the connection between household income (including source) and subsequent energy use and emissions patterns. The complexities of such interdependence requires a careful, methodical approach for any top down strategy to analyze the widespread consequence of drastically altering any one aspect of household life either pre or post-occupancy.
The data used to support the findings of this study are available from the corresponding author upon request.
Tom Jackman, Jeremie Ryan & Tyler Willson (Southern Alberta Institute of Technology) Lance Olson, Wendy Wright & Habib Gonzalez (Industry partners of Southern Alberta Institute of Technology).
The authors declare that they have no conflicts of interest.