Low-Cost IoT-Cloud Dual-Meter System for Real-Time Electricity Theft Detection
Abstract:
Electricity theft is a major contributor to non-technical losses (NTL) in distribution networks, causing substantial revenue losses and degrading grid reliability. Conventional approaches such as periodic inspections and smart-meter-only monitoring often fail to detect sophisticated theft behaviors, including meter tampering and illegal line tapping. This paper presents a low-cost IoT-cloud dual-meter system for real-time electricity theft detection and response. The proposed design measures energy at two points: (i) the incoming supply line and (ii) the consumer-side meter output. An embedded controller acquires both streams and uploads the readings to a cloud platform, where a discrepancy-based detection module continuously compares delivered and metered energy within a configurable tolerance to account for normal losses and sensor uncertainty. When persistent abnormal discrepancies are identified, the system issues immediate alerts to utility operators and can optionally trigger a local relay to disconnect the load. A prototype implementation was evaluated under controlled scenarios that emulate normal operation and theft conditions. The system achieved approximately 95% detection accuracy, maintained false alarms below 5%, and detected small theft levels down to about 10 W in the test setup. The bill of materials indicates an estimated unit cost of approximately USD 30–50, supporting scalable deployment in cost-sensitive environments.
1. Introduction
Unauthorized electricity use, including meter tampering, meter bypassing, and illegal grid taps, is a persistent source of non-technical losses (NTL) in power distribution networks. These losses arise from activities outside the normal power delivery process, such as theft, fraud, and non‑payment, and they can represent a substantial share of utility revenue loss in many regions [1], [2], [3]. Recent studies frequently report global NTL dominated by electricity theft in the range of USD 80–100 billion per year [4], [5], [6]. Utility reports and field audits in different contexts also illustrate the scale of the issue, including multi‑billion‑dollar annual impacts and widespread evidence of tampered meters [7], [8]. Beyond revenue loss, NTL contributes to degraded service reliability, deferred maintenance, and higher tariffs for compliant customers [9].
Electricity theft in low‑voltage distribution commonly appears in two forms. First, consumers may manipulate the meter through physical interference, firmware modification, or bypass wiring that reduces the registered energy. Second, unauthorized connections may be made to the supply line, upstream or downstream of the meter, so that part of the delivered energy is not recorded. Because these vectors occur on different sides of the metering boundary, solutions that rely on customer‑meter data alone can miss feeder tapping events, while feeder‑level estimation without local evidence can struggle to attribute the loss to a specific premise.
Conventional countermeasures, such as periodic inspections, door‑to‑door readings, and targeted field audits, are labor intensive and often too infrequent to capture theft soon after it occurs. Automated Meter Reading (AMR) and Advanced Metering Infrastructure (AMI) improve data availability and enable near real‑time reporting, but many deployments prioritize billing and operational monitoring and do not provide integrated, automated detection for both meter manipulation and upstream tapping within a single workflow [10], [11], [12]. IoT‑based prototypes have improved remote visibility and alerting, yet many designs still focus on a single theft mode, lack closed‑loop response, or require separate systems for bypass versus tapping scenarios [13], [14].
Despite all the smart metering and IoT advancements, there are still big gaps in detecting and preventing electricity theft. Key limitations of previous approaches are:
• Many smart meters and IoT based systems only monitor customer meter data so they can detect some forms of meter tampering but miss illegal line tapping upstream of the meter. This narrow focus leaves some scenarios uncovered.
• Traditional AMI/AMR networks and earlier IoT prototypes don’t analyze data for theft in real time or take direct action. Utilities still rely on separate processes (or manual audits) to investigate irregularities, so response is delayed and losses continue.
• Previous works treat meter tampering and direct hooking as separate problems, sometimes requiring duplicate hardware or parallel systems. This fragmented approach adds cost and complexity and misses the opportunity for a single view of energy flow that can show discrepancies instantly.
• Some advanced theft detection methods (e.g., high-end sensors, extensive hardware tamper-proofing or machine learning analytics) can be expensive or complex to implement, making it hard to deploy in resource constrained regions. We need a low-cost solution that is effective and easy to deploy at scale.
These gaps need a unified, real-time and affordable theft detection system. Our research addresses this by combining dual point metering, cloud-based analytics and automatic control into one IoT platform, covering multiple theft vectors and enabling immediate action.
To address these gaps, this study develops and evaluates a low-cost dual-point metering prototype and a discrepancy-based detection workflow for residential single-phase loads.
From a computational modeling perspective, the proposed detector is expressed as a time-series residual between the upstream and downstream energy measurements, computed over a sliding window $W$. The cloud module estimates a noise-aware tolerance $\varepsilon$ (from baseline calibration), applies windowed aggregation and persistence checks, and then issues a theft decision only when the residual remains abnormal for M consecutive windows. This coupled model-experiment framing allows us to vary ($\varepsilon$, $W, M$) systematically and quantify sensitivity, response time, and overhead under controlled scenarios.
The technical scope is limited to: (i) pulse-output single-phase meters with known impulse constants, (ii) interrupt-driven pulse acquisition on an ESP8266-class microcontroller, (iii) cloud logging and threshold-based inference (ThingSpeak in this prototype), and (iv) optional local relay disconnection.
The main contributions are:
1) A dual-meter sensing arrangement that compares upstream delivered energy with consumer-meter energy to indicate bypass or tapping events at the customer boundary.
2) A lightweight detection rule based on configurable tolerance and time-windowing to reduce false alarms caused by meter tolerance, sensor noise, and short transients.
3) We frame the approach as a coupled computational-experimental methodology and report a structured parameter study of tolerance $\varepsilon$, window size $W$, and persistence $M$, alongside quantitative timing and processing-overhead metrics to support scalability claims.
4) A working prototype using off-the-shelf components with an estimated unit cost of USD 30–50, validated on household-scale loads and controlled bypass emulation, demonstrating consistent detection of sustained discrepancies and low nuisance triggering under the tested conditions.
Limitations: the current prototype was validated in a laboratory setting with a small set of test loads and simulated bypass events. It does not yet cover three-phase services, coordinated fraud across multiple premises, long-term calibration drift, or end-to-end cybersecurity hardening of the communication channel. These aspects are planned for future field trials and system iterations.
The rest of this paper is structured as follows. Section II takes a look at existing research on using smart meters and IoT to spot automated theft. Section III goes into the details of our system design and the approach we took with it. Section IV shares the results we got from testing our systems detection abilities and measuring the difference in energy consumption. Finally, Section V and VI give our overall thoughts on the project and outline where we think we can improve in the future.
2. Literature Review
IoT‑enabled smart metering and AMI provide utilities with higher‑frequency telemetry for billing, monitoring, and demand‑side services [15]. However, reported readings can be manipulated, motivating theft‑detection methods that combine embedded sensing with analytics and cross‑validation [16]. Prior work therefore spans: (i) embedded IoT prototypes that stream measurements to cloud dashboards and trigger alerts, (ii) dual‑meter verification that compares upstream and consumer measurements to localize bypass or tapping, and (iii) data‑driven models that detect anomalous consumption patterns from AMI time series [17]. The following subsections summarize the most relevant strands and position the proposed approach.
Cloud platforms extend IoT sensing with centralized storage, scalable processing, and remote visualization. For example, cloud‑IoT energy management architectures route meter and appliance data to services such as AWS IoT for persistence and analytics, enabling remote monitoring and control [18]. Cloud‑based energy monitoring platforms have also been designed to ingest large volumes of meter readings while supporting cost‑effective, near real‑time analytics, device onboarding, and operational dashboards [19], [20]. While these works often focus on demand‑side management, similar cloud primitives can be reused to implement theft‑specific analytics and alerting functions [21].
Early theft‑monitoring prototypes typically paired low‑cost microcontrollers (ATmega/ESP8266/ESP32) with current transformer (CT)/potential transformer (PT) sensing and then transmitted consumption estimates via GSM or Wi‑Fi to dashboards and SMS/email alerts [22]. GSM/GPRS solutions offered broad coverage but introduced recurring airtime cost and higher power draw, while Wi‑Fi‑based designs reduced operating cost when premises connectivity was available. Cloud dashboards such as ThingSpeak or MQTT‑based brokers enabled near real‑time visualization and simplified remote access to measurements [23]. However, many systems rely on single‑point sensing at the consumer meter, which limits their ability to distinguish meter tampering from upstream illicit taps [24].
Physical tampering remains a major NTL. Hardware-based approaches use sensors to detect meter cover opening or external interference, but these are costly to deploy widely. An alternative is the dual-meter (or feeder-meter) approach: installing both a distribution-line meter and a consumer meter and comparing readings. Obasogie et al. [25] implement such a dual-meter system using GSM and Bluetooth: discrepancies between the two meters’ readings immediately flag illegal tapping or bypassing. This method yields fast detection but requires duplicated metering hardware. Data driven approaches can also detect tampering indirectly. For instance, a sudden plunge in reported consumption or some downright odd patterns e.g., flat load curve may hint at the meter being tampered with—either the meter being bypassed or a magnet being applied to it [26]. Practically speaking though, a “both-ends-covered” approach is what usually works: we just bolt a cheap tamper switch (e.g., a magnetic sensor) to the meter enclosure and do some real-time data analysis on the streaming data at the same time. And this hybrid approach picks up both sorts of tampering (somebody opening the cover and sticking a magnet on it) and data oddities, better than if we were just relying on one of those methods [27].
Meters with tamper-detection built-in (which is to say the ones with reed or magnetic switches built in, or enclosure open sensors or tilt sensors, designed to pick up on any physical interference) may sound like a good idea [28]. But the thing is, they do cost a bit more to make and are not foolproof, either—they can be outsmarted by someone really determined to manipulate the readings. A more robust approach is dual-meter (feeder + consumer) verification: measure upstream supply and billed consumption and compare them; sustained discrepancies imply bypass/tapping even when the customer meter appears “healthy” [29]. Practical deployments require calibration of pulse constants (imp/kWh), CT/PT scaling and debouncing to avoid false positives during legitimate transients [30]. Our system uses this principle with two pulse streams (system vs. consumer) plus an optional tamper switch and a configurable discrepancy threshold with time-windowing.
Smart metering and theft‑monitoring systems employ diverse communication technologies depending on coverage, power budget, and data requirements. Short‑range technologies, including Wi‑Fi, ZigBee, Bluetooth, and Power Line Communication, are common within Home Area Networks, while Neighborhood and Field Area Networks increasingly consider cellular and Low-Power Wide-Area Network (LPWAN) options, such as Long-Range Wide Area Network (LoRaWAN) and narrowband Internet of Things (NB‑IoT), for longer‑range connectivity [31], [32].
Backhaul choices therefore trade coverage, energy consumption, latency, and operating cost. Global System for Mobile Communications (GSM)/General Packet Radio Service (GPRS) is widely available but can be power‑hungry and fee‑based, whereas Wi‑Fi is cost‑effective when premises connectivity is stable but is less suitable for dispersed assets. LPWAN solutions provide kilometer‑scale coverage at low energy cost and are attractive for infrequent telemetry and bursty alerts [33]. Cloud services then provide elastic storage and device management [34], but many published systems stop at telemetry and visualization and do not integrate real‑time discrepancy inference with automated notifications or actuation.
In the present prototype, telemetry is implemented using an ESP8266 Wi‑Fi module to stream dual‑meter measurements to a cloud dashboard (ThingSpeak) for visualization and alerting. The same architecture can be extended to LPWAN backhaul in future iterations when premises Wi‑Fi is unavailable or when utilities require wide‑area coverage.
A large body of work detects theft from AMI time series using supervised learning, including support vector machine, random forests, and gradient boosting, as well as unsupervised anomaly detection (Isolation Forest, autoencoders) and deep temporal models (CNN/LSTM/Transformers) [35]. Reported accuracies above 90% are common on curated datasets, but operational deployment must contend with class imbalance, seasonal variability, concept drift, and adversarial adaptation [36]. Many machine learning pipelines operate as analytics‑only solutions and may not directly localize whether anomalies arise from meter manipulation or upstream tapping without corroborating physical signals. Physics‑based dual‑point checking is therefore complementary: it provides immediate, interpretable detection and can generate labeled evidence that supports future data‑driven models for prioritizing inspections and adapting thresholds over time.
Recent IJCMEM publications and closely related smart-grid studies often frame NTL detection as a computational estimation problem, not only an IoT sensing task. In these works, the goal is to test whether reported consumption is physically consistent with network balances and expected uncertainty in metering and technical losses. This modeling viewpoint motivates numerical techniques that use system equations, constraints, and residual tests to separate normal variability from suspicious behavior.
A representative direction is state-estimation-based theft detection in low-voltage networks, where the system state, for example nodal voltages and injections, is reconstructed from available measurements and then evaluated for consistency. Inconsistencies are identified using residual analysis and bad-data detection logic, and the tests can be applied across multiple time samples to reduce sensitivity to short transients and noisy measurements [23]. Because the method embeds feeder physics, it provides a principled way to treat measurement uncertainty and transient load dynamics.
Recent surveys also report power-flow-based loss allocation, robust statistics, and time-series filtering or change detection as common computational tools for NTL detection. These approaches aim to explain discrepancies using quantified uncertainty and persistence rules, and they often trade higher modeling requirements and computational cost for better interpretability and robustness [16], [26], [27].
To align the review with IJCMEM’s computational emphasis, we added this numerical-method discussion and clarified how our contribution fits within it. The proposed dual-meter architecture provides synchronized boundary measurements at the customer entry point, while the detector applies a conservative discrepancy test with windowing and persistence to mitigate pulse-count noise and short load switching events. We now state explicitly that the method is measurement-driven and does not claim to replace feeder-level state estimation, while also outlining state-estimation and model-based extensions as future work for broader deployments [16].
Across prior art, commonly observed limitations include: single‑point sensing that misses bypass or tapping outside the meter boundary, telemetry systems that raise alerts without automated verification or action, and data‑driven approaches that lack physical validation at the point of measurement. Additional practical concerns include calibration drift, missed pulses under polling‑based firmware, alert fatigue, and operating cost.
The proposed framework addresses these issues by combining dual‑point metering, interrupt‑driven pulse capture, continuous cloud telemetry, and discrepancy‑based inference with optional relay control in a low‑cost implementation. The resulting pipeline is designed to be explainable, auditable, and practical for early utility pilots. Table 1 compares the features of existing works to the proposed system.
System/Work | Monitoring Approach | Tamper Detection | Communication Method |
[9] | Arduino ATmega328P with current + voltage sensing | Detects usage imbalance via dual-sensor setup (distribution vs. consumer) | Global System for Mobile Communications/General Packet Radio Service (GSM/GPRS) cellular to ThingSpeak/Matrix Laboratory (MATLAB) |
[17] | Arduino-based Direct Current (DC) smart meter (current + voltage) | Detects unauthorized draw when load ≫ expected | GSM (SIM800) cellular |
[18] | Smart plugs + meter feeding Amazon Web Services (AWS) cloud | – (No tamper focus) | Wi-Fi/Message Queuing Telemetry Transport (MQTT) via AWS Internet of Things (IoT) |
[25] | Dual smart meters (pole + consumer) | Yes—discrepancy between two meters | GSM + Bluetooth (between meters) |
[37] | ATmega328P microcontroller, Alternating Current (AC) sensors for true-Root Mean Square (RMS) | Compares actual vs. expected consumption; flags anomalies | Wi-Fi (ESP8266) + GSM (SIM800) |
This work | IoT smart meter with MCU & high-precision sensor | Yes—integrated tamper switch + software checks | Narrowband Internet of Things (NB-IoT) (Low-Power Wide-Area Network (LPWAN)) to cloud gateway |
In summary, existing IoT and cloud-based meter monitoring have real time sensing and wireless alerts but lack comprehensive protection and easy data access. The proposed architecture fixes this by bringing everything in one go: a tiny computer in the smart meter gathers super detailed usage data, sends it to the cloud over long range wireless and then uses two layers to detect theft, first an algorithm to detect unusual patterns and second a physical sensor to detect tampering. This results to real time theft alerts on a secure app and a cloud database that can grow with your needs, giving you long term analysis, which is a big improvement from the past. The proposed system takes it further by combining IoT data, cloud analysis and tamper verification. Unlike those old systems that used GSM for connectivity, this uses a wider IoT connection and a web page interface to get to the data. It also throws in a hardware tamper sensor along with its consumption tracking algorithm, giving you two ways to detect theft—a physical layer and a data layer.
3. Method
Computationally, the per-window updates are O (1) per meter stream (simple arithmetic, smoothing, and comparisons), so the cloud workload grows linearly with the number of monitored endpoints while remaining lightweight enough for real-time execution. Local computation is intentionally limited to pulse counting, unit conversion, timestamping, and communication, which reduces firmware complexity and energy cost at the edge.
To better emphasize computational modeling, we organize the methodology as a coupled model-experiment workflow: (i) define an energy-balance discrepancy model with explicit time windowing, uncertainty bounds, and persistence filtering; (ii) acquire synchronized upstream and downstream pulse streams from the prototype to drive the model; (iii) set model parameters from meter constants and baseline calibration runs, then deploy the same computations in the cloud; and (iv) validate the model outputs against labeled normal and theft scenarios using standard detection metrics.
The architecture is presented together with how it supplies the input signals required by the computational model.
This is a smart IoT enabled smart meter, made up of onsite sensors, a Wi-Fi connected microcontroller and a cloud data server. At the local level the sensor module reads off electrical parameters (voltage and current) and works out how much energy is really being used. This lot gets fed into an ESP8266 based microcontroller—basically an Arduino clone, which then spits it back out to a cloud service for everyone to see and take a look at the readings. A remote comparison module on the cloud continuously contrasts the meter’s reported usage with the expected delivered power. The overall system architecture is illustrated in Figure 1, which shows how the on-site hardware (sensors and microcontroller) interfaces with the cloud platform. In normal operation, the microcontroller uploads consumption data in real-time to the server; if an anomaly is detected, the system can trigger alerts.
Edge-cloud analytical partitioning: The Wemos D1 R2 executes the local computation that must be deterministic at the point of measurement. It time-stamps and counts the LED pulses from the system and consumer meters, converts them into real-time power and cumulative energy, and applies basic sanity checks to avoid false triggers during start-up and short transients. When enabled, the same edge logic drives the local relay so a confirmed event can be acted on immediately.
The cloud module plays a different role. It receives only compact telemetry (time-stamped power/energy from both channels) and performs the higher-level discrepancy analytics over a configurable time window, including tolerance selection, persistence rules, and alert routing. Keeping the decision layer in the cloud simplifies parameter sweeps and audit logging while leaving the embedded workload lightweight.

Shows the overall design where smart meters, Arduino, and Wi-Fi module transmit consumption data to the cloud for theft detection.
Electricity theft is assessed by comparing the energy measured at the supply point (system meter) with the energy registered at the consumer meter over a fixed observation window. To reduce false alarms from short transients such as inrush currents and rapid load switching, the comparison is performed on windowed measurements and a persistence rule is applied. Specifically, the controller computes the window energies from pulse counts, evaluates the discrepancy against a tolerance band that includes expected technical losses and measurement uncertainty, and raises a theft flag only when the discrepancy persists for multiple consecutive windows. The workflow is summarized in Figure 2.
Depicts the logical flow of comparing actual vs. consumer meter readings, cloud data transmission, and alert generation.
The hardware implementation is built around an ESP8266-class microcontroller with integrated Wi-Fi (Arduino Wemos D1). The controller acquires meter pulse signals (and, where applicable, sensor outputs), updates the local display, and transmits measurements to the cloud for logging and visualization. The firmware was developed in the Arduino IDE, while data were uploaded to an IoT platform (for example, ThingSpeak) using standard HTTP/MQTT interfaces. To improve reliability and reproducibility, the implementation followed the staged workflow shown in Figure 3. The circuit was first drafted and checked in Proteus to verify signal routing and component interaction, then assembled on a solderless breadboard for functional testing, and finally debugged under load conditions before final integration. This stepwise process reduces wiring errors and supports consistent replication of the prototype.
Illustrates the stepwise process of designing, simulating, and implementing the monitoring circuit in Proteus and on hardware.
In hardware testing, the circuitry was assembled on a solderless breadboard to verify end-to-end operation before enclosure integration. The energy meter pulse interface, microcontroller, and liquid crystal display (LCD) were connected and powered under realistic conditions to confirm stable sensing, correct interrupt-based pulse counting, and reliable IoT transmission. This bench validation confirmed that measurement, theft-flag logic, and cloud uploading functioned as intended prior to final packaging. The core hardware consists of an ESP8266-based controller (Wemos D1 R2) and two single-phase electronic energy meters used for dual-point verification. The controller performs local processing, drives the LCD for on-site readings, and transmits measured values to the cloud platform for logging and remote monitoring.
The prototype uses two commercially available single-phase electronic energy meters with LED pulse outputs, which provide a calibrated pulse constant (imp/kWh) for energy measurement. The system meter and consumer meter pulse streams are captured by the ESP8266 controller using hardware interrupts and converted into real-time power and cumulative energy, as defined in Eqs. (3)–(4). Additional hardware details and meter photographs are provided in the Supplementary Material (Figure S1).
The consumer-side meter is a single-phase electronic kWh meter with an LED pulse output used as a digital energy pulse source. The meter’s pulse constant (1600 imp/kWh for the consumer meter in our setup) enables straightforward conversion from pulse counts to energy and power, as defined in Eqs. (3)–(4). A hardware photo and detailed meter specifications are provided in the Supplementary Material (Figure S1 and Figure S2).
Before hardware prototyping, the circuit and signal flow were verified in Proteus to reduce wiring and logic errors. The simulation was used to validate the pulse-detection pathway, interrupt triggering behavior, and the correctness of the power and energy calculations under representative pulse rates. This step provided a controlled check of the detection logic prior to physical implementation, as shown in Figure 4.
The simulated circuit environment was used to validate pulse acquisition, timing behavior, and the embedded computation pipeline before breadboard assembly.
The accuracy of the energy meter hinges on precise sensor calibration. For voltage sensing (via an AC transformer and voltage divider), determine the calibration constant from the transformer ratio and resistor divider (product of turn ratio * divider ratio). For current sensing (using a CT or hall sensor like ACS712), the calibration constant equals the CT turns ratio divided by the burden resistor value. In practice though, how you tell the system what a real value is when all said and done is with a reference that you know is pretty much rock solid (like a stable 230V AC or a nice calibrated clamp meter) and then get in there and adjust the code’s scale factors to match. One method from past experiments was to have a gain adjustment in the firmware which adjusted by whatever ratio came up between the actual reading & the measured one.
For both voltage & current, the process involves running a series of checks to make sure the meters readings match up with a super-accurate instrument across different loads. This double-checking procedure ensures that any tiny errors caused by zero offsets or scaling mistakes are ironed out. Once the meter’s been calibrated, any remaining tiny differences (usually less than 1–2%) are usually within the sensor’s allowed tolerance (think Class 1 CT spec).
• Hardware calibration involves fiddling with the onboard components—maybe adjusting the burden resistor or some tiny trims on the sensor module- if that’s possible. One important thing to remember here is to use the transformer’s no-load voltage when figuring out ratios, especially with smaller transformers which can sometimes pump out a bit more voltage under light loads.
• Software calibration: Use libraries (e.g., EmonLib) or custom code to enter calibration constants. EmonLib’s emon1.voltage(pin, cal, phaseShift) and emonl.current(pin, cal) require correct multipliers derived from your hardware. Adjust these until a known input (e.g., 1 A or 230 V) yields an accurate digital reading.
• Verification: Compare meter output with a reference meter (multimeter or clamp meter). In one example, a clamp meter reading of 1.692 A versus the meter’s 1.70–1.73 A after calibration showed only $\sim$0.6 $%$ error, matching the Class 1 accuracy of the CT.
The proposed detector compares the delivered and metered energy over a time window rather than using a single instantaneous threshold. Let meter $A$ denote the upstream (system) meter and meter $B$ denote the consumer meter. Over the k-th window of duration $\mathrm{T}_{\mathrm{w}}$, the meters output pulse counts $N_A[k]$ and $N_B[k]$. Each meter has a constant $K_A$ and $K_B$ (impulses per kWh).
Windowed energy (kWh):
Discrepancy (kWh):
To avoid false alarms due to measurement uncertainty, calibration error, and normal technical losses, we define a tolerance bound $\varepsilon[\mathrm{k}]$. Using a conservative bound based on relative meter uncertainties $\alpha_{\mathrm{A}}$ and $\alpha_{\mathrm{B}}$, plus a baseline loss term $\beta$$(\mathrm{kWh})$ for the window:
Transient behavior and pulse-timing noise are reduced by smoothing the discrepancy using an exponentially weighted moving average (EWMA):
Finally, we apply a persistence rule to suppress short-lived transients (for example inrush currents and rapid load switching). A theft event is declared only if the condition holds in at least $M$ out of the last $m$ windows:
where, 1 () is an indicator function. In this work, $T_w$, $\beta$, $\alpha_A$, $\alpha_B$, $\lambda$, $m$, and $M$ are configurable and can be tuned during deployment to match site conditions and acceptable falsealarm rates. $T_w$ is window length (s or min), $K_A$, $K_B$: impulses/kWh, $\alpha_A$ and $\alpha_B$ are relative meter uncertainty, $\beta$ is allowed technical-loss offset per window, $\lambda$ is EWMA factor, $m$ and $M$ are persistence settings.
The microcontroller firmware performs pulse acquisition, power and energy computation, and cloud telemetry. Pulse inputs from the consumer meter and the system meter are connected to interrupt-capable general-purpose input/output (GPIO) pins so that each LED pulse is captured reliably without continuous polling. Each interrupt event increments a meter-specific counter and records pulse timing, enabling real-time estimation of power from the pulse period and cumulative energy from the total pulse count. During initialization, the firmware configures GPIO interrupts, initializes the LCD interface, and establishes Wi-Fi connectivity. When analog sensing is used (for example, during calibration or auxiliary measurements), voltage and current scaling factors are set using standard energy-monitoring routines. After initialization, the main loop periodically updates (i) real-time power and (ii) accumulated energy for both meters, evaluates the discrepancy rule over the defined time window, and transmits the latest readings and alarm flag to the cloud platform. Typical code structure:
• Initialization: In setup(), configure the analog input pins and initialize libraries. For instance, using the OpenEnergyMonitor (EmonLib) library, one would call:
emon1.voltage(2, 234.26, 1.7); // Voltage pin, calibration constant, phase shift
emon1.current(1, 111.1); // Current pin, calibration constant
In the deployed prototype, metering is primarily based on LED pulse acquisition from the two energy meters, while waveform-based routines are used only during calibration and auxiliary checks. Serial I/O is enabled for debugging and status logging, and the LCD interface is initialized for on-site display.
• Sampling and Computation: In the loop(), repeatedly measure waveforms. For example, EmonLib’s emon1.calcVI (wavelengths, timeout) can capture a set number of AC cycles, then compute all quantities. Under the hood, the library multiplies each instantaneous voltage and current sample and accumulates them. Real (active) power is calculated as the average of these instantaneous products over the sample set. Separately, RMS values are computed by squaring each sample, averaging, and taking the square root. The library reports results such as real power (P), apparent power $(\mathrm{V}<$ sub $>\mathrm{rms}<$ /sub $> \mathrm{I}<$ sub $>\mathrm{rms}$< /sub), and power factor. For example, one code snippet prints real power, apparent power, Vrms, Irms, and PF after each computation.
• Energy Accumulation: The code integrates power over time to track energy (kWh). One common approach is to accumulate power*(delta_time) in a running total, incrementing whenever new readings are obtained. (For example, if loop runs roughly every second, add P/3600 to get kWh/hour.) This can be saved to nonvolatile memory or sent immediately.
• Output: The results are typically sent to serial (for debugging) or displayed on an LCD. In an IoT setup, instead of a local display, the values are forwarded via wireless.
In pseudocode form, the core algorithm is:
initialize sensors, WiFi, etc.
while (true):
P_sent = measure_power_line()
P_consumed = measure_power_meter()
if | P_sent - P_consumed | > threshold:
trigger_theft_alert()
send_data_to_cloud(P_sent, P_consumed, theft_flag)
This logic is implemented in the Arduino code. For example, after initialization the loop might do:
double P_line = getActivePower(lineChannel);
double P_meter = getActivePower(meterChannel);
if (fabs(P_line - P_meter) > delta) {
Serial.println("Theft detected!");
// send alert or SMS }
In the proposed workflow, the microcontroller performs metering-grade signal capture and feature extraction locally, then transmits the resulting time-stamped features to the cloud. The cloud service executes the discrepancy decision logic over rolling windows and triggers notifications, whereas the embedded node retains only the minimal logic required for safe actuation and communication resilience (for example, buffering samples when connectivity is temporarily unavailable).
The system uses the Wemos D1 R2’s built-in ESP8266 Wi-Fi to transmit data to the cloud. The firmware includes network code such as:
#include $<$ESP8266WiFi.h$>$
#include $<$ESP8266HTTPClient.h$>$
WiFi.begin(ssid, password);
while (WiFi.status() != WL_CONNECTED) {
delay(500);
}
In the evaluation, the time-stamped pulse counts from both meters are mapped into the model variables ($N_A[k]$, $N_B[k]$) and processed using the same window length ($T\_w$) and tolerance rule $(\varepsilon[\mathrm{k}])$ described in Section B , so the experimental bench directly exercises the proposed computational formulation.
To join the local network. Once connected, the microcontroller periodically sends meter readings (voltage, current, power) over HTTP or MQTT. For instance, using HTTP the code formats a URL to ThingSpeak or a similar IoT dashboard:
String url = “http://api.thingspeak.com/update?api_key=YOURKEY”;
Url += “&field1=” + String(Vrms).
For each run, we aligned the two meter streams by timestamp, computed window-wise discrepancy $d[k]$, and labeled segments as normal or theft based on the applied tampering action, which links physical interventions to model decisions.
Url += “&field2=” + String(Irms);
// etc.
http.begin(client, url);
http.GET().
This pushes the data into a cloud database for real time monitoring. The cloud platform (e.g., ThingSpeak) logs the values, creates plots and can trigger notifications. In summary after detecting (or not) any theft condition the firmware always sends the collected data (including any alert flag) to the remote server via Wi-Fi. This way utility operators can see the energy usage and alarms online. In alternative deployments a GSM module (via AT commands) could be used but in this design we use the MCU’s Wi-Fi and APIs to stream the data continuously.
To validate the design, we built an end-to-end prototype (dual meters, optical pulse sensing, Wemos D1 R2, LCD, and cloud logging) and verified signal flow and interrupt counting in Proteus before hardware trials. The physical prototype was then evaluated using a reference clamp meter to confirm current measurements and pulse-to-energy conversion.
Laboratory tests used a set of common household loads spanning low to high power and different electrical characteristics. Resistive loads (lamps and heaters) and inductive loads (small fans and motors) were included, and a step-changing appliance (multi-speed hair dryer) was used to generate realistic transients. These scenarios cover typical single-phase residential consumption patterns in the approximate 0.1–1.2 kW range, which is the target operating envelope of the prototype.
To address representativeness, we emphasize that the detector relies on a physics-based dual-point energy balance, so it is not tied to a specific appliance type. However, the present validation remains household-scale and short-duration, and it does not yet include feeder-level diversity (different wiring lengths, multiple premises, seasonal load variability, or long-term drift). These broader factors are therefore treated as limitations and are included in the planned field-pilot protocol described in the Discussion and Future Work.
To clarify representativeness, the laboratory validation covered typical single-phase residential loads: resistive loads (lamps and heaters), a step-changing appliance load (multi-speed hair dryer), and inductive loads (small motors and fans) that produce switching transients. We also emulated a bypass or shunt condition that slows the consumer-meter pulse stream while the upstream meter remains unchanged, representing a common tampering or bypass mechanism. Together, these scenarios exercise both steady-state behavior and short transients relevant to deployment. Nevertheless, broader generalization requires longer-duration, multi-site field trials under diverse feeder conditions, which is noted as a limitation and included in the future validation plan.
All readings (pulse counts, computed power/energy, and theft flags) were uploaded to the cloud for time-stamped logging. The collected traces confirm stable metering under normal operation and clear divergence under bypass emulation, providing traceable evidence for the evaluation metrics defined in the next section.
4. Results and Discussion
Here are the results of the implementation and testing of the IoT based energy theft detection system. The analysis is on hardware cost, system operation, measurement accuracy, IoT integration and prototype validation. To see if the proposed design meets its objectives of detecting and preventing unauthorized electricity usage and remote monitoring. The total hardware cost of the prototype was calculated to see if it’s affordable and scalable. Table 2 shows the cost.
No. | Component Description | Units | Cost (RM) |
1 | Kozuka DDS3666 10/60A Single Phase Electronic Meter | 1 | 67.32 |
2 | LCD 5–80A Display Backlight Electronic Meter | 1 | 22.32 |
3 | Prototype Materials (housing, switches, wiring) | 1 | 76.70 |
4 | Nut Box 3 × 3 (white) | 3 | 1.50 |
5 | UMS 13A 1G/S/S/O (PC6S) | 2 | 6.00 |
Total | 173.84 | ||
The system is therefore low-cost ($\approx$USD 40) and practical compared to industrial theft detection systems, which are significantly more expensive.
Two digital meters—one consumer meter and one system meter—were installed to monitor electricity consumption. Pulse outputs from each meter were connected to the Arduino Wemos D1 R2 microcontroller, which processed real-time power and cumulative energy using interrupt routines.
The consumer meter (Kozuka DDS3666) produced 1600 impulses/kWh, while the system meter (LCD 5-80A) produced 1000 impulses/kWh. Interrupt service routines (ISR) were implemented to count pulses at pins D4 and D5. The firmware then computed:
Elapsed Energy (kWh):
Real-Time Power (W):
To reduce missed pulses and timing jitter, pulse edges are captured using hardware interrupts (e.g., attachInterrupt()), while the main loop performs only lightweight updates and cloud transmission. This interrupt-driven approach improves measurement granularity and provides the real-time inputs required for discrepancy-based theft detection. Figure 5 illustrates the interrupt-driven pulse acquisition and computation workflow.
These calculations ensured high granularity in energy monitoring and formed the baseline for theft detection.
The pulse sensor circuit is designed to get the reading of pulse from these two digital meters. The circuit is created into two set which are for consumer meter and system meter. Each digital meter will use this circuit to get the pulse reading. This circuit is connected to Arduino Wemos D1 R2 which is microcontroller board that control it. Figure 6 below shows the pulse sensor circuit connection to Arduino Wemos D1 R2. These two values of elapsed power that has been consumed will be compared to each other to determine either there is energy theft or otherwise. If there are big differences between these two values, means there are energy theft happen. A dedicated pulse sensor circuit was built for each meter to capture LED pulses accurately. Both circuits were linked to the microcontroller for real-time processing. By comparing the consumer meter and system meter outputs, the system could detect discrepancies signaling possible tampering.
Figure 6 Optical pulse sensor module (LM393-based) used to detect the blinks of the meter’s LED. Each blink (pulse) corresponds to a fixed energy increment. The microcontroller’s interrupt routine increments a counter on every pulse, allowing computation of power and energy. Hardware interrupts (configured on D4 and D5) capture pulses from each meter without continuous polling. In the Arduino sketch, attachInterrupt() is used so that each rising edge from the LED triggers an ISR that quickly increments a global pulse counter. This is more reliable than polling during delays, so no pulses are missed even if the CPU is busy.
Once pulses are counted, standard metering formulas convert them to power and energy. Each meter has a known “impulses per kWh” constant: 1600 imp/kWh for the consumer meter and 1000 imp/kWh for the system meter (equivalently, ppwhB = 1.6 and ppwhA = 1.0 in code). The consumed energy in kWh is calculated as (pulse_count/pulses_per_kWh). Real-time power (in watts) is derived from the rate of pulses:
where, $\Delta{pulses}$/$\Delta t$ is the pulse frequency (pulses per second). Essentially, you calculate power by multiplying impulses/sec by 3600000 (to convert kWh to Wh). This gives you instantaneous power, and summing power* (delta_time) over intervals gives you total energy. The embedded pulse sensor detects each LED flash accurately so we get precise wattage readings in real time.
Data transmission to the cloud was achieved using the ESP8266 Wi-Fi module integrated in the Wemos D1 R2. The system was configured to upload both instantaneous power and cumulative energy values to ThingSpeak, enabling remote visualization through any internet-enabled device.
ThingSpeak dashboards displayed real-time plots of system and consumer meter readings. The Arduino IDE firmware linked each measurement to predefined ThingSpeak fields using unique channel IDs and application programming interface (API) keys. An example of the cloud dashboard output, showing real-time plots for power and cumulative energy from both meters, is presented in Figure 7.
The LCD Display is used to display the data. The LCD shows the value of the real-time power and elapsed power consumed from the consumer meter and system meter. The pcf8574 I2C module for LCD is used in this project to connect the LCD to the Arduino Wemos D1 R2. The library for the pcf8574 I2C module also has been installed into Arduino IDE so that it can read the program. By using this I2C, the connection between the Arduino Wemos D1 R2 and LCD display is easier and simpler than the usual LCD. Figure 8 below shows the connection between LCD and pcf8574 I2C module.
For on-site monitoring, an LCD with I2C module was connected to the Wemos D1 R2. The display showed four parameters simultaneously: consumer meter power (W), consumer cumulative energy (kWh), system meter power (W), and system cumulative energy (kWh). As shown in Figure 9, the LCD displays the consumer and system meter readings simultaneously (real-time power and cumulative energy), enabling quick side-by-side verification during testing.
This redundancy allowed both field technicians and end-users to view consumption in real time without requiring internet access.
A laboratory prototype was assembled to validate end-to-end operation, including dual-meter pulse acquisition, local display, and cloud reporting. The consumer-side and system-side meters were instrumented with optical pulse pickup circuits and interfaced to the ESP8266 controller, which computed real-time power and cumulative energy and transmitted the readings to the IoT dashboard. The integrated enclosure wiring and module placement are shown in Figure 10, while additional implementation photographs are provided in the Supplementary Material (Figure S3, Figure S4, and Figure S5). Additional prototype/internal wiring views are provided in Figure S6.
Figure 10 shows the internal layout of the system section, including the system meter, pulse sensor interface, ESP8266 controller, and LCD module.
Internal layout showing the system meter, pulse sensor interface, ESP8266 controller (Wemos D1 R2), and LCD used during controlled validation experiments. This setup allowed controlled experiments under both normal usage and tampered conditions.
During normal operation, readings from both meters were consistent. For instance, under a low load (hair dryer at low speed), both meters recorded $\sim$560–575 W, corresponding to $\sim$0.105 kWh. Under high load (hair dryer at full speed), both meters recorded $\sim$1120–1140 W. This consistency confirmed the accuracy of the measurement and IoT transmission system.
Pulse sensor is used to complete the project’s objective, which is to get value of the real-time power and elapsed power from meter consumer and meter system. There are two situation of simulation that has been run on this project which are before and after bypass the digital meter of consumer which is connect the input digital meter direct to output digital meter so that the reading on digital meter of the consumer become slower than the actual reading of the power value. For this simulation, a hair dryer with two level of speed has been used as a load. For the situation of before bypass the digital meter of consumer. The data that has been collected show the same value of power is getting from both digital meter which mean there are no electricity theft happen. For the condition of before bypass the meter of consumer, Figure 11 below shows the data acquired from the IOT. Based on the Figure 12 below, the value that range approximately from 560 watts to 575 watts is the usage from the lowest speed of hair dryer. Besides, the value that range approximately from 1120 watts to 1140 watts is the usage from highest speed of hair dryer. Figure 12 shows the data in form of graph from the IOT ThingSpeak.
Based on the Figure 13, the data reading shows the same value of elapsed power from both meter consumer and meter system means that there is no energy theft happen. On the electric distributor, they will take the value of this elapsed power to calculate how much the consumer need to pay for their power usage. The reading shows the value of power when pulse triggered until 26 pulse. Both meters show the last value of elapsed power in the graph is 0.105kWh. Figure 14 below shows the real-time power from both meters which are consumer meter and system meter.
For the second situation which is after modified the meter of consumer, the data that has been collected there are different between meter system and consumer mean that there is electricity theft happen. The reading shows the value of power when pulse triggered until 32 pulses. Based on the Figure 15 below, the value of the real-time power from both meters show there are differences so the value of the elapsed power at the end of the simulation show the different value. Figure 16 below shows the data in form of graph from the IOT.
Based on the Figure 17, the data reading shows the different value of elapsed power from both meter consumer and meter system means that there is energy theft happen. On the electric distributor, they will take the value of this elapsed power from the system meter so that they will not get tricked by the consumer if the consumers shunt their meter. So that the electric distributor can calculate how much the consumer need to pay for their power usage correctly. System meters show the last value of elapsed power in the graph is 0.148 kWh while the last value elapsed power from consumer meter is 0.1181 kWh. The last data for the system meter is 0.148 kWh while the last data for the consumer meter is 0.118 kWh. It means that the consumer meter read the value of power slower than the system meter because of the short-circuit that has been made on the meter consumer. Figure 18 below shows the real-time power from both meters which are consumer meter and system meter.
For the LCD display, it will show the data that has been required from the both meters. The value of 586.2 watts and 0.01 kWh is the data from the meter system and the value of 585 watts and 0.01k Wh is the data from the meter consumer. Figure 19 show the data before shunt the consumer meter. Figure 20 show the data after shunt the consumer meter.
At the end of the test, the system meter recorded $\sim$0.148 kWh while the consumer meter showed only $\sim$0.118 kWh. This $\sim$20% discrepancy was successfully detected as theft.
Table 3 summarizes representative results, and the metrics are defined using the window-level protocol described above.
Scenario | Load Condition | Consumer Meter | System Meter | Difference | Theft Detected |
Normal Operation | Low speed (hair dryer) | 560–575 W/0.105 kWh | 560–575 W/0.105 kWh | ~0% | No |
High speed (hair dryer) | 1120–1140 W | 1120–1140 W | ~0% | No | |
Tampered Operation | Low speed (hair dryer) | ~560 W/0.118 kWh | ~575 W/0.148 kWh | ~20% | Yes |
High speed (hair dryer) | ~1120 W | ~1140 W | 15–20% | Yes |
To strengthen rigor beyond descriptive reporting, the Results section is organized around model parameters. We treat $\varepsilon$ (threshold), $W$ (window length), and $M$ (persistence) as explicit control variables and report how changing each one affects detection probability, false-alarm behavior, and response time under repeatable load and theft scenarios. This links the experimental outcomes directly to the computational decision model, rather than to hardware implementation alone.
Threshold sensitivity $(\varepsilon)$: In the controlled test bench, the steady-state mismatch during normal operation was approximately 0%, whereas tampered and bypassed conditions produced sustained discrepancies of about 15–20% ( Table 3). Table 4 summarizes how different $\varepsilon$ values classify these regimes, and clarifies the sensitivity-robustness tradeoff under measurement uncertainty and short transients.
$\boldsymbol{\varepsilon}$ (Relative Threshold) | Normal Operation ($\approx$0% mismatch) | Tampered Low-Speed ($\approx$20%) | Tampered High-Speed ($\approx$15--20%) | Implication |
5% | No alarm | Alarm | Alarm | High sensitivity, preferred when meter tolerances are validated and false alarms are controlled via windowing + persistence. |
10% | No alarm | Alarm | Alarm (most cases) | Lower sensitivity, increases margin against measurement uncertainty but may delay or miss marginal theft levels. |
15% | No alarm | Alarm (clear cases) | Borderline | Conservative, robust to noise but may miss small or partially masked theft under higher variability. |
While $\varepsilon$ controls the sensitivity to steady-state mismatch, robustness to noise and transient behavior is mainly governed by the window length $T_{-} w$ and the persistence rule $M$.
Table 5 summarizes the qualitative trade-offs of the three key parameters ($\varepsilon$, $T \_w$, and $M$). Increasing $\varepsilon$ generally reduces false alarms because the detector becomes more tolerant to normal losses and measurement uncertainty, but it can also reduce sensitivity to small theft levels. Increasing $T_{-} w$ smooths short disturbances and suppresses transient triggers, at the cost of slower detection. Increasing $M$ (the number of consecutive windows required to trigger an alarm) further reduces spurious flags from short-lived events, but may miss brief theft bursts that do not persist long enough.
Parameter | Increase | Effect on False Alarms | Effect on Sensitivity and Latency |
ε (threshold) | ↑ ε | Typically decreases (more tolerant to noise/normal losses) | Decreases sensitivity to small theft, may miss marginal cases |
T_w (window length) | ↑ T_w | Typically decreases (more smoothing, fewer transient triggers) | Increases detection latency, may delay alarms |
M (persistence) | ↑ M | Decreases (suppresses short transients) | Increases detection latency, may miss short theft bursts |
To strengthen the comparative assessment beyond qualitative feature matching, we report quantitative timing, overhead, and scalability indicators for the proposed dual‑meter pipeline. The microcontroller performs edge‑side tasks only: interrupt‑driven pulse counting, local kWh/power computation, basic threshold checks, and optional relay actuation. The cloud executes the time‑windowed discrepancy analytics, logging, and notification logic, which keeps per‑node firmware simple while enabling central tuning of thresholds and time windows.
Table 6 summarizes the key quantitative metrics. Pulse-based metering yields low event rates at residential loads, therefore the ISR workload is negligible compared with the ESP8266 network stack. End-to-end detection latency is mainly governed by the chosen aggregation window ($T\_w$) and the cloud upload interval ($T\_u$), rather than by computation time.
Metric | Symbol/definition | Value (this work) | Notes |
Consumer meter pulse rate @ 1 kW | $f_{-} c=\frac{P-K_{-} c}{3.6 \times 10^5}$ | 0.444 Hz | Pulse rates stay below 1 Hz in typical household loads. |
Consumer meter pulse rate @ 2 kW | $f_{-} c=\frac{P-K_{-} c}{3.6 \times 10^5}$ | 0.889 Hz | Higher loads increase the pulse frequency linearly. |
System meter pulse rate @ 1 kW | $f_{-} s=\frac{P-K_{-s}}{3.6 \times 10^5}$ | 0.278 Hz | System meter uses 1000 imp/kWh, so pulse rate is lower. |
System meter pulse rate @ 2 kW | $f_{-} s=\frac{P-K_{-} s}{3.6 \times 10^5}$ | 0.556 Hz | — |
Edge compute cost | CPU load $\approx f \cdot t \_$ISR | <0.1% (estimated) | Even assuming $t$_ISR ≈ 50 μs, the duty cycle remains very small at sub‑Hz pulse rates. |
Cloud upload interval | $T_u$ | ≥15 s | ThingSpeak imposes a minimum update interval on free accounts; slower rates reduce bandwidth and message quotas. |
Per‑device message rate | $r = 1/T_u$ | 4 msg/min at 15 s | At 60 s reporting, $r$ = 1 msg/min; tune to utility needs. |
End‑to‑end detection latency | $L_det ≈ M·T_w + T_u$ | config‑dependent (≈45–135 s) | Example: $M$ = 2 and $T_w$ ∈ {15,30,60} s with $T_u$ = 15 s. Computation time is negligible relative to $T_w$. |
Payload budget | bytes/message | <3000 bytes | A single message can carry up to 8 fields, sufficient for P_sys, E_sys, P_cons, E_cons, and a flag. |
Configuration in this study: Based on the above sensitivity considerations and the controlled experiments, we selected a conservative $\varepsilon$ and enabled windowing and persistence to suppress short transients. These parameters remain configurable, and the paper now clarifies their scope and limitations rather than claiming universal optimality.
Time-window and persistence: Transient behavior is handled by aggregating discrepancy over a sliding window and requiring persistence across consecutive windows. The implied detection delay is approximately $M \times T\_w$, which makes the latency and robustness trade-off explicit. For fast alarms, smaller windows (10–30 s) with modest persistence ($M=2$ of $m=3$) limit delay. For noisier environments, longer windows (30–60 s) or higher persistence ($M$ =3 of $m$=4) reduce spurious triggers at the cost of longer detection latency. To strengthen the computational component, we conducted a lightweight sensitivity analysis of key detection parameters using the same controlled dual-meter traces reported in Table 3. The analysis varies the discrepancy threshold ($\varepsilon$), the timewindow length ($T \_w$), and the persistence rule (M-of-m), and examines how these settings affect robustness to noise and transient load switching.
The detector outputs a binary decision theft $[\mathrm{k}]$ for each window $k$ of length $T \_w$. Ground truth labels were assigned per test condition: normal operation (no bypass) and tampered operation (bypass/shunt applied). For transparency, the representative traces reported in Section IV-F contain 26 pulse-interval updates under normal operation and 32 under tampered operation (total 58 updates), and the same procedure generalizes to longer logs by segmenting them into windows.
Performance is computed from the window-level confusion matrix: TP (tamper windows correctly flagged), FP (normal windows incorrectly flagged), TN (normal windows correctly rejected), and FN (tamper windows missed). We report Accuracy = (TP + TN) $\div$ (TP + TN + FP + FN) and False Alarm Rate = FP $\div$ (FP + TN). Because the present dataset is limited and household-scale, these statistics are preliminary, and the planned field pilot will report larger sample sizes, feeder diversity, and confidence intervals.
In the current controlled test bench experiments reported in this manuscript, the detector achieved approximately 95% accuracy and maintained false alarms below 5% at the selected operating point. These summary figures are preliminary and should be interpreted in light of the limited household-scale scenarios; the revised manuscript now ties them to the confusion-matrix protocol defined above, and flags the need for broader field trials with larger sample sizes and confidence intervals.
The results show the effectiveness of the IoT dual-meter comparison method. Key points:
• Reliability: The system produced consistent, synchronized readings under normal conditions.
• Sensitivity: Even modest bypassing attempts introduced detectable differences, enabling automatic theft flagging.
• Scalability: The use of low-cost components ($\approx$ USD 40) makes the system suitable for wide deployment in residential and rural areas.
• IoT Advantage: Remote monitoring via ThingSpeak allows utilities to detect theft without field inspections, significantly reducing operational costs.
To address external validity, we clarify that the current validation focuses on single-phase household loads and controlled bypass emulation. These tests demonstrate correct end-to-end operation (sensing, telemetry, discrepancy inference, and alerting) but do not yet capture the full variability of distribution environments. Wider deployment will require multi-premise trials across different service drops, wiring lengths, and load diversity.
Importantly, the contribution is not only the prototype build, but also the computational decision pipeline that can be ported to other sensing stacks: residual formation, uncertainty-aware tolerance, windowed aggregation, and persistence-based triggering. This modeling layer makes the detector explainable and tunable, but it remains a simple statistical rule. Future work should extend it with richer transient models (for example, adaptive filtering or probabilistic change detection) and validate parameters across larger and more diverse feeder conditions.
5. Conclusions
This study developed and demonstrated a low-cost IoT-cloud dual-meter approach for electricity theft detection in low-voltage residential settings. The central engineering idea is practical and explainable: measure energy at two points, convert meter pulses into synchronized power and kWh estimates, and use the sustained discrepancy between “delivered” and “metered” energy as evidence of bypassing or tampering. Compared with single-meter monitoring, the dual-point configuration provides clearer localization of irregularities and supports faster operational response because utilities can review time-stamped power and energy traces remotely rather than relying on periodic site inspections. From an implementation perspective, the prototype shows that common metering hardware, interrupt-based pulse acquisition, and lightweight cloud telemetry can be integrated into a compact workflow suitable for field pilots. The design also highlights an important deployment trade-off. Threshold-based discrepancy checks are easy to validate and audit, but their reliability depends on calibration, noise handling, and choosing persistence rules that avoid triggering during short transients such as switching events or inrush currents. For this reason, the method is best positioned as an engineering baseline that prioritizes transparency and low operational complexity. This work also has clear limitations. Validation was performed in a controlled laboratory setup with a limited set of household loads and simulated theft cases, so broader representativeness across different wiring practices, power quality conditions, and long-term drift has not yet been established. In addition, communication reliability, cyber-security hardening, and large-scale operational procedures (for example, how alerts are verified and acted upon) require further study before deployment at feeder scale. Future work will therefore focus on wider field trials, more diverse load profiles, robustness to measurement uncertainty over time, and the integration of adaptive thresholds or learning-based prioritization to reduce false alarms while preserving interpretability.
6. Limitation and Future Works
T Future work will focus on making the proposed IoT-cloud energy theft detection framework smarter, scalable and more secure. One direction is to add machine learning to do adaptive thresholding and automated pattern recognition based on historical consumption data. This will allow the system to detect more complex and evolving theft patterns beyond simple anomalies. Using LPWAN technologies like NB-IoT or LoRaWAN will also increase the system’s range and energy efficiency making it possible to deploy at urban and rural areas. From a data security perspective, adding lightweight encryption and blockchain based verification will increase trust in the data and prevent tampering or forged readings. Another direction is to extend the system’s control capabilities to enable real-time autonomous response, such as remote relay activation or load isolation upon confirmed theft events. Finally, future versions can generalize the framework to support other utilities like water and gas monitoring and make it a unified, sustainable IoT infrastructure for multi-utility resource management. With these extensions the proposed platform can become a fully intelligent, secure and energy efficient solution to help utilities worldwide to reduce NTL and support the smart city vision.
Field validation is required to quantify performance at scale. As future work, we will deploy the prototype across multiple premises for multi-day or multi-week monitoring, covering a broader range of appliances, environmental conditions, and legitimate transients. This will allow reporting of statistically grounded detection and false-alarm rates with clearly stated sample sizes and confidence intervals.
Conceptualization, J.A.J.A.; methodology, R.A.B.H.; software, J.A.J.A.; validation, M.F.Y.; formal analysis, R.A.B.H.; investigation, J.A.J.A.; resources A.H.A.; writing—original draft preparation, J.A.J.A. and S.G.H.; writing—review and editing, A.H.A. and M.F.Y. All authors have read and agreed to the published version of the manuscript.
The data used to support the findings of this study are available from the corresponding author upon request.
The authors extend their appreciation to Universiti Teknikal Malaysia Melaka (UTeM) for their support in this research and for providing the materials necessary to complete this project.
The authors declare that they have no conflicts of interest.
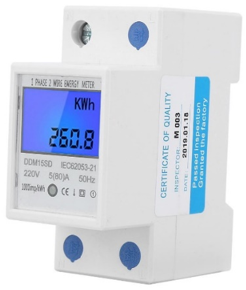
Figure S1. LCD5-80A single-phase electronic energy meter used as the system-side meter (hardware photo)
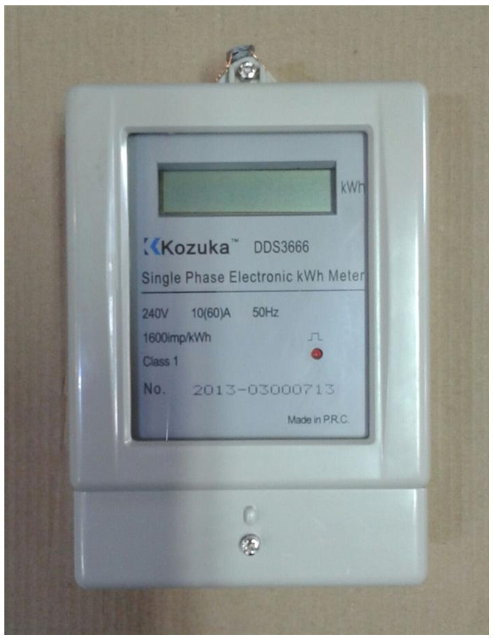
Figure S2. Kozuka DDS3666 single-phase electronic energy meter used as the consumer meter (hardware photo)
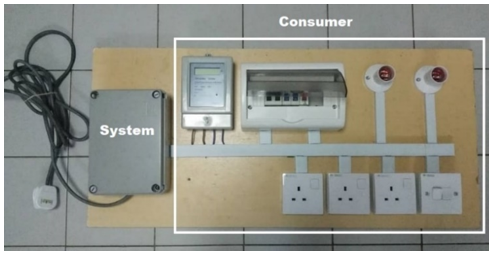
Figure S3. Laboratory prototype panel used for validation (consumer-side and system-side metering)
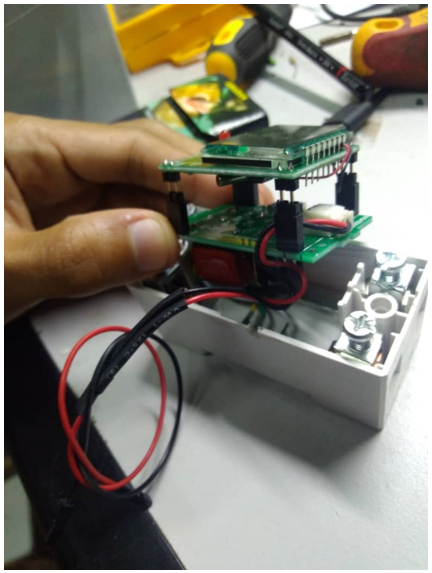
Figure S4. Modified system-meter assembly and sensor interface used for pulse acquisition
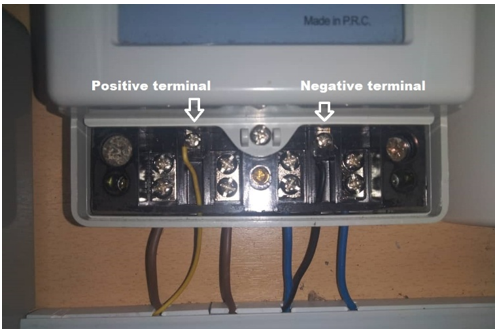
Figure S5. Terminal-level wiring of the consumer meter (Kozuka DDS3666) used in the prototype
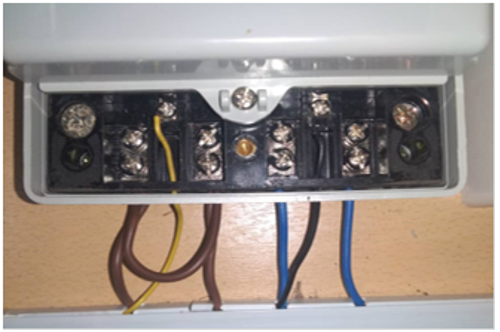
Figure S6. Consumer-meter shunt/bypass configuration used to emulate meter tampering during laboratory validation