Pulsed Laser Ablation-Derived ZnO-Fe2O3 Nanocomposites as Green Adsorbents for Phenol Removal from Aqueous Media
Abstract:
Phenol is a persistent and toxic pollutant in industrial wastewater, demanding efficient and sustainable removal technologies. Conventional treatment methods often suffer from high operational costs, incomplete degradation, and secondary contamination. In this study, ZnO–Fe$_2$O$_3$ nanocomposites were synthesized using pulsed laser ablation in liquid (PLAL)-a clean, surfactant-free, and environmentally benign route—to develop eco-friendly adsorbents for phenol removal. The structural, morphological, and optical characteristics of the as-prepared nanoparticles were examined using X-ray diffraction (XRD), scanning electron microscopy (SEM), UV-visible spectroscopy, and zeta potential analysis. The 50:50 ZnO–Fe$_2$O$_3$ composite demonstrated moderate colloidal stability (-28.54 mV), nanoscale crystallinity, and a heterogeneous surface morphology conducive to adsorption. Batch adsorption experiments at an initial phenol concentration of 100 mg/L revealed a maximum removal efficiency of 68.44% under 600 laser pulses after 50 minutes of contact time. The consistent optical band gap values (2.48-2.50 eV) across all samples indicated structural and electronic stability. The enhanced adsorption efficiency was attributed to synergistic interfacial interactions between ZnO and Fe$_2$O$_3$ within the nanocomposite matrix. Although the present work is limited to batch-scale trials under fixed conditions, future studies will investigate the effects of pH, adsorption kinetics, isotherm behavior, and material reusability. Overall, the findings highlight the potential of PLAL-fabricated ZnO–Fe$_2$O$_3$ nanocomposites as sustainable adsorbents for aqueous phenol remediation.
1. Introduction
Phenol is a toxic organic compound frequently detected in industrial wastewater, particularly from petrochemical, pharmaceutical, and plastics manufacturing industries [1]. Even at trace concentrations, phenol poses serious risks to both environmental and human health due to its high toxicity, persistence, and potential carcinogenicity [2]. Phenol contamination in water bodies leads to bioaccumulation, ecosystem disruption, and off-flavors in aquatic organisms, making its effective removal a critical environmental priority [3].
Traditional methods for phenol removal, including biological degradation (slow and pH-sensitive), chemical oxidation (generating chlorinated by-products and sludge), and membrane filtration (prone to fouling and high energy use), often face critical drawbacks. Examples of secondary pollutants include chlorinated phenols, halogenated organics, and toxic sludge residues [4], [5]. Unlike chemical methods, adsorption is a passive process that does not rely on added reagents, avoids secondary by-products, and is cost-effective for both large- and small-scale applications [6].
The integration of nanomaterials, particularly metal oxide nanoparticles, into adsorption systems has significantly enhanced the efficiency of phenol removal from wastewater. These materials exhibit high surface area, excellent reactivity, and tunable surface chemistry, making them superior to conventional adsorbents [7], [8]. Consequently, nanomaterial-based adsorption represents a leading-edge solution for the sustainable treatment of phenol-contaminated waters.
Nanoparticles, particularly metal oxides, have demonstrated significant potential in water treatment due to their high surface area, tunable surface chemistry, and remarkable reactivity [9]. Among these, zinc oxide (ZnO) and iron (III) oxide (Fe$_2$O$_3$) are two of the most widely studied materials. ZnO is valued for its strong adsorption and photocatalytic properties, attributed to its wide bandgap and high electron mobility, enabling the efficient degradation of organic pollutants such as phenols and dyes [10]. It has also been shown to significantly enhance the removal of bisphenol-A and other endocrine-disrupting chemicals when integrated with bio- or carbon-based matrices [11], [12], and even in advanced hybrid formats like ZnO/biochar nanocomposites [13].
Fe$_2$O$_3$ and its magnetic form, Fe$_3$O$_4$, are known for their chemical stability and easy magnetic separability. Magnetic Fe$_3$O$_4$/ZIF-8 nanocomposites, for instance, have achieved rapid and efficient phenol removal from water [14], while $\gamma$-Fe$_2$O$_3$/ZnO hybrids have also shown promise in removing pesticides such as chlorpyriphos [15] and pharmaceutical pollutants like tamoxifen [16].
ZnO-based nanocomposites have been further enhanced by combining ZnO with materials such as HZSM-5 zeolite or biopolymers to improve adsorption and photodegradation capacities. ZnO/HZSM-5 composites, for example, have demonstrated effective removal of nitrophenols through a synergistic photocatalytic mechanism [17], while other green-synthesized hybrids have proven highly efficient in degrading dyes and adsorbing heavy metals [18]. Studies have shown that using metal oxide hybrids with nanocomposites effectively removes phenol and other harmful pollutants in normal conditions [19], [20]. However, despite their effectiveness, many of these systems still suffer from challenges such as nanoparticle agglomeration, synthesis complexity, and limited scalability for industrial deployment [4].
While ZnO and Fe$_2$O$_3$ have been extensively studied individually, the synergistic benefits of combining them into binary nanocomposites remain relatively underexplored. However, early evidence indicates great promise: ZnO/ Fe$_2$O$_3$ nanocomposites have demonstrated high phenol degradation efficiency—up to 92.7%—in oilfield-produced water under solar irradiation, with performance influenced by calcination temperature, pH, and catalyst dosage [21], [22]. Similar multifunctional composites—such as GO/ Fe$_3$O$_4$-ZnO or Fe$_2$O$_3$/ZnO-biochar hybrids—have also achieved excellent results in dye and pharmaceutical removal applications [23], [24].
This underscores the growing interest in simpler, greener synthesis approaches—such as pulsed laser ablation in liquid (PLAL) [25], [26]—to develop ZnO–Fe$_2$O$_3$ nanocomposites that combine the best properties of both oxides while overcoming challenges related to cost, complexity, and operational durability. The novelty of this study is that pulsed laser ablation in liquid (PLAL) was used to synthesize ZnO–Fe$_2$O$_3$ nanocomposites without chemical precursors, stabilizers, or surfactants. This reduces the risk of impurity incorporation and avoids complex purification. Compared to conventional wet chemical synthesis, PLAL provides precise control over particle formation through laser parameter tuning, produces cleaner surfaces, and eliminates the need for post-synthesis washing or doping agents. Here, it is shown for the first time that PLAL-synthesized Fe$_2$O$_3$–ZnO nanocomposites are effective at adsorbing phenols and how their performance is related to their structure.
To date, there is limited research evaluating ZnO–Fe$_2$O$_3$ nanocomposites synthesized via green, surfactant-free techniques such as pulsed laser ablation in liquid (PLAL) for phenol adsorption. Most existing methods involve chemical synthesis routes that may introduce impurities or require stabilizers. Additionally, the correlation between structural characteristics (e.g., crystallite size, morphology, surface charge) and phenol adsorption efficiency in such composites remains poorly understood. This gap prevents the optimization of these materials for real-world wastewater treatment applications.
This study aims to synthesize and characterize ZnO–Fe$_2$O$_3$ nanocomposites using the environmentally friendly PLAL method and to evaluate their adsorption performance for phenol removal from aqueous solutions. By systematically analyzing their structural, morphological, optical, and surface properties, this work seeks to elucidate the structure–property–performance relationships in these nanocomposites and demonstrate their potential as effective and scalable water treatment adsorbents.
2. Materials and Methods
This section describes the synthesis of ZnO–Fe$_2$O$_3$ nanocomposites using pulsed laser ablation in liquid (PLAL), followed by physicochemical characterization and evaluation of their phenol adsorption performance. The structural, morphological, optical, and surface charge properties were analyzed using XRD, SEM, UV–Vis spectroscopy, and zeta potential measurements, respectively. Batch adsorption studies were carried out to examine the effects of contact time, nanoparticle concentration, and composite composition on phenol removal efficiency. All measurements were conducted under standardized laboratory conditions to ensure reproducibility.
A stock phenol solution (1000 mg/L) was prepared by dissolving 1.000 g of high-purity phenol (99%, BDH Chemicals Ltd, UK) in a 1 L volumetric flask. Initially, 50 mL of deionized water was added, and the solution was stirred for 20 minutes to ensure complete dissolution. The volume was then adjusted to 1 L with deionized water. This stock solution was used to prepare working solutions of desired concentrations.
To quantitatively evaluate phenol concentration, the absorbance measurements were carried out at a fixed wavelength of 270 nm, corresponding to the characteristic absorption peak of phenol. A series of phenol solutions were prepared at varying concentrations (10, 20, 30, 40, 50, 60, 70, 80, 90, 100 mg/L). The absorbance of these solutions was measured using a UV-Visible spectrophotometer (INOVIALAB, China), operating in the spectral range of 200-400 nm. All measurements were conducted in the Physics Department, College of Science, University of Anbar.

The calibration curve for phenol quantification based on UV–Visible spectrophotometric measurements at 270 nm is shown in Figure 1. The absorbance increases linearly with phenol concentration in the range of 10-100 mg/L, following the regression equation y = 0.0147 x + 0.113 with a coefficient of determination $R^2$ = 0.985, indicating excellent linearity and method reliability for subsequent adsorption analyses. The calibration curve was constructed according to Beer–Lambert’s Law, which relates absorbance (A) to concentration (C) through the equation:
where, $A$ is the absorbance, $\varepsilon$ is the molar absorptivity, $l$ refers to the path length (cm), and $C$ denotes to analyte concentration.
The adsorption of phenol from aqueous solution was studied using nanostructured adsorbents. The materials included:
$\bullet$ Iron(III) oxide (Fe$_2$O$_3$) in bulk form (HIMEDIA),
$\bullet$ Zinc oxide (ZnO) in bulk form (THOMAS BAKER).
Nanoparticles were synthesized via Pulsed Laser Ablation in Liquid (PLAL) using a Nd:YAG laser (Type: 00912901, Korean origin) operating at 300 mJ per pulse, a frequency of 6 Hz, and a wavelength of 1064 nm, with a total of 300 pulses. Two pulse counts—300 and 600—were selected to examine the effect of laser exposure on particle concentration and size. The 300-pulse condition was used to represent a lower nanoparticle yield, while 600 pulses corresponded to a higher dose of nanoparticles. These values were optimized based on preliminary trials to balance particle dispersion and energy use.
A volume of 4 mL of nanoparticle suspension was mixed with 4 mL of 100 mg/L phenol solution in a 10 mL vial. The vials were sealed and agitated in a shaking water bath at 20℃ for contact times ranging from 20 to 50 minutes. After each experiment, samples were centrifuged at 4000 rpm for 10 minutes (HERMLE Z200A) to remove suspended nanoparticles.
The absorbance of the supernatants was recorded using the same UV–Vis spectrophotometer described in Section 3.2. The equilibrium phenol concentration (Ce) was determined using the linear equation of the calibration curve:
The percentage removal of phenol (R%) was then calculated using the following equation:
where, $C_0$ is the initial phenol concentration (mg/L), $C_e$ is equilibrium concentration (mg/L), and $R$% is the removal efficiency.
In addition to the tests conducted using 300 laser pulses, all procedures were repeated with 600 pulses to investigate the effect of higher nanoparticle concentration on adsorption performance.
The optical absorption properties of the synthesized ZnO, Fe$_2$O$_3$, and ZnO–Fe$_2$O$_3$ nanocomposites were analyzed using UV–Visible spectroscopy. Absorbance spectra were recorded in the wavelength range of 300–600 nm using a UV–Visible spectrophotometer (INOVIALAB, China). All measurements were conducted at room temperature with quartz cuvettes of 1 cm path length.
The data were used to determine the optical band gap (Eg) of the samples through Tauc plot analysis for direct allowed transitions. The Tauc relation is given by:
where, $\alpha$ is the absorption coefficient, $h v$ refers to the photon energy, $B$ is proportionality constant, $E_g$ is the optical band gap.
Plots of $(\alpha h v)^2$ versus $h v$ were used to estimate the band gap energy by extrapolating the linear portion of the curve to the energy axis ($x$-intercept).
To investigate the structural properties and crystalline phases of the synthesized nanomaterials, X-ray diffraction (XRD) measurements were conducted using an Aeris Research Edition X-ray diffractometer (Malvern Panalytical, Netherlands) equipped with Cu-K$\alpha$ radiation $\lambda$=1.5406 A°). The measurements were performed over the 2$\theta$ range of 10° to 80°, with a scanning rate of 0.02°/s.
The acquired diffraction patterns were analyzed to:
$\bullet$ Identify the crystalline phases by comparing peak positions with standard JCPDS cards,
$\bullet$ Estimate the average crystallite size using the Debye–Scherrer equation:
where, $D$ is the crystallite size (nm), $K$ is shape factor (typically 0.9), $\lambda$ is the X-ray wavelength (nm), $\beta$ is full width at half maximum (FWHM) in radians, and $\theta$ is the Bragg angle (°).
The diffraction data also provided insights into phase purity, crystal structure integrity, and the effect of composite formation on peak broadening and microstrain.
The morphology, surface texture, and particle size distribution of the nanomaterials were examined using field-emission scanning electron microscopy (FE-SEM). Images were acquired using a field-emission scanning electron microscope (FE-SEM) model Inspect$^{\text{TM}}$ F50 (FEI, USA) operated at an accelerating voltage of 15 kV. Nanoparticle suspensions were drop-cast onto carbon-coated copper grids and dried under vacuum prior to imaging.
ImageJ software was used to analyze particle dimensions from SEM micrographs. The average particle size, aspect ratio, Feret diameter, and morphological uniformity were quantified by measuring multiple particles (n $>$ 40) per sample. Additionally, correlation analysis between shape descriptors (area, length, diameter, aspect ratio) was performed to assess anisotropy and geometric consistency.
Zeta potential ($\zeta$) measurements were performed to evaluate the colloidal stability and surface charge of the nanomaterials in aqueous media. The measurements were carried out using a Zetasizer Nano ZS (Malvern Instruments Ltd, UK), applying the electrophoretic light scattering (ELS) technique under the Smoluchowski approximation.
Nanoparticle suspensions were freshly prepared in deionized water and sonicated for uniform dispersion prior to analysis. Zeta potential values were recorded at 25℃, and three replicates were performed for each sample. A zeta potential magnitude greater than $\pm$30 mV was considered indicative of good colloidal stability, whereas lower absolute values suggested a tendency for particle aggregation.
Collectively, the applied characterization techniques provided a comprehensive, multi-dimensional perspective on how the physicochemical properties of the synthesized nanomaterials influence their adsorption performance. Each method offered a distinct yet complementary insight, allowing for a detailed correlation between structural, morphological, optical, and surface charge characteristics and the observed phenol removal efficiency.
All adsorption experiments were conducted in triplicate, and the results are reported as mean values with standard deviation (mean$\pm$SD) to account for variability and ensure reproducibility. The standard deviation (SD) was calculated to quantify the dispersion of the data around the mean, thereby providing a measure of experimental precision. In graphical representations, error bars corresponding to $\pm$1 SD were included to visualize the reliability and consistency of the measurements across replicates.
All statistical calculations, including mean values and standard deviations, were performed using Microsoft Excel 2016. Excel was also employed to generate plots and perform trend analyses. The use of Excel facilitated straightforward data handling and visualization, allowing for effective interpretation of experimental outcomes. The statistical reliability of the phenol removal data is supported by reproducibility through triplicate measurements, and comparable methodology has been validated in recent adsorption studies [27].
3. Results and Discussion
This section highlights the outcome from the synthesis and characterization characterization of zinc oxide–iron oxide nanocomposite and its adsorption application. The results are analyzed using X-ray diffraction (XRD), scanning electron microscopy (SEM), UV visible spectroscopy, and zeta potential measurements. In addition, the adsorption properties of phenol solution in different concentrations of nanoparticles and contact time concerning essential trends, the interaction effect, and the relationship between structure and function of the nanoparticles are elucidated.
X-ray diffraction (XRD) analysis was conducted to determine the crystal structure, phase composition, crystallite size, and microstrain of the synthesized materials. Table 1 presents the diffraction patterns of pure ZnO, pure Fe$_2$O$_3$, and the Fe$_2$O$_3$/ZnO nanocomposite synthesized via the pulsed laser ablation (PLA) technique. The corresponding crystallographic parameters are summarized in Figure 2.
The XRD pattern of ZnO displays well-defined and intense peaks at 2$\theta$ values of 31.85°, 34.51°, 36.34°, 47.64°, 56.70°, 62.96°, 68.05°, and 69.20°, which are indexed to the (100), (002), (101), (102), (110), (103), (112), and (201) planes of hexagonal wurtzite ZnO (JCPDS card no. 36-1451). The sharpness and high intensity of these reflections indicate the formation of a highly crystalline material with no detectable secondary phases or impurities.
Crystallite sizes, calculated using the Scherrer equation, range from 27.6 nm to 44.3 nm, with an average around 38 nm. The (101) plane exhibited the highest relative intensity (41.6%) and a crystallite size of approximately 42.3 nm, suggesting preferential orientation along this plane. Microstrain values across the observed peaks ranged from 0.18% to 0.40%, indicating relatively low lattice distortion and defect density, consistent with high-quality nanocrystals.
The XRD pattern of Fe$_2$O$_3$ exhibits characteristic peaks at 2$\theta$ $\approx$ 24.78°, 33.76°, 36.24°, 41.54°, 50.07°, 54.68°, 63.04°, and 72.49°, corresponding to the (302), (240), (216), (200), (2112), (544), (4012), and (311) planes of rhombohedral $\alpha$-Fe$_2$O$_3$ (hematite), in agreement with JCPDS card no. 33-0664.
The crystallite sizes for Fe$_2$O$_3$ varied between 8.7 nm and 39.7 nm, with the highest intensity peak at 2$\theta$ $\approx$ 33.76° corresponding to the (240) plane and a crystallite size of approximately 25.1 nm. The microstrain values were higher than those of ZnO, ranging from 0.19% to 0.89%, reflecting more significant lattice imperfections and internal stress, which are typical of hematite nanostructures formed under pulsed energy input.
The Fe$_2$O$_3$/ZnO nanocomposite exhibited a combination of reflections from both ZnO and $\alpha$-Fe$_2$O$_3$, confirming the successful incorporation of both phases without the formation of any new mixed oxide or solid solution. The presence of peaks from both parent materials, particularly at 2$\theta$ $\approx$ 32.66°, 34.14°, 35.46°, 37.15°, 41.90°, and higher angles, supports the retention of individual crystalline domains within the hybrid structure.
Sample | 2θ (°) | d-spacing (Å) | hkl | FWHM (°) | Crystallite Size (nm) | Microstrain (%) |
ZnO | 31.854 | 2.807 | 100 | 0.247 | 35.18 | 0.399 |
34.509 | 2.597 | 002 | 0.231 | 35.62 | 0.365 | |
36.339 | 2.47 | 101 | 0.216 | 42.3 | 0.292 | |
47.642 | 1.907 | 102 | 0.24 | 41.85 | 0.228 | |
56.697 | 1.622 | 110 | 0.233 | 44.28 | 0.183 | |
62.956 | 1.475 | 103 | 0.25 | 37.36 | 0.197 | |
68.052 | 1.377 | 112 | 0.24 | 37.52 | 0.183 | |
69.2 | 1.357 | 201 | 0.33 | 27.62 | 0.246 | |
Fe₂O₃ | 24.78 | 3.591 | 302 | 0.4 | 20.06 | 0.895 |
33.764 | 2.653 | 240 | 0.35 | 25.1 | 0.528 | |
36.24 | 2.477 | 216 | 0.34 | 26.23 | 0.472 | |
41.54 | 2.172 | 200 | 0.24 | 34.76 | 0.312 | |
50.07 | 1.82 | 2112 | 0.23 | 39.7 | 0.229 | |
54.68 | 1.677 | 544 | 0.46 | 16.54 | 0.507 | |
63.04 | 1.473 | 4012 | 0.8 | 8.73 | 0.844 | |
72.49 | 1.303 | 311 | 0.3 | 34.52 | 0.189 | |
ZnO-Fe₂O₃ | 32.66 | 2.74 | 106 | 0.51 | 14.91 | 0.919 |
34.14 | 2.624 | 324 | 0.47 | 17.22 | 0.762 | |
35.46 | 2.529 | 422 | 0.61 | 12.05 | 1.049 | |
37.15 | 2.418 | 404 | 0.51 | 15.01 | 0.805 | |
41.9 | 2.155 | 200 | 2 | 2.95 | 3.65 | |
48.351 | 1.881 | 260 | 0.09 | 560.83 | 0.017 | |
54.851 | 1.672 | 2212 | 0.09 | 1576.66 | 0.005 | |
57.86 | 1.592 | 272 | 0.09 | 578.59 | 0.014 | |
63.898 | 1.456 | 734 | 0.09 | 387.03 | 0.019 | |
69.03 | 1.359 | 244 | 0.08 | 402.8 | 0.017 |
Crystallite sizes for the nanocomposite displayed a wide distribution, ranging from as low as 2.95 nm to exceptionally large values exceeding 500 nm in some high-angle reflections. The smallest crystallite size was observed at 2$\theta$ $\approx$ 41.90° (15.0 nm), while anomalously large sizes (e.g., $\sim$560 nm and $\sim$1576 nm) were calculated for peaks at 48.35°, 54.85°, and beyond—likely due to peak broadening artifacts or nanocrystal agglomeration. The microstrain values were also highly variable, with some peaks showing extreme strain (up to 3.65%), suggesting strong internal distortions and interface stress due to lattice mismatch and multi-phase interactions.
The structural data indicates that the Fe$_2$O$_3$/ZnO nanocomposite retains the distinct crystalline features of both constituent oxides. The high crystallinity of ZnO, coupled with the chemically stable $\alpha$-Fe$_2$O$_3$, and the wide spectrum of crystallite sizes and microstrain levels suggest a heterogeneous but synergistically active composite system. The microstructural heterogeneity may provide a favorable combination of high surface area (due to nanoscale grains) and structural robustness (from larger domains), beneficial for adsorption-driven applications such as phenol removal [8], [28]. Additionally, the lattice strain and interfacial tension between the two oxides could enhance charge separation and reactive site formation, thereby improving the photocatalytic and adsorptive performance of the material.
The surface morphology and size distribution of the ZnO nanoparticles synthesized via pulsed laser ablation (PLA) were examined using scanning electron microscopy (SEM). As depicted in Figure 2(a), the particles exhibit diverse morphologies, including polyhedral, equiaxed, and rod-like shapes. The surfaces appear faceted, while particle aggregation is apparent, likely due to high surface energy and interparticle van der Waals forces.
Quantitative analysis of 45 individual particles yielded a mean diameter (Dmean) of 132 nm, with a standard deviation of 32 nm, indicating moderate polydispersity (see Figure 2(b)). Particle lengths ranged from 53.8 nm to 360.6 nm, with an average length of 151.6 nm. Aspect ratio (AR = L/Dmean) calculations (see Figure S1 in supplementary material), revealed values from 0.4 to 3.3, confirming the presence of both near-spherical and elongated morphologies. As shown in Figure S1, most aspect ratios lie between 0.8 and 1.5, while a subset exceeded 2.0, suggesting the development of nanorods. This elongation is consistent with ZnO's inherent anisotropic growth along the [0001] direction of its wurtzite crystal structure [28]. The boxplot in Figure S2 illustrates significant variability between minimum and maximum diameters, supporting the presence of elongated particles. Correlation analysis (see Table S1 in supplementary material) revealed strong positive relationships between particle length and area (r = 1.000) and between mean and maximum diameters (r = 0.928). The moderate inverse correlation between mean diameter and aspect ratio (r = -0.481) implies that thinner particles tend to be more elongated, likely due to kinetic factors during laser-induced nucleation.
SEM imaging of Fe$_2$O$_3$ nanoparticles Figure 4(a) revealed quasi-spherical, agglomerated structures with relatively smooth surfaces and irregular contours. Compared to the faceted ZnO particles, Fe$_2$O$_3$ nanoparticles exhibited more isotropic growth, possibly due to differences in thermal conductivity and melting point behavior under PLA conditions.
From the analysis of 47 particles Figure 4(b), the average diameter was 165.5 nm (range: 122-211 nm), while the mean particle length was 88.4 nm (range: 33.6-172.1 nm). Figure S3 shows that aspect ratios mostly fell between 0.3 and 0.7, indicating a dominant spherical to slightly oblate geometry. Figure S3 shows a unimodal size distribution skewed toward smaller sizes, while Figure S1 demonstrates a narrower AR distribution relative to ZnO. The boxplot in Figure S4 confirms the compact diameter range. Correlation coefficients in Table S2 indicate a negative relationship between mean diameter and aspect ratio (r = -0.516), consistent with an isotropic growth regime where larger particles are more spherical.
The SEM image of the Fe$_2$O$_3$/ZnO nanocomposite Figure 5(a) reveals a heterogeneous surface composed of both rounded and faceted particles. This confirms the successful co-deposition of Fe$_2$O$_3$ and ZnO without structural coalescence. The observed microstructure includes dense agglomerates and a wide range of morphologies due to the energetic dynamics of laser ablation.
Analysis of 40 selected particles showed a mean diameter of 128.3 nm with a standard deviation of 18.1 nm—intermediate between the values observed for pure ZnO and Fe$_2$O$_3$ Figure 5(b). The histogram in Error! Reference source not found.(b) shows a moderately broad distribution with a slight skewness. Aspect ratio values spanned from 0.35 to 3.25 (mean $\approx$ 1.02), as depicted in Figure S5, with a majority between 0.5 and 1.5, indicating mostly spherical to moderately elongated particles. A smaller fraction of particles exhibited AR $>$ 2.0, suggesting preservation of ZnO-derived anisotropy.
As shown in Table S3, other strong correlations include length vs. aspect ratio (r = 0.977) and mean vs. maximum diameter (r = 0.913). The inverse correlation between mean diameter and aspect ratio (r = -0.408) suggests that more elongated particles tend to be smaller in size. This may be a result of localized growth environments and transient coalescence processes.
The boxplot in Figure S6 demonstrates a wider spread in maximum diameters (129–241 nm) compared to minimum diameters, reflecting the composite’s anisotropic nature and the coexistence of growth modes inherited from both precursor materials.
The combined analysis of XRD and SEM data reveals a consistent structural and morphological correlation across all synthesized samples. In the case of ZnO, the average crystallite size estimated from XRD data ranges between 27.6 nm and 44.3 nm, with a representative value of approximately 38.2 nm, calculated using the Scherrer equation. In contrast, SEM image analysis revealed significantly larger particle sizes, with a mean diameter of 132 nm and a standard deviation of 32 nm. This size discrepancy confirms that the ZnO particles are not single crystals, but rather polycrystalline aggregates, wherein each particle consists of multiple smaller crystalline domains. It is worth noting that XRD analysis commonly shows crystallites of ZnO to be 35-45 nm and 20-40 nm for Fe$_2$O$_3$ which are smaller than the particle sizes seen in FE-SEM images which are approximately 120-160 nm. This difference is a regular feature found in nanomaterial research and is explained by the basic distinction between a crystallite and a particle. A crystallite is a unified area inside a crystal where X-rays produce uniform diffraction. Sometimes, you might find SEM scans of particles formed by many crystallites joined together, especially those that come from pulsed laser ablation in liquid (PLAL). The high-energy plasma plume, quick formation of nanocrystals and the cooling and drying process cause these nanocrystals to join into polycrystalline agglomerates. Additionally, when the solvent is allowed to evaporate, van der Waals forces, electrostatic effects and any surface charges can encourage primary crystallites to group into bigger, secondary micrometer-sized structures. While these structures look like single particles under SEM, they may not be made of a single crystal. In essence, XRD reveals details about the inside structure and connectivity of particles in a sample, while SEM shows the external form and size of the groups of particles. In laser-made nanomaterials, individual small crystallites are embedded in large polycrystalline particles, proving that combining these two techniques helps comprehend how a material is built.
Moreover, XRD analysis of ZnO indicates low microstrain values (0.18%–0.40%), signifying a well-ordered lattice with minimal internal defects. These findings are mirrored in the SEM observations, which display faceted and anisotropic particle shapes, with aspect ratios ranging from 0.4 to 3.3 and a mean particle length of 151.6 nm. The presence of elongated particles supports the notion of preferential growth along the [0001] crystallographic direction of the hexagonal wurtzite structure, consistent with the dominant (101) and (002) reflections in the diffraction pattern [29].
For Fe$_2$O$_3$, the XRD-determined crystallite sizes fall between 8.7 nm and 39.7 nm, averaging approximately 25.1 nm, while the corresponding SEM-measured particle diameters range from 122 nm to 211 nm, with a mean value of 165.5 nm. The higher microstrain values observed in Fe$_2$O$_3$ XRD peaks (up to 0.89%) suggest a greater degree of lattice distortion and structural disorder, likely caused by rapid nucleation and quenching effects inherent to the PLA process. These structural imperfections are reflected morphologically in SEM images, where Fe$_2$O$_3$ particles appear more rounded, irregular, and less faceted than ZnO [30]. The majority of particles exhibited aspect ratios between 0.3 and 0.7, indicating a predominantly isotropic growth mode.
In the Fe$_2$O$_3$/ZnO nanocomposite, XRD data revealed a broad distribution of crystallite sizes, ranging from 2.95 nm to over 500 nm, with microstrain values spanning 0.005% to 3.65%, highlighting the structural heterogeneity of the composite system. Correspondingly, SEM analysis showed particle sizes averaging 128.3 nm and aspect ratios from 0.35 to 3.25, demonstrating the coexistence of spherical Fe$_2$O$_3$-like domains and anisotropic ZnO-like crystallites. These results confirm the morphological diversity and successful physical integration of both phases at the nanoscale.
Collectively, these complementary XRD and SEM findings provide a holistic view of the microstructural characteristics of the synthesized nanomaterials. The consistent observation that SEM particle sizes exceed XRD crystallite sizes across all samples reinforces the conclusion that the particles are predominantly polycrystalline [8]. Furthermore, the correlation between crystallite strain, morphology, and anisotropy underlines the critical role of synthesis conditions in determining structural integrity and functional performance in laser-ablated nanocomposites.
The optical absorption behavior of pure ZnO, pure Fe$_2$O$_3$, and their binary nanocomposites was investigated using UV–Visible spectroscopy in the wavelength range of 360–480 nm (Figure 6). The resulting spectra reveal clear distinctions in spectral features among the samples, which are closely linked to the material composition, band structure, and degree of structural disorder. These insights are crucial for understanding the light-harvesting potential and bandgap modulation of the synthesized nanomaterials.
The normalized absorption spectrum of ZnO nanoparticles (Figure 6) shows a clear onset of absorption at $\sim$360 nm, followed by a sharp increase, reaching a prominent peak at 382 nm with an absorbance of ~0.985. This strong and well-defined feature is indicative of a direct electronic transition, characteristic of ZnO’s direct bandgap ($\sim$3.2-3.3 eV) and high crystallinity [8]. A secondary feature is observed at 393 nm, likely originating from defect-related states or quantum size effects. The spectral profile beyond this point exhibits a gradual tailing in absorbance, dropping to approximately 0.21 at 480 nm, consistent with sub-bandgap Urbach tail behavior and oxygen vacancy-induced states often present in nanostructured ZnO [28].
The composites include Fe$_2$O$_3$:ZnO (50:50, blue), Fe$_2$O$_3$:ZnO (75:25, magenta), and Fe$_2$O$_3$:ZnO (25:75, green). The spectra demonstrate the influence of composition on optical absorption behavior in the 340-500 nm range.
In contrast to ZnO, the Fe$_2$O$_3$ sample exhibits a broad and complex absorption spectrum, with an initial high absorbance of ~0.96 at 360 nm and two overlapping absorption bands centered near 390 nm and 450 nm. These broad features are attributed to ligand-to-metal charge transfer (LMCT) transitions and intra-3d electronic transitions (d-d) within Fe$^{3+}$ ion [15]. The lack of a sharp absorption edge suggests the presence of an indirect bandgap and a greater density of localized states, which are indicative of structural disorder or a wide distribution in particle size and morphology [23]. This extended absorption tail into the visible region enhances Fe$_2$O$_3$’s suitability for visible-light-driven photocatalysis.
The binary composite samples demonstrate optical features that reflect the superposition of ZnO and Fe$_2$O$_3$ contributions, with spectral profiles varying systematically according to composition:
$\bullet$ Fe$_2$O$_3$ (50%) + ZnO (50%): This composition exhibits a distinct absorption peak centered near 382-385 nm, closely matching the ZnO band edge, while maintaining elevated absorbance values beyond 400 nm-above 0.6 even at 430 nm. The broadened spectrum reflects a hybrid optical response, effectively combining the sharp UV activity of ZnO with the visible-range sensitivity of Fe$_2$O$_3$. This extended absorption profile is advantageous for applications in photocatalysis and photodetection.
$\bullet$ Fe$_2$O$_3$ (75%) + ZnO (25%): The spectral response shifts further toward the visible region, displaying features that largely mirror pure Fe$_2$O$_3$, with a high absorbance plateau between 400-450 nm. A weak shoulder near 382 nm persists, suggesting some residual ZnO influence. The increased red-shift and band broadening correlate with higher Fe$_2$O$_3$ content and the corresponding modification of the composite’s electronic structure.
$\bullet$ Fe$_2$O$_3$ (25%) + ZnO (75%): The absorption profile appears intermediate between pure ZnO and the 50% composite, featuring a dominant peak at 382 nm and a minor shoulder around 420–430 nm. Absorbance declines more rapidly beyond 430 nm compared to higher Fe$_2$O$_3$ content composites, reflecting a relatively limited extension into the visible region, yet still enhanced over pure ZnO.
The observed spectral changes with composition underscore the tunability of optical properties in the Fe$_2$O$_3$-ZnO system [21]. Increasing Fe$_2$O$_3$ content leads to a progressive red-shift and broadening of the absorption spectrum, attributed to increased sub-bandgap transitions, defect states, and the intrinsic visible-light activity of Fe$_2$O$_3$. Conversely, higher ZnO content preserves a steep absorption edge and sharper UV transitions, reflecting its wide bandgap semiconducting behavior.
These complementary optical characteristics enable compositional engineering of Fe$_2$O$_3$–ZnO nanocomposites for tailored applications. ZnO-rich composites are ideal for UV-sensitive photodetectors, while Fe$_2$O$_3$-rich systems offer promise in solar-driven photocatalysis and visible-light-assisted pollutant degradation [18]. Although absorption is the main focus of this study, the optical properties and structure reveal that the ZnO-Fe$_2$O$_3$ composite could work well as a heterojunction. The band structure is well-preserved and the gap is reduced to 2.48-2.50 eV. These features, along with rougher interfaces, may encourage more efficient charge separation and more reactant sites when exposed to light. Because of these traits, heterostructures could be utilized in future photocatalysis studies, where they are expected to enhance charge transfer and absorb more light.
The optical band gaps (Eg) of pure ZnO and Fe$_2$O$_3$ nanoparticles, along with their Fe$_2$O$_3$-ZnO nanocomposites synthesized via pulsed laser ablation in liquid (PLAL), were determined using Tauc plot analysis based on the direct allowed electronic transition model. The analysis involved extrapolating the linear region of the ${(\alpha h \nu)}^2$ versus $h \nu$ plots, where $\alpha$ is the absorption coefficient and $h \nu$ the photon energy, to the energy axis.
The estimated optical band gap for both pure ZnO (Figure 7) and Fe$_2$O$_3$ nanoparticles was 2.50 eV, which is lower than their corresponding bulk values. Bulk ZnO typically exhibits a direct band gap of approximately 3.2 eV, while bulk $\alpha$-Fe$_2$O$_3$ (hematite) has an indirect band gap around 2.2 eV [29]. This red shift in the absorption edge for the nanoscale samples is attributed to several contributing factors, including:
$\bullet$ Quantum confinement effects, particularly in the smaller crystallites observed in XRD (as low as 25 nm) [8].
$\bullet$ Surface disorder and the high density of dangling bonds resulting from the high-energy ablation environment [23].
$\bullet$ Oxygen vacancies and defect states, which introduce localized energy levels within the bandgap, reducing the effective transition energy [29].
Tauc analysis of the Fe$_2$O$_3$–ZnO binary systems at different weight ratios yielded the following band gap values:
$\bullet$ Fe$_2$O$_3$ (50%) + ZnO (50%) → Eg = 2.49 eV
$\bullet$ Fe$_2$O$_3$ (25%) + ZnO (75%) → Eg = 2.49 eV
$\bullet$ Fe$_2$O$_3$ (75%) + ZnO (25%) → Eg = 2.48 eV
These minor reductions in band gap energy across the nanocomposites (relative to the pure components) suggest that strong electronic coupling or hybridization effects are minimal at the Fe$_2$O$_3$-ZnO interfaces. The optical transitions remain predominantly dictated by the intrinsic electronic band structures of ZnO and Fe$_2$O$_3$, with no formation of new interfacial energy states or significant band realignment [21].
The subtle narrowing of the band gap in the composites may reflect weak interfacial charge redistribution or the emergence of shallow trap states near the conduction or valence bands. However, the relatively stable Eg values—ranging narrowly between 2.48 and 2.50 eV—indicate that:
$\bullet$ The direct transition character is preserved across all compositions.
$\bullet$ The optical edge remains sharp and distinct, a desirable trait for optoelectronic and sensing applications.
$\bullet$ The material system retains photocatalytic potential under visible-light irradiation, benefiting from the combined wide-bandgap ZnO and visible-absorbing Fe$_2$O$_3$ components.
This optical stability, combined with the morphological tunability shown in SEM and the high crystallinity revealed by XRD, renders the Fe$_2$O$_3$–ZnO nanocomposites particularly promising for applications in photocatalysis, solar energy conversion, gas sensing, and UV-visible optoelectronics [18], [23].
Zeta potential measurements were performed to evaluate the surface charge behavior and colloidal stability of ZnO, Fe$_2$O$_3$, and their binary nanocomposites synthesized via pulsed laser ablation in liquid (PLAL). The analysis was conducted using electrophoretic light scattering (ELS) under the Smoluchowski approximation. These values are crucial for understanding nanoparticle interactions in aqueous systems and for predicting dispersion behavior in applications such as photocatalysis, adsorption, nanofluidics, and environmental remediation.
As show in Figure 8(a) and Figure 8 (b), the pure ZnO nanoparticles exhibited a zeta potential of -30.98 mV, which is considered the threshold for high colloidal stability. Values exceeding $\pm$30 mV are typically associated with strong electrostatic repulsion between particles, which suppresses agglomeration and promotes stable suspensions [4]. This property is essential in photocatalytic and adsorptive processes, where consistent exposure of the active surface is required for optimal performance.
In contrast, the Fe$_2$O$_3$ nanoparticles showed a zeta potential of -21.02 mV, indicating moderate stability. This value lies below the $\pm$30 mV boundary, suggesting weaker repulsive forces and a greater tendency for aggregation. The reduced stability of Fe$_2$O$_3$ may result in faster sedimentation, lower surface accessibility, and diminished long-term performance in suspension-based systems. Although Fe$_2$O$_3$ has a larger surface area because of its spherical structure, its zeta potential value of -21.02 mV is lower than that of ZnO. Its surface chemistry and the way surface hydroxyl groups are present explain why the material has weaker electrostatic repulsion and a lower positive charge at neutral pH.
The influence of compositional variation on surface charge was assessed by analyzing three ZnO-Fe$_2$O$_3$ composites:
$\bullet$ 1:1 ZnO:Fe$_2$O$_3$ (50:50) The nanocomposite displayed a zeta potential of -28.54 mV, approaching the value of pure ZnO. This composition demonstrates enhanced surface charge behavior compared to pure Fe$_2$O$_3$ and suggests a synergistic stabilization effect from ZnO. The near-threshold zeta potential reflects reasonable dispersion stability, making this formulation suitable for multifunctional aqueous applications such as simultaneous adsorption and photocatalytic degradation.
$\bullet$ 25:75 ZnO:Fe$_2$O$_3$ (Fe$_2$O$_3$-rich) The zeta potential measured was -22.10 mV, closely aligning with that of pure Fe$_2$O$_3$. The minimal shift in surface charge indicates that high Fe$_2$O$_3$ content dominates the colloidal behavior, and the introduction of 25% ZnO is insufficient to significantly improve dispersion stability. This composition may be more susceptible to aggregation and thus less suitable for long-term suspension-based processes.
$\bullet$ 75:25 ZnO:Fe$_2$O$_3$ (ZnO-rich) The zeta potential for this sample was -24.38 mV, representing a moderate-to-good stability range. Although slightly below the ideal stability threshold, this value confirms that higher ZnO content positively influences surface charge, likely through the contribution of its high electronegativity and surface functional groups. This composition offers a practical balance between structural integrity and surface functionality, potentially benefiting applications where both the stability of ZnO and the catalytic or magnetic properties of Fe$_2$O$_3$ are desired.
Although ZnO-Fe$_2$O$_3$ (50:50) and (75:25) composites exhibit similar optical bandgaps ($\sim$2.48 eV), their colloidal stability behavior differs significantly due to underlying surface chemistry. The enhanced stability of the 50:50 nanocomposite can be attributed to its balanced distribution of Zn$^{2+}$ and Fe$^{3+}$ surface species, which promotes uniform surface charge distribution and more effective electrical double-layer formation. In contrast, the ZnO-rich (75:25) composition may suffer from reduced surface hydroxylation heterogeneity and uneven charge distribution, leading to diminished zeta potential despite its high ZnO content. This disparity illustrates that while bandgap values remain constant, they do not solely dictate colloidal stability; rather, surface defect density, ionic surface composition, and the relative contributions of each oxide phase govern electrostatic interactions in suspension.
A clear trend emerges from the zeta potential data: increasing ZnO content consistently enhances surface charge and dispersion stability. This behavior can be attributed to ZnO’s inherently negative surface potential in aqueous environments, driven by surface hydroxylation and deprotonation of -OH groups at neutral to alkaline pH [8]. The data suggest that ZnO plays a dominant role in dictating the electrostatic interactions of the composite system. This tunability of surface charge through compositional control enables the strategic design of nanocomposites for target applications:
$\bullet$ For high-stability requirements, such as in photoreactors or wastewater treatment flow systems, ZnO-rich compositions are preferable.
$\bullet$ For applications where magnetic recovery or visible-light activity is prioritized, Fe$_2$O$_3$-rich formulations may be acceptable despite their lower zeta potential, especially when supplemented with surfactants or stabilizers.
Although pure ZnO exhibited the highest absolute zeta potential (-30.98 mV), indicating strong dispersion stability, the binary ZnO–Fe$_2$O$_3$ composites offered superior adsorption performance. This enhancement is attributed to the presence of interfacial heterojunctions, increased surface roughness, and a wider variety of active functional groups. The 50:50 composition, in particular, balanced stability with synergistic surface interactions that outperformed both individual oxides.
Phenol is a hazardous organic pollutant commonly found in industrial wastewater streams. Its efficient removal is a priority in water treatment applications [1]. In this study, the adsorption performance of nanostructured ZnO, Fe$_2$O$_3$, and their binary composites synthesized via pulsed laser ablation in liquid (PLAL) was investigated. Adsorption efficiency was evaluated under two main parameters:
$\bullet$ Contact time: 20, 40, and 50 minutes
$\bullet$ Nanoparticle concentration, indirectly controlled through pulse number during PLAL synthesis: 300 pulses (lower concentration) and 600 pulses (higher concentration)
Phenol removal efficiency (R%) was calculated based on UV–Vis absorbance measurements using a previously established calibration curve [2]. The initial phenol concentration was fixed at 100 mg/L for all experiments.
The data are organized in Table 2, which summarizes the removal efficiency values for all tested nanomaterials and conditions.
To further elucidate the adsorption performance and trends, three figures were plotted based on the average values from triplicate measurements of phenol removal efficiency (R%) for each material. These plots provide a comparative visualization across materials, contact times, and nanoparticle concentrations (i.e., 300 and 600 pulses).
Nanomaterial | R% @ 300 Pulses ( 20 / 40 / 50 min) | R% @ 600 Pulses ($20 / 40 / 50 \mathbf{~min}$) |
|---|---|---|
ZnO | 61.77 / 66.80 / 66.94 | 63.13 / 67.42 / 67.48 |
Fe3O3 | 62.79 / 65.31 / 65.58 | 63.47 / 66.60 / 66.74 |
ZnO-Fer3(50: 50) | 64.83 / 67.55 / 67.69 | 66.19 / 68.30 / 68.44 |
ZnO-Fer3(25: 75) | 63.95 / 64.07 / 64.29 | 64.09 / 65.38 / 65.44 |
ZnO : Fe2O3(75 : 25) | 59.73 / 61.77 / 61.97 | 60.41 / 60.82 / 60.95 |
Figure 9 illustrates the phenol removal efficiency as a function of contact time for all nanomaterials synthesized at 300 laser pulses. It is evident from the data that the ZnO-Fe$_2$O$_3$ (50:50) nanocomposite consistently exhibited the highest removal efficiency across all time points, with mean R% values of approximately 64.8%, 67.6%, and 67.7% at 20, 40, and 50 minutes, respectively. Pure ZnO and Fe$_2$O$_3$ displayed slightly lower but competitive values, while the asymmetric composites-ZnO-rich (75:25) and Fe$_2$O$_3$-rich (25:75)-recorded the lowest performance at each interval. These results reinforce the idea that balanced composition significantly influences adsorption efficiency [21].
Figure 10 shows the performance of all nanomaterials synthesized at 600 pulses, representing higher nanoparticle concentration. An upward shift in removal efficiency was observed across all materials when compared to their 300-pulse counterparts. The ZnO–Fe$_2$O$_3$ (50:50) composite again dominated, achieving mean R% values of 66.2%, 68.3%, and 68.4% at 20, 40, and 50 minutes, respectively. This improvement is attributed to the greater number of available adsorption sites and enhanced surface accessibility due to increased particle concentration [8]. However, while the improvement from 20 to 40 minutes was considerable, further gains between 40 and 50 minutes were marginal—highlighting the approach toward equilibrium.
Figure 11 presents a grouped bar chart comparing the final phenol removal efficiency (R%) at 50 minutes for all nanomaterials under both 300 and 600 pulse conditions. This comparison clearly shows that while increasing nanoparticle concentration enhances performance across the board, the most significant gain was seen in the 50:50 composite, rising from 67.7% to 68.4%. In contrast, ZnO-rich and Fe$_2$O$_3$-rich composites demonstrated smaller improvements, suggesting that compositional balance has a stronger effect on adsorption than concentration alone.
The phenol adsorption results offer meaningful insights into how contact time, nanoparticle dose, and material composition each influence removal efficiency.
It is important to mention that all experiments involving phenol adsorption were carried out in darkness to avoid any photocatalytic effects. The bandgap values observed ($\sim$2.48-2.50 eV) suggest that light absorption could occur, but no light was included during batch testing. Consequently, improvement in phenol removal can be explained only by physical and chemical adsorption mechanisms in this study. Further studies should focus on photocatalytic effects by comparing results in light versus dark and by using scavengers (e.g., IPA, EDTA, benzoquinone) to see which mechanisms are most important.
Across all materials, removal efficiency increased with contact time, particularly between 20 and 40 minutes. This behavior is consistent with the classic two-stage adsorption mechanism. Initially, phenol molecules rapidly interact with abundant and unoccupied surface sites, driven by strong concentration gradients. In the second phase, the rate of adsorption decreases as surface sites become saturated and equilibrium begins to establish. The modest change in efficiency from 40 to 50 minutes—often less than 1%—suggests that equilibrium had nearly been reached, and longer contact times may not yield substantial benefits. From an operational standpoint, 40 minutes emerges as an optimal contact time, balancing effectiveness with energy and process efficiency.
Increasing the PLAL pulse count from 300 to 600 directly increased the concentration of nanoparticles in solution. This translated to more available surface area, a higher density of active adsorption sites, and improved probability of phenol-particle interactions. The data support this, as all materials experienced improved R% at higher doses. For instance, ZnO improved from 66.94% to 67.48%, and Fe$_2$O$_3$ from 65.58% to 66.74%, while the 50:50 composite rose from 67.69% to 68.44%. However, the plateauing of performance with extended time again suggests that after a certain dosage and duration, surface saturation limits further adsorption gains, indicating the importance of optimizing dose-to-yield ratios for practical applications.
The most remarkable finding in this study is the clear superiority of the ZnO–Fe$_2$O$_3$ (50:50) composite over its individual components and asymmetric blends. This material showed the highest phenol removal efficiency under all tested conditions. The improved performance is attributed to a synergistic effect at the nanoscale interface, where the heterojunction between ZnO and Fe$_2$O$_3$ likely promotes enhanced interaction with phenol molecules. Mechanistically, the presence of a broader variety of surface functional groups facilitates stronger adsorption affinity. Furthermore, the dual-phase structure increases surface roughness and porosity, as evidenced in the SEM analysis, allowing for greater phenol entrapment.
The zeta potential of the 50:50 composite (-28.54 mV) was also close to the stability threshold, indicating excellent colloidal dispersion with minimal aggregation. In contrast, ZnO-rich systems may exhibit lower adsorption due to reduced surface defects and fewer reactive hydroxyl groups. Fe$_2$O$_3$-rich systems, on the other hand, tend to agglomerate, limiting effective surface area. The data show that compositional balance—not merely oxide identity—is critical for maximizing phenol removal.
From a chemical perspective, the enhanced phenol adsorption performance observed in the ZnO-Fe$_2$O$_3$ (50:50) nanocomposite can be attributed to a combination of physical and chemical interaction mechanisms. Phenol molecules, which contain an aromatic ring and a hydroxyl functional group, are capable of engaging in multiple types of surface interactions. One of the primary mechanisms is hydrogen bonding, wherein the hydroxyl group of phenol forms hydrogen bonds with surface -OH groups commonly present on metal oxides such as ZnO and Fe$_2$O$_3$. This interaction is particularly favored in materials with a high density of reactive surface hydroxyls, which is often the case in nanostructured oxides synthesized via pulsed laser ablation.
In addition to hydrogen bonding, electrostatic interactions play a significant role, especially considering the measured zeta potentials of the nanocomposites. The 50:50 ZnO–Fe$_2$O$_3$ sample exhibited a zeta potential of -28.54 mV, indicating moderately strong negative surface charge. This facilitates electrostatic attraction toward the phenol molecule, which exhibits weak polarity in aqueous media due to its hydroxyl group. Furthermore, $\pi$-$\pi$ interactions may occur between the delocalized $\pi$-electron system of the phenol ring and exposed metal oxide surfaces—particularly in Fe-containing structures—providing an additional mode of adsorption through van der Waals-like forces.
Another plausible mechanism is surface complexation, wherein phenol molecules coordinate with Lewis acid sites on the oxide surface, such as Fe$^{3+}$ or Zn$^{2+}$ ions. This coordination can stabilize the adsorbed species and enhance binding affinity through weak ligand–metal interactions. The dual-phase interface in the ZnO–Fe$_2$O$_3$ composite introduces a heterogeneous distribution of such sites, offering a chemically diverse environment that accommodates multiple adsorption modes. The composite’s rougher morphology and increased porosity, as evidenced by SEM analysis, further enhance surface accessibility and entrapment efficiency.
Collectively, these mechanisms explain the superior adsorption capacity of the ZnO-Fe$_2$O$_3$ (50:50) composite relative to its monometallic counterparts. The presence of diverse surface functional groups, enhanced interfacial interaction zones, and favorable electrostatic profiles work synergistically to increase the likelihood and strength of phenol adsorption. This multi-mechanistic adsorption behavior highlights the importance of both chemical surface functionality and structural heterogeneity in designing high-performance nanocomposite adsorbents for environmental remediation
The adsorption results align with and are reinforced by the broader physicochemical characterization of the materials:
$\bullet$ SEM analysis revealed that the 50:50 composite possessed a rougher, more heterogeneous surface morphology compared to the smoother, more compact surfaces of the individual oxides—indicating more favorable surface area for adsorption.
$\bullet$ XRD patterns confirmed that both ZnO and Fe$_2$O$_3$ retained their distinct crystalline structures within the composite, suggesting structural compatibility and successful hybridization without phase decomposition.
$\bullet$ UV–Vis absorption studies showed a slight band gap narrowing in the composites (down to ~2.48 eV), which, while not directly tied to dark-phase adsorption, suggests improved electronic interaction at the oxide interface—potentially beneficial in photocatalytic extensions of this system. Although the optical bandgap is not directly responsible for dark-phase adsorption, it indirectly reflects electronic structure and surface reactivity, particularly in semiconducting oxides. A slightly narrowed bandgap, such as that observed in ZnO–Fe$_2$O$_3$ (50:50), may be associated with increased surface defect density and better charge delocalization, which can enhance adsorption affinity via stronger polar interactions and greater electron-donor site availability.
$\bullet$ Zeta potential measurements demonstrated improved electrostatic stability in the composite, which aids in uniform dispersion during mixing and prevents aggregation-related performance loss.
Collectively, these characterizations support the superior adsorption behavior of the 50:50 composite and provide a mechanistic basis for the observed experimental trends.
4. Conclusions
This study demonstrates the successful synthesis of ZnO-Fe$_2$O$_3$ nanocomposites via pulsed laser ablation in liquid (PLAL) and their preliminary evaluation as adsorbents for phenol removal from aqueous systems. Structural and morphological analyses confirmed that the 50:50 composite retained the crystalline features of its parent oxides while exhibiting increased surface heterogeneity and moderate colloidal stability. Among the tested formulations, the 50:50 composition achieved the highest removal efficiency (68.44%), likely due to synergistic interfacial interactions and an optimized balance of Zn$^{2+}$ and Fe$^{3+}$ surface sites.
These findings suggest that compositional tuning is more effective than increasing the proportion of a single oxide in enhancing adsorption behavior. The PLAL method proved to be a green and surfactant-free technique for producing structurally integrated nanocomposites with potential application in water purification. However, several important limitations must be acknowledged.
First, all adsorption experiments were conducted under controlled laboratory conditions using a fixed initial phenol concentration. The influence of environmental variables such as pH, ionic strength, and co-existing contaminants was not explored. Second, although the present study does not include adsorption kinetics or isotherm modeling, we acknowledge this as a limitation and a direction for future work. Models such as Langmuir, Freundlich, and pseudo-second-order kinetics will be employed in follow-up investigations to clarify the mechanistic aspects of phenol removal. Third, material reusability and long-term performance across multiple adsorption–desorption cycles were not evaluated. Lastly, although PLAL offers clean synthesis, its scalability for industrial applications remains constrained by energy efficiency and processing throughput.
Future work should prioritize systematic investigation of pH effects on phenol adsorption and surface charge, as well as regeneration studies using mild eluents such as ethanol or NaOH. Incorporating kinetic and equilibrium modeling, evaluating variable pollutant concentrations, and testing performance in complex wastewater matrices will be critical to fully validate the practical viability of these nanocomposites. Collectively, this study serves as a foundational step toward developing eco-friendly oxide-based adsorbents for aromatic pollutant remediation.
The data used to support the findings of this study are available from the corresponding author upon request.
The authors declare that they have no conflicts of interest.
$B$ | Initial concentration of pollutant (mg/L) |
$C_0$ | Pollutant concentration at time t (mg/L) |
$C_t$ | Amount of adsorbate on adsorbent at time t (mg/g) |
$q_t$ | Adsorption capacity at equilibrium (mg/g) |
$q_e$ | Volume of the solution (L) |
$V$ | Mass of adsorbent (g) |
$m$ | Gas constant (8.314 $\mathrm{J} \cdot \mathrm{mol}^{-1} \cdot \mathrm{~K}^{-1}$) |
$R$ | Temperature (K) |
$T$ | Langmuir adsorption constant (L/mg) |
$K_L$ | Freundlich adsorption constants |
$K_{F,n}$ | Activation energy (kJ/mol) |
$E_a$ | Photon energy |
$hv$ | Band gap energy (eV) |
$E_g$ | Photocatalytic efficiency (%) |
$\eta$ | Zinc Oxide |
$ZnO$ | Iron(III) Oxide |
$Fe_20_3$ | Graphene Oxide |
$GO$ | Bisphenol A |
$BPA$ | Methylene Blue (model dye pollutant) |
$MB$ | Ultraviolet–Visible Spectroscopy |
$UV-Vis$ | X-ray Diffraction |
$XRD$ | Scanning Electron Microscopy |
$SEM$ | Brunauer–Emmett–Teller surface area analysis |
$BET$ | Initial concentration of pollutant (mg/L) |
Supplementary Materials
The following supplementary figures and tables provide extended data and analysis supporting the findings presented in the main manuscript. These materials include detailed morphological statistics, particle geometry distributions, and correlation matrices based on SEM image analysis for ZnO, Fe$_2$O$_3$, and their 50:50 nanocomposite. The supplementary content complements the structural and adsorption performance discussions by offering a deeper insight into particle shape, size variability, and inter-parameter relationships. All data were derived from quantitative measurements using high-resolution FE-SEM images and processed using ImageJ and statistical software.
Supplementary Figures
A quantitative analysis of the crystallographic data obtained from X-ray diffraction (XRD) reveals a clear inverse correlation between crystallite size and microstrain for ZnO, Fe$_2$O$_3$, and ZnO-Fe$_2$O$_3$ (50:50) nanocomposites (see Supplementary Figure S1). As the crystallite size decreases, the corresponding microstrain values tend to increase, which is a well-documented phenomenon in nanostructured materials.
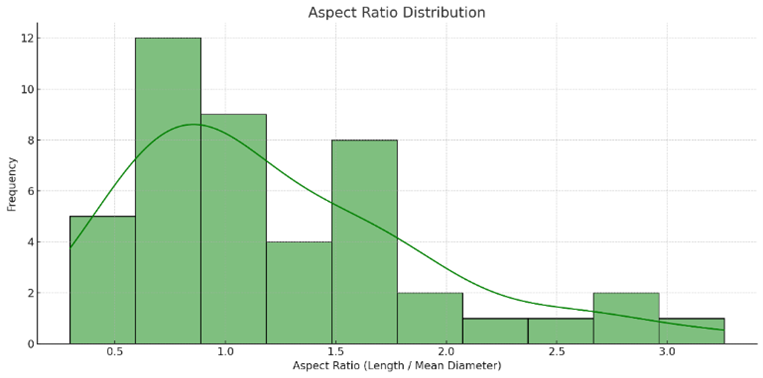
Figure S1. Aspect ratio distribution of ZnO nanoparticles
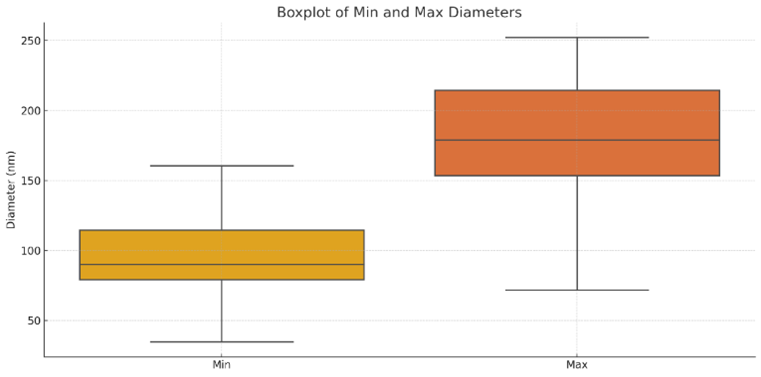
Figure S2. Boxplot of minimum and maximum diameters of ZnO nanoparticles
In particular, the ZnO-Fe$_2$O$_3$ nanocomposite demonstrates some of the highest strain values (e.g., 3.65%) corresponding to the smallest crystallites (e.g., 2.95 nm), likely due to the lattice mismatch and interfacial strain at the heterojunction between the two oxides. The synthesis method—pulsed laser ablation in liquid (PLAL)-further contributes to strain accumulation due to the rapid quenching and high-energy environment, which inhibits defect relaxation and grain growth.
Conversely, crystallites with larger domain sizes (e.g., $>$ 400 nm in the composite) exhibit minimal strain, as evidenced by microstrain values approaching zero (e.g., 0.005–0.02%). These may represent coarsened domains or recrystallized regions formed during the laser-induced agglomeration phase.
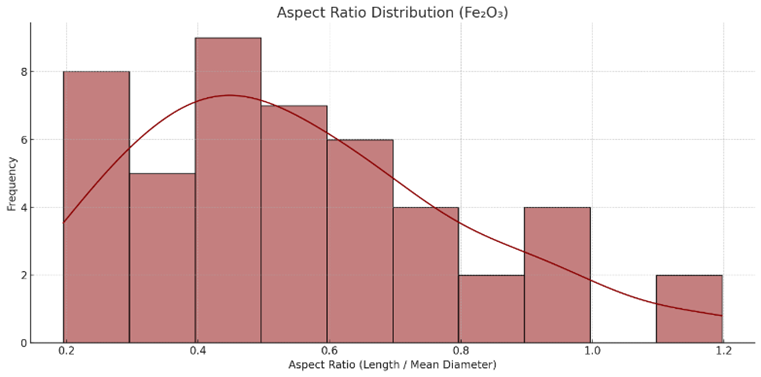
Figure S3. Aspect ratio distribution of $\mathrm{Fe}_2 \mathrm{O}_3$ nanoparticles
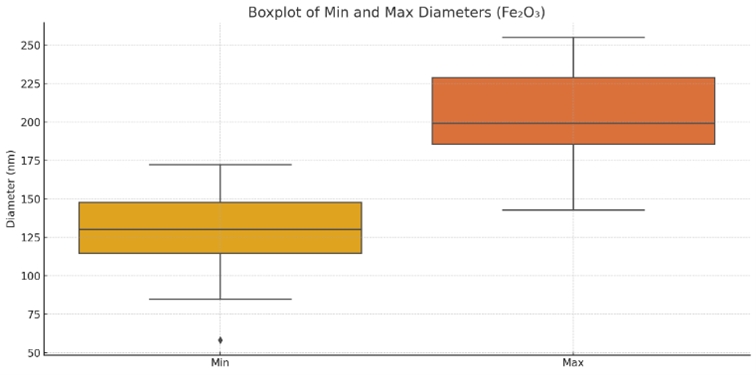
Figure S4. Boxplot of minimum and maximum diameters of $\mathrm{Fe}_2 \mathrm{O}_3$ nanoparticles
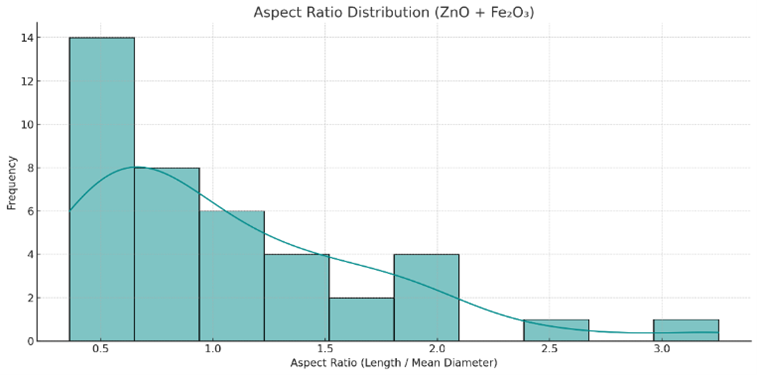
Figure S5. Aspect ratio distribution of $\mathrm{ZnO}-\mathrm{Fe}_2 \mathrm{O}_3(50: 50)$ nanocomposites
This trend reinforces the interpretation of diffraction peak broadening as being influenced not solely by size effects (Scherrer broadening) but also by strain-induced broadening, consistent with the Williamson-Hall theory. The simultaneous consideration of both crystallite size and microstrain is therefore essential for accurate structural interpretation in nanocomposite systems.
Histogram of ZnO nanoparticle aspect ratios derived from SEM image analysis (n = 45). The distribution ranges from $\sim$0.4 to $\sim$3.3, indicating a mix of spherical and elongated particles, with the majority falling between 0.8 and 1.5.
The minimum diameter is more tightly distributed ($\sim$40-160 nm), while the maximum diameter extends up to $\sim$250 nm, confirming morphological anisotropy.
Most Fe$_2$O$_3$ particles exhibit aspect ratios below 1.0, consistent with near-spherical morphologies. The mode is centered around 0.5, indicating isotropic growth behavior.
The plot shows uniform size distribution, with maximum diameters typically between 150-230 nm and tighter spread compared to ZnO particles.
A broad, right-skewed distribution of aspect ratios from $\sim$0.4 to $>$ 3.0, indicating both spherical and elongated morphologies within the composite.
The composite particles show intermediate size ranges between the ZnO and Fe$_2$O$_3$ individual phases, with clear anisotropic features and some outliers.
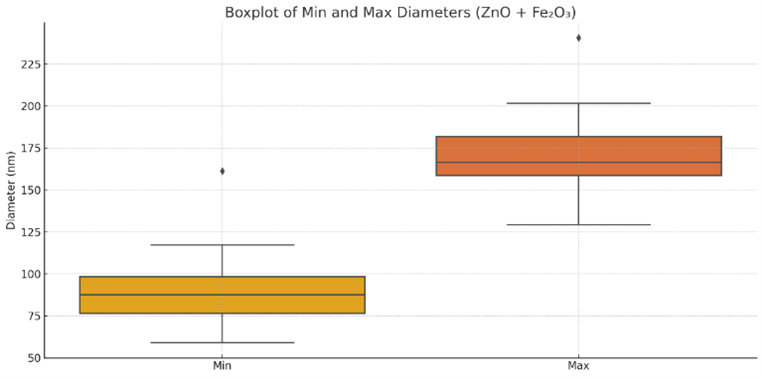
Figure S6. Boxplot of minimum and maximum diameters of $\mathrm{ZnO}-\mathrm{Fe}_2 \mathrm{O}_3$ nanocomposites
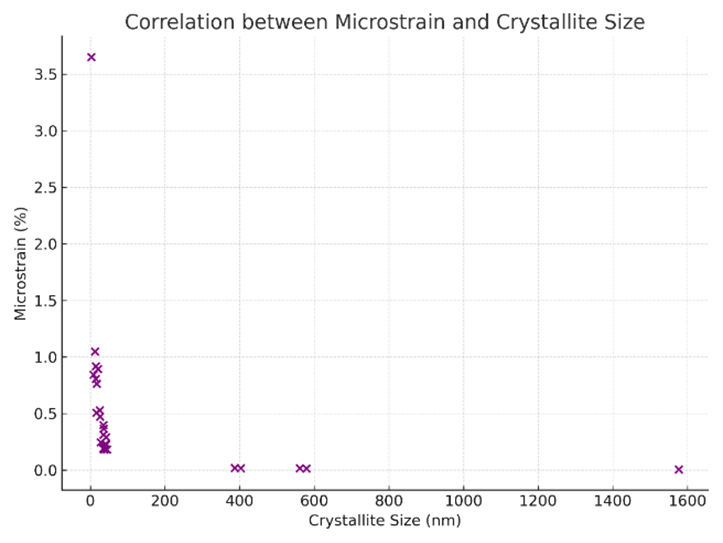
Figure S7. Correlation between microstrain and crystallite size for $\mathrm{ZnO}, \mathrm{Fe}_2 \mathrm{O}_3$, and $\mathrm{ZnO}-\mathrm{Fe}_2 \mathrm{O}_3(50: 50)$ nanocomposites based on XRD data
Figure S7 shows the scatter shows the correlation between microstrain and crystallite size for ZnO, Fe$_2$O$_3$, and ZnO–Fe$_2$O$_3$ (50:50) nanocomposites based on XRD data. An inverse trend is observed, where smaller crystallites exhibit higher microstrain, supporting the role of internal lattice strain and crystal imperfections in peak broadening effects observed in nanocrystalline systems.
Supplementary Tables
Table S1. Pearson correlation matrix of ZnO nanoparticle dimensions showing relations among length, aspect ratio, and diameters
Area | Mean | Min | Max | Length | Aspect Ratio | |
|---|---|---|---|---|---|---|
Area | 1 | -0.245 | -0.282 | -0.069 | 1 | 0.977 |
Mean | -0.245 | 1 | 0.896 | 0.913 | -0.245 | -0.408 |
Min | -0.282 | 0.896 | 1 | 0.774 | -0.282 | -0.419 |
Max | -0.069 | 0.913 | 0.774 | 1 | -0.068 | -0.222 |
Length | 1 | -0.245 | -0.282 | -0.068 | 1 | 0.977 |
Aspect Ratio | 0.977 | -0.408 | -0.419 | -0.222 | 0.977 | 1 |
Table S2. Pearson correlation matrix of $\mathrm{Fe}_2 \mathrm{O}_3$ nanoparticle dimensions
Area | Mean | Min | Max | Length | Aspect Ratio | |
|---|---|---|---|---|---|---|
Area | 1 | -0.057 | -0.077 | 0.157 | 0.927 | 0.72 |
Mean | -0.057 | 1 | 0.896 | 0.913 | -0.057 | -0.516 |
Min | -0.077 | 0.896 | 1 | 0.774 | -0.077 | -0.551 |
Max | 0.157 | 0.913 | 0.774 | 1 | 0.157 | -0.282 |
Length | 0.927 | -0.057 | -0.077 | 0.157 | 1 | 0.894 |
Aspect Ratio | 0.72 | -0.516 | -0.551 | -0.282 | 0.894 | 1 |
Table S3. Pearson correlation matrix of $\mathrm{ZnO}-\mathrm{Fe}_2 \mathrm{O}_3$ nanoparticle dimensions
Area | Mean | Min | Max | Length | Aspect Ratio | |
|---|---|---|---|---|---|---|
Area | 1 | -0.245 | -0.282 | -0.069 | 1 | 0.977 |
Mean | -0.245 | 1 | 0.896 | 0.913 | -0.245 | -0.408 |
Min | -0.282 | 0.896 | 1 | 0.774 | -0.282 | -0.419 |
Max | -0.069 | 0.913 | 0.774 | 1 | -0.068 | -0.222 |
Length | 1 | -0.245 | -0.282 | -0.068 | 1 | 0.977 |
Aspect Ratio | 0.977 | -0.408 | -0.419 | -0.222 | 0.977 | 1 |