Assessing the Seismic Resilience of a Reinforced Concrete Bridge in Sibu, Sarawak: A Finite Element Analysis Approach
Abstract:
In the realm of civil engineering and structural analysis, the seismic resilience of infrastructure remains a critical area of research. This study delineates the seismic response assessment of a reinforced concrete bridge situated in Sibu, Sarawak, through the lens of finite element analysis (FEA). Embracing the robust capabilities of FEA, a comprehensive model of the reinforced concrete bridge is developed, enabling the simulation of its response to seismic forces. Notably, the seismic loading conditions are derived from the Chi-Chi earthquake time history data, a choice informed by the earthquake's significance in seismic research and the richness of its data, rather than its direct seismic comparability to Sarawak. The FEA, conducted using the Abaqus/CAE 6.14 software, meticulously models the bridge, incorporating varying peak ground acceleration (PGA) values of 0.10g, 0.20g, 0.50g, and 1.00g. Key structural response parameters, including maximum principal stress, acceleration, and displacement, are systematically extracted and analyzed. This meticulous approach uncovers the material resilience of the bridge, even under extreme seismic forces exemplified by a PGA of 1.00g. The integrative analysis, encompassing both static pushover and dynamic time history analyses, elucidates the structural integrity and performance of the reinforced concrete bridge in the face of seismic challenges. The findings not only contribute to the understanding of seismic impacts on reinforced concrete bridges but also pave the way for enhancing seismic design and resilience strategies in structural engineering.1. Introduction
Bridge infrastructure, an essential element of urban development, has been identified as especially vulnerable to earthquakes. These seismic events pose a significant threat to the structural integrity and functionality of bridges, thereby impacting the safety of transportation networks and communities. Earthquakes, characterized by their unpredictability and inevitability, have been documented to affect human life, infrastructure, and economic development significantly [1], [2]. The increasing incidence of seismic events and their consequential impacts have heightened concerns regarding the robustness and resilience of structures and their components when exposed to seismic hazards [3], [4], [5]. Recent seismic events, particularly those in California, have intensified scrutiny on the resilience of bridges in seismically active regions [6], [7], [8], [9], [10], [11], [12]. It has been observed that many bridges in the United States, especially older ones constructed prior to the establishment of modern seismic regulations, are not equipped to withstand significant seismic forces. Even relatively minor seismic events have the potential to cause considerable damage to these structures [13], [14], [15], [16]. Figure 1 illustrates the extent of damage to bridges caused by earthquakes.
In April 2016, Kumamoto, Japan, experienced a series of significant seismic events. On April 14th, a 6.5-magnitude earthquake, classified with a seismic intensity of 7, struck the region. This initial earthquake was identified as a foreshock, followed by a 7.3-magnitude mainshock on April 16th. Subsequently, the area endured over 140 aftershocks within the next two days, including at least 11 of magnitude 4.5 and one reaching magnitude 6. The epicenters, located in Kumamoto's Mashiki Town and Higashi Ward, led to severe impacts in these areas. The earthquakes resulted in considerable damage to numerous structures and vital transportation infrastructure. By June 30, 2016, statistical data revealed the loss of 69 lives, with 364 individuals sustaining serious injuries, and 1,456 suffering minor injuries due to the mainshock. Additionally, the earthquakes caused the complete collapse of 8,044 structures, partial or total destruction of 24,274, and significant damage to 118,222 others [17].
The vulnerability of bridges, as a critical component of the transportation network, has been emphasized by damages inflicted by such seismic events globally. Even though some of these earthquakes were relatively minor, their impact on bridge infrastructure has been profound [14], [15], [17], [18]. The potential for bridge damage to cause substantial disruption to the transportation system and incur significant direct and indirect costs is well-documented. For instance, the Loma Prieta earthquake in 1989 resulted in the demise of over 40 individuals due to bridge failures, alongside direct losses to the transportation system amounting to $1.8 billion [19].

| Dates | Latitude (o) | Longitude (o) | Mag. | Depth (Km) | Locations |
|---|---|---|---|---|---|
| 27 May 2018 | 3.32 | 114.4 | 3.9 | 10 | Niah near Miri, Sarawak, Malaysia |
| 25 Jan. 2010 | 3.65 | 113.82 | 3.2 | 10 | Niah near Miri, Sarawak, Malaysia |
| 23 Dec. 2009 | 3.8 | 113.6 | 3.3. | 10 | Niah near Miri, Sarawak, Malaysia |
| 19 Apr. 2005 | 3.483 | 113.896 | 4.2 | 10 | Miri, Sarawak, Malaysia |
| 01 May 2004 | 3.593 | 113.927 | 5.2 | 10 | Miri, Sarawak, Malaysia |
| 19 Feb. 1994 | 2.522 | 112.71 | 4.7 | 33 | Sarawak, Malaysia |
| 12 Feb. 1994 | 2.485 | 112.765 | 5.3 | 28.9 | Sarawak, Malaysia |
Recent historical data has indicated an increasing focus on earthquake engineering research in Malaysia. Contrary to the prevalent belief of Malaysia’s positioning within a zone of low-to-moderate seismic activity, historical case studies have demonstrated a noteworthy shift. Notably, the eastern states of Malaysia, Sarawak and Sabah, have documented local earthquakes with magnitudes ranging from 3.5 to 6 on the Richter scale, as evidenced in Table 1 and Figure 2. Furthermore, Malaysia's proximity to an active seismic zone, approximately 350 km away, coupled with its location on the tectonically stable Indonesia-Sundaland crust, adds a layer of complexity to the region's seismic risk profile [21].
A significant seismic event that exemplifies this risk occurred on May 5, 2015, when an unexpected earthquake struck Ranau, Sabah, in the northern region of Borneo. This earthquake sent shockwaves through the South East Asian community, causing extensive damage and revealing a critical gap in earthquake preparedness and education. The Ranau earthquake, the most substantial quake recorded in Borneo's history, resulted in 18 fatalities. This incident underscores East Malaysia's vulnerability to moderate magnitude earthquakes and highlights the urgent need for enhanced seismic awareness and preparedness in the region.
Earthquakes have demonstrated their potential to inflict significant damage on bridge infrastructure, even when constructed to withstand seismic forces at a 'collapse prevention' performance level. In the event of an earthquake, the columns of a reinforced concrete bridge often serve as the primary source of ductility. Damage to the concrete cover, core, and reinforcement, as well as substantial permanent lateral deformation of the columns, is typically observed [16], [19], [22].
Traditionally, foundations in bridge design are considered rigid, neglecting the influence of subsurface soil subsidence and structural flexibility on the overall structural response [23], [24], [25]. The interaction between soil and structure, particularly the rocking motion of the structure on the foundation, is a critical aspect often overlooked [14], [26], [27]. When the interaction between the structure, the foundation, and the surrounding soil is considered, significant deviations in the structural behavior are observed, as compared to evaluating the structure in isolation [28]. The flexibility of the soil and its rocking motion are often not addressed in conventional structural design processes. However, these factors are crucial in designing foundations, especially when considering the seismic performance of a bridge during intense earthquakes. Furthermore, the current design methodologies based on ductility principles in near-field earthquakes prove insufficient due to the significant structural damage and compromised deformability and usability post moderate to severe seismic events. In this study, the bridge's rocking motion, particularly with the columns, has been leveraged to enhance seismic behavior, allowing for significant energy dissipation through shear wall flow.
The primary objective of this study is to evaluate the seismic response of reinforced concrete bridges in Sibu, Sarawak. This entails determining the seismic performance of the bridge model under varying ground motion conditions, assessing the bridge's behavior through static pushover analysis and dynamic time history analysis, and evaluating the seismic vulnerability of the bridge model with a focus on displacement and PGA parameters. To achieve this, the Abaqus/CAE 6.14 software is employed to construct and analyze a reinforced concrete bridge model. The software's capabilities in examining seismic performance and modeling seismic inputs are utilized in the analysis, with a variety of bridge model parameters being considered. Both static pushover and dynamic time history analyses are applied to scrutinize the structure comprehensively.
2. Methodology
The methodology adopted in this study encompasses a comprehensive approach to evaluate the seismic response of a reinforced concrete bridge located in Sibu, Sarawak, as depicted in Figure 3. The initial phase of this research entailed detailed modeling of the bridge utilizing FEA techniques. The selection of FEA for this study is predicated on its exceptional ability to model and simulate complex structural behaviors. This technique facilitates an accurate representation of the reinforced concrete bridge, thus enabling an in-depth assessment of its response to various seismic conditions. Employing Abaqus/CAE 6.14 software, known for its robust FEA capabilities, a thorough analysis of the bridge was conducted. This approach is instrumental in evaluating the structural integrity, stress distribution, and displacement patterns of the bridge under seismic loading conditions. Through the utilization of FEA, this research aims to glean nuanced insights into the bridge's performance, thereby contributing significantly to the understanding of its seismic resilience and aiding in the development of design strategies for earthquake-prone areas.
Seismic loading within the model incorporates earthquake time history data from the Chi-Chi earthquake in Taiwan. This particular seismic event was selected not due to its direct similarity to seismic characteristics in Sarawak but owing to its notable significance and the extensive data available from this event. The Chi-Chi earthquake is frequently used in seismic studies as a benchmark for validating models and results, facilitating comparative analyses with existing literature and enhancing the understanding of seismic response in bridge engineering.
The ground motion scenarios examined in this study encompass peak ground accelerations of 0.10g, 0.20g, 0.50g, and 1.00g, thereby covering a broad spectrum of seismic intensities. This diverse range allows for an exhaustive exploration of the bridge's response to different levels of seismic stress. Critical parameters such as maximum principal stress, acceleration, and displacement were meticulously extracted from the FEA. Moreover, the study employs both static pushover analysis and dynamic time history analysis, methodologies pivotal in capturing the comprehensive structural behavior of the reinforced concrete bridge under seismic conditions. The amalgamation of these analytical methods, alongside advanced simulation tools, is aimed at providing a holistic understanding of the bridge's performance and resilience in the face of seismic forces, thereby offering valuable insights into the field of earthquake engineering and the resilience of infrastructure.
Properties | Values | |
Concrete material properties | Mass density | 2,437.9 kg/m3 |
Young’s modulus | 24,459 MPa | |
Poisson’s ratio | 0.2 | |
Dilation angle | 31 | |
Eccentricity | 0.1 | |
fb0/fc0 | 1.16 | |
K | 0.67 | |
Viscosity parameter | 0 | |
Steel material properties | Mass density | 7,698.2 kg/m3 |
Young’s modulus | 200,000 MPa | |
Poisson’s ratio | 0.3 | |
Soil material properties | Mass density | 1900 kg/m3 |
Young’s modulus | 50 MPa | |
Poisson’s ratio | 0.45 | |
Figure 4 illustrates the assembled bridge model. Table 2 outlines the material properties of concrete, steel, and soil used in the model. These properties are integral to the FEA and are input into Abaqus to ensure an accurate representation of the bridge.
Pushover analysis, a structural analysis methodology, is employed to evaluate the lateral load resistance capacity of the bridge. This method, prevalent in earthquake engineering and seismic design, assesses the performance of structures under progressively increasing lateral forces. In pushover analysis, lateral loads are incrementally applied to the structure, simulating earthquake effects. This analysis models the structure's response, considering the distribution of lateral stiffness and strength. The objective is to understand the deformation of the structure and the variation of internal forces, such as shear forces and bending moments, under increasing lateral loads.
3. Results and Discussion
The analysis conducted on the reinforced concrete bridge model, subjected to varying ground motion PGA of 0.10g, 0.20g, 0.50g, and 1.00g, yielded results summarized in Table 3. The focus was on key parameters, specifically maximum principal stress, acceleration, and displacement, with only the maximum values being tabulated for clarity.
Ground motion | Parameters | |
Maximum principal stress (Pa) | Displacement (m) | |
0.10g | 7.708 x 10⁷ Pa 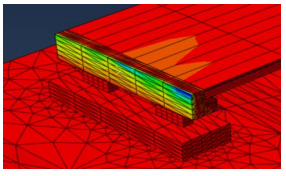 | 0.00166 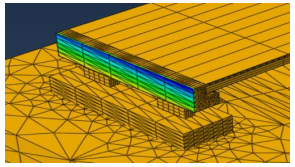 |
0.20g | 1.257 x 10⁸ Pa 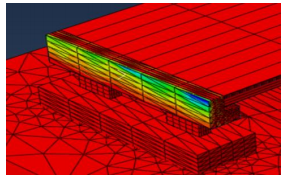 | 0.00266 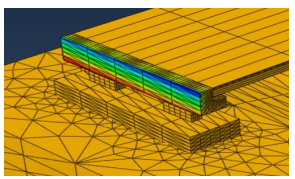 |
0.50g | 1.986 x 10⁸ Pa 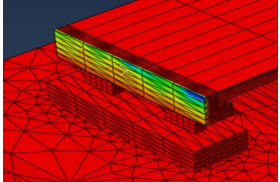 | 0.00416 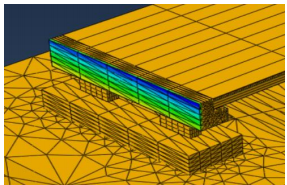 |
1.00g | 4.294 x 10⁸ Pa 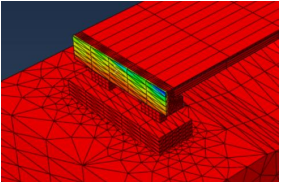 | 0.00831 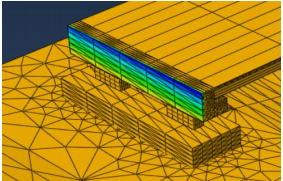 |
Under a PGA of 1.00g, the highest recorded maximum principal stress in the total system was 429.4 MPa. It is noteworthy that this value is below the ultimate strength of the steel used in the bridge, which is 480 MPa. Similarly, the ultimate tensile strength of concrete is 3.500 MPa, indicating that the material integrity of both steel and concrete components was not compromised under the simulated seismic conditions.
The displacement of the bridge structure, a critical factor influencing its seismic resilience, was observed to increase proportionally with the PGA value. It is important to note that excessive displacement can lead to structural failure. However, the displacement recorded for the bridge model under a PGA of 1.00g was 8 mm, a value within acceptable limits. Consequently, it can be concluded that the bridge model did not experience failure due to displacement at this level of ground motion.
Time history analysis, utilizing data from prior earthquakes, was conducted to elucidate the dynamic behavior of the reinforced concrete bridge, thereby addressing the inherent uncertainty and complexity of such seismic events. The ground motion incorporated into the analysis comprised 14,998 steps, with a 0.05-second interval between each step in terms of acceleration. Figure 5 presents the acceleration time history record used for the analysis under a PGA of 0.1g.
The acceleration time history responses for the bridge, corresponding to different PGAs, are depicted in Figure 6, Figure 7, Figure 8. The chosen points for analysis represent the locations yielding the highest acceleration response. Despite varying PGA values, a consistent pattern emerged: the peak acceleration consistently occurred around the same time, with the magnitude of the response escalating in accordance with the increase in PGA. Specifically, the peak accelerations recorded were as follows: for PGA = 0.1g, 0.921$m/s^2$; for PGA = 0.2g, 1.841$m/s^2$; for PGA = 0.5g, 4.69$m/s^2$; and for PGA = 1.0g, 9.357$m/s^2$. Notably, all peak accelerations manifested at approximately 23 seconds.
In the realm of seismic engineering, response spectrum analysis is a pivotal tool. This analysis plots spectral acceleration against the period of a structure, offering critical insights into its response to seismic loads across varying frequencies. The response spectrum graph is instrumental in discerning the dynamic characteristics of a structure and its resilience to seismic forces.
The graph's interpretation unfolds in the following manner:
First, high-frequency range. At shorter periods (higher frequencies), spectral accelerations tend to be lower, suggesting reduced sensitivity of the structure to high-frequency ground motion. This domain, generally associated with rapid, short-duration seismic waves, sees the structure's response largely influenced by its inherent stiffness.
Second, resonance region. As the period extends, a peak in spectral acceleration emerges. This peak signifies the structure's natural or resonant frequency, where it is most vulnerable to seismic forces, potentially undergoing significant vibration amplification. It is crucial for engineers to ensure that the structure's natural frequency does not align with predominant ground motion frequencies, as this can lead to heightened responses and potential structural compromise.
Finally, longer periods. With further elongation of the period, a decline in spectral acceleration is observed, indicating diminished responsiveness to longer-period ground motion. Nevertheless, it remains vital to ensure the structure's capacity to endure the effects of sustained seismic waves, which could accumulate damage over time.
The response spectrum graph is invaluable for engineers to assess structural behavior under diverse frequencies, pinpointing critical periods where vulnerability to seismic loads is maximized. This analysis aids in formulating design strategies, including selection of damping systems or adjustments in structural stiffness and strength, to bolster seismic resilience.
Figure 9 illustrates the response spectrum analysis for the bridge model. Here, spectral acceleration, denoting the peak acceleration response of a structure to seismic loading, is expressed as a function of vibration period. The model exhibits maximum response to acceleration at approximately a 2-second period, with spectral accelerations nearing 10.00g, corresponding to the study's maximum considered ground motion (1.00g PGA).
Pushover analysis, a method used to assess the capacity of structures to withstand lateral or seismic loads, plots the behaviour of a structure as these loads are progressively increased. It is a crucial tool in structural engineering for evaluating the performance of buildings and bridges under seismic conditions.
As indicated in Figure 10, the pushover analysis of the bridge model revealed several critical points. At a base shear of 11378.2 kN and a displacement of 1.48 mm, the steel within the structure yielded for the first time. Subsequently, the first instance of unconfined concrete crushing, or spalling of cover concrete, was observed at a base shear of 15941 kN and displacement of 6.25 mm. The confined concrete core experienced its initial crushing at a displacement of 10.78 mm and a force of 6284.05 kN. The first fracture point in the structure was identified at a base shear of 3541.14 kN and a displacement of 13.21 mm.
The analysis suggests that the bridge possesses a commendable capacity to endure seismic ground motion, even with PGA values reaching up to 1.00g. This conclusion is supported by several key findings:
$\bullet$The maximum principal stress recorded during the seismic ground motion was 429.4 MPa, which is below the ultimate strength of the materials used (480 MPa for steel). This indicates that, even under the demanding conditions of a 1.00g PGA earthquake, the bridge's material integrity remains uncompromised.
$\bullet$A linear relationship between the displacement of the bridge components and the PGA of ground motions was observed. Despite this linear increase, the maximum displacement noted (8.31 mm) during a 1.00g PGA earthquake is within acceptable limits, posing no threat to the structural integrity of the bridge.
$\bullet$The peak acceleration response of the structure occurs at approximately 23 seconds, correlating with the earthquake time history used in the study. The highest acceleration value recorded (4.694 m/s²) corresponds to a vibration period of 2 seconds, signifying resonance. Although this resonance leads to amplified vibrations, the acceleration values do not exceed thrice the PGA of the ground motion, indicating a controlled response from the bridge components.
$\bullet$When converted to units of gravity, the acceleration response at 1.00g PGA equates to 0.954g. This value, not exceeding three times the PGA, reaffirms the structure's ability to effectively manage seismic forces.
In conclusion, the comprehensive analysis encompassing stress, displacement, and acceleration responses collectively points to the bridge's robustness and its capability to withstand earthquake ground motion up to a PGA of 1.00g. The structural elements appear to stay within safe operating thresholds, suggesting a low likelihood of failure under the specified seismic conditions. However, it is crucial to acknowledge that these conclusions are drawn within the study's assumptions and limitations, and ongoing evaluation and monitoring are imperative for a complete understanding of the bridge's long-term seismic resilience.
4. Conclusions
In this study, a comprehensive analysis of the seismic response of a reinforced concrete bridge in Sibu, Sarawak, under varying seismic loads was conducted. The conclusions drawn from this analysis are as follows:
Maximum principal stress analysis
$\bullet$It was observed that the maximum principal stress of the bridge (429.4 MPa) remains below the ultimate strength of the materials used (480 MPa), indicating a significant safety margin. This margin suggests that the bridge is not operating near its material failure threshold under the seismic forces applied.
$\bullet$The ability of the bridge to absorb and distribute stress within its material limits reflects a degree of ductility and resilience. Such ductility is essential for allowing deformations and redistribution of forces during seismic events, thereby averting abrupt and catastrophic failures.
$\bullet$Stress analysis results indicate that the materials of the bridge maintain their integrity even under the most severe seismic conditions tested, a critical factor for ensuring long-term structural stability and the capacity to withstand repeated seismic activities throughout the bridge's lifespan.
Displacement analysis
$\bullet$A linear relationship was identified between the displacement of bridge components and the PGA of ground motions. The predictable and proportional response of the bridge to escalating ground motion underscores the structural integrity of the bridge.
$\bullet$The maximum displacement observed (8.31 mm) is relatively modest, indicating that the bridge experiences manageable levels of deformation, which is vital for preventing structural damage and preserving the bridge's functionality post-seismic events.
$\bullet$The constrained displacement values are pivotal for the serviceability of the bridge, as excessive displacements could impair the structure’s ability to support traffic loads and fulfill its designed role.
Overall structural response
$\bullet$Resonance within the bridge's acceleration response at a vibration period of 2 seconds points to the structure's natural frequency. While resonance typically amplifies vibrations, controlled acceleration values suggest a stable and predictable response of the bridge components.
$\bullet$The fact that the acceleration response does not exceed three times the PGA is a significant threshold, indicating that the bridge manages seismic forces without experiencing abrupt and uncontrollable acceleration, thus reducing the risk of structural damage.
$\bullet$The peak acceleration occurring at the structure’s natural frequency highlights the bridge's highest susceptibility to seismic forces at this specific frequency. This finding is instrumental for the development of damping mechanisms or structural adjustments to mitigate resonance-related risks.
In the final analysis, it is determined that the bridge in Sibu, Sarawak, exhibits a capacity to endure earthquake ground motions with PGA values up to 1.00g. The findings reveal that, even under a seismic event characterized by a PGA of 1.00g, the maximum principal stress registered in the bridge (429.4 MPa) remains below the ultimate strength threshold of the construction materials (480 MPa). This observation underscores a safety margin that is crucial for structural resilience under seismic stress. Furthermore, a linear relationship is discerned between the displacement of the bridge components and the PGA of ground motions. Notably, the highest displacement measured, 8.31 mm, under a 1.00g PGA ground motion, does not reach a magnitude that would precipitate structural failure. This finding is significant in affirming the bridge's ability to sustain functionality post-seismic events. The analysis of acceleration responses unveils that the peak acceleration of 9.357 m/s², equivalent to 0.954g in gravitational units, does not surpass three times the PGA of the ground motion. This constraint indicates a controlled response by the bridge components, devoid of abrupt acceleration spikes. The consistency in the timing of the highest acceleration responses with the earthquake time history utilized in this study, particularly at 23 seconds, further corroborates the reliability of the findings. The most pronounced acceleration response, observed at a vibration period of 2 seconds and measuring 4.694 m/s², corresponds to the structure's natural or resonant frequency. This resonance point, while indicative of increased susceptibility to seismic loads, does not result in excessive vibrational amplification, suggesting a well-managed structural response.
In summation, the comprehensive interpretation of maximum principal stress, displacement, and acceleration data suggests that the bridge not only upholds material integrity under seismic forces but also demonstrates a controlled and resilient response. The collective evidence from this study indicates that the bridge is proficiently designed to withstand seismic events with PGA values up to 1.00g. These insights are pivotal in affirming the safety, durability, and overall seismic performance of the bridge, contributing valuable knowledge to the field of earthquake engineering and infrastructure resilience.
The data used to support the findings of this study are available from the corresponding author upon request.
The authors declare that they have no conflicts of interest.