Seismic Capacity Using Finite Element Analysis: A Case Study of Murum Powerhouse
Abstract:
Malaysia has become more aware of potential seismic hazards after one of the most devastating earthquakes in 2015. It is necessary to make seismic analysis of areas with active fault lines and access the current structure design in the seismically active areas. Therefore, this study aimed to investigate and analyse the structural response of the Murum Powerhouse under seismic load using the finite element modelling software ABAQUS. It was discussed to evaluate the seismic capacity of powerhouse structure under different seismic loads using the dynamic time-history analysis. The assembled model was subjected to seismic load, and the earthquake time history was taken from the Eregli station in the Kocaeli earthquake in Turkey with peak ground accelerations (PGAs) of 0.1g, 0.2g, 0.3g, 0.5g, and 0.8g. The scope of this study included the analysis of acceleration, displacement and principal stress response of the Murum Powerhouse structure. Further findings showed that the Murum Powerhouse was likely to have structural failure in earthquake, based on the model using the ABAQUS software with 0.3g PGA and above. The powerhouse model only passed the allowable displacement required by Uniform Building Code 1997 (UBC97) with PGAs of 0.1g and 0.2g. Further recommendations were made in this study in order to determine the response of the facility under different conditions.1. Introduction
As a computational tool, Finite Element Analysis (FEA) is widely used to predict the behavior of structures under various load conditions, including seismic load. It can be used to assess the seismic capacity of the Murum Powerhouse, which is a hydroelectric power plant located in Sarawak, Malaysia. With the aim to generate electricity from the Murum River flowing through the region, the power plant consists of a dam, a reservoir, a powerhouse, and transmission lines. A model, which includes all major components of the power plant and accurately represents their geometries, materials, and boundary conditions, should be developed to assess the seismic capacity of the Murum Powerhouse using FEA. Once the model is developed, it is subjected to a series of seismic load conditions, which represent different earthquake scenarios. The structure’s response to these conditions can be evaluated using FEA, which predicts factors, such as stress, strain, displacement, and acceleration. The FEA analysis results can be used to identify potential design weaknesses of the Murum Powerhouse and evaluate its seismic resilience. For example, if the analysis results show that certain components of the power plant are experiencing high stress or strain under seismic load, then modifications can be made to strengthen those components. Overall, FEA is a powerful tool to assess the seismic capacity of structures, such as the Murum Powerhouse. Engineers and designers ensure that the power plant is able to withstand earthquake forces and continue to generate electricity reliably and safely using this technique. Due to its position, Malaysia is known to have relatively low to medium seismic events and has never experienced such a devastating earthquake event in 2015 compared with neighboring countries, such as Indonesia and Philippines. Therefore, earthquake hazard can be considered a new field in Malaysia [1], [2], [3], [4]. Most Malaysians have weak awareness of potential earthquake risks, and the introduction of seismic design in Malaysia is yet to be considered, because earthquakes have occurred rarely. However, an earthquake hit Ranau in Sabah on 26 July 2015, which made Malaysians more aware of the seismic hazard. The 6.0 Richter scale earthquake killed 18 people and caused major property losses, which affected the economic situation of the country [2], [5], [6], [7], [8]. Seismic studies are needed because it can no longer be declared that Malaysia is in a seismically stable position. Ever since this catastrophic event, Malaysia introduced National Annex to Eurocode 8 (MS EN 1998-1:2015) as a guideline for structure design to withstand seismic hazards.
Apart from Sabah earthquake, further studies found that a few earthquakes had occurred in Sarawak with a moderate magnitude ranging from 3.9 up to 5.2 on the Richter scale. Experts concluded that the local fault around that area could be reactivated by dam construction and any structure, thus triggering earthquakes [1], [9], [10], which has become a major concern to various hydroelectric projects in Sarawak, especially the Murum Powerhouse, because it is near to Tubau and Tinjar faults, which are considered as active by the Mineral and Geoscience Department, as shown in Figure 1.

Murum Powerhouse was chosen as a case study in this study. It is located approximately 176km from the previous earthquakes in Miri, which happened in 2004 and 2005 measuring 4.2 and 5.2 on the Richter scale [2], [4], [5], [6]. Seismic analysis of the dam structure is needed because Murum Powerhouse can be seismically vulnerable. Although earthquakes have not occurred in the area, it is still important to take various safety measures to assure the safety of the Murum Powerhouse in advance [1], [11], [12], [13]. Seismic analysis and modelling should be strictly considered from now on because possible occurrence of an earthquake has become a major concern. Besides, the modelling enables readers to further understand the powerhouse structure integrity under different seismic responses. Consequently, with the help of a good seismic model simulation, the potential of the powerhouse system critical section can be analyzed based on seismic response. Furthermore, the research results can provide guidance for those interested in maintaining and improving the Murum Powerhouse facilities, specifically the dam powerhouse structure under seismic events [1].
Seismic response to structural components of the Murum Powerhouse were analyzed before the seismic load was induced [1], [14], [15], [16]. Based on past seismic events, the seismic hazard has posed a great threat towards the dam body and its appurtenant structure. According to the EIA report, residual risks of seismic activities in the area may destabilize construction materials, which makes the Murum Powerhouse vulnerable to collapse. Therefore, any realistic mitigation plan is not applicable when this happens. Besides, the Murum Powerhouse plays a major role in electricity coverage in Sarawak, especially in rural areas. Failure of the dam powerhouse to operate in an earthquake has a socio-economic impact for both the country and the state [15], [16], [17], [18]. The earthquake might also cause hazards to the life of its occupants, because the structure fails to withstand the impact of floods, damming landslides, rock mass movements and large displacement from ground motion. This is a major concern, which shows that appurtenant structures are also vulnerable to the earthquake consequences [18], [19], [20], [21], [22]. Hence, seismic analysis is very important in accessing seismic performance of the powerhouse structure, thus enabling the authorities to incorporate seismic load into the powerhouse design.
This study aimed to investigate and analyze the structural response of the Murum Powerhouse to seismic load using the finite element modeling software ABAQUS, which was related to the hypothesis of this study, which was to find the critical section and failure mode of the Murum Powerhouse. Dynamic time-history analysis was made to evaluate the seismic capacity of the powerhouse structure under different seismic loads, and the earthquake time history was taken from the Eregli station in the Kocaeli earthquake in Turkey. The scope of the study included the analysis of acceleration, displacement, and principal stress response of the Murum Powerhouse structure. The analysis results suggested that the structure was likely to experience structural failure in an earthquake with 0.3g PGA and above. Additionally, the powerhouse model only passed the allowable displacement of 0.1g and 0.2g PGAs required by UBC97. These findings highlighted the need for design and construction improvements in the structure to enhance its seismic resilience. Further recommendations were made in the study, such as refining parameters, specifying existing concrete and steel bars, considering different seismic loads and soil types, and identifying critical sections of the structure requiring attention, in order to enhance the seismic capacity of the Murum Powerhouse and ensure its ability to withstand earthquake forces, thus ensuring reliable and safe electricity generation.
2. Methodology
In this particular study, the researchers gathered data from various sources to analyze the seismic response of the Murum Powerhouse. The primary source of information was the EIA (Environmental Impact Assessment) Report, which provided valuable details regarding the structure layout and dimensions of the Murum Powerhouse.
To accurately simulate the seismic conditions, the researchers obtained seismic loads with different peak accelerations from the Eregli Sap Station in Kocaeli Earthquake. These seismic loads were then utilized as boundary conditions in the finite element analysis model, which aimed to evaluate the structural response of the Murum Powerhouse under different seismic scenarios.
Developing an appropriate model required gathering several significant data points related to the Murum Powerhouse. These data points included information on the structure's dimensions, layout, and other relevant parameters. The researchers then employed the finite element analysis technique to simulate the seismic response of the powerhouse using the collected data.
To visualize the overall methodology employed in this study, the researchers presented a flowchart in Figure 2. The flowchart outlined the sequential steps involved in the research process, providing a visual representation of how the data collection, model development, and seismic response analysis were carried out. The flowchart likely depicted the progression of the study, highlighting the systematic approach followed by the researchers.
Material | Properties | Value |
Concrete | Density (kg/m3) | 2500 |
Young’s Modulus (N/m2) | 3.5 ×10¹⁰ | |
Poisson’s ratio | 0.2 | |
Compressive strength (N/mm2/MPa) | 35 | |
Tensile property (N/mm2/MPa) | 3.5 |
Figure 3 is a picture of the Murum Powerhouse. As a numerical analysis method, finite element modelling is used to acquire approximate solutions to wide-ranging concerns in the engineering field. A finite element model of a problem gives the governing equations in differential or integral form in a piecewise approximation manner. The model of the assembled powerhouse is shown in subgraph (a) and (b) of Figure 4. The properties, which are needed to be defined and input into the ABAQUS, are shown in Table 1, Table 2 and Table 3.
Plasticity parameter | Value used in the model |
Viscosity | 0.0058 |
Shape factor $(K c)$ | 0.667 |
Dilation angle $(\psi)$ | $35^{\circ}$ |
Eccentricity $(\varepsilon)$ | 0.1 |
Stress ratio $(\sigma \mathrm{bo} / \sigma c o)$ | 1.16 |
Figure 5 shows the input earthquake time history in Kocaeli earthquake. Figure 6 shows the stress-strain curve of steel.
3. Result and Discussion
The critical part with the maximum acceleration response is at the lower front side of the structure in Figure 7. It was found that the peak acceleration values concerning various PGA values occurred at the same time as the peak values of seismic acceleration data, demonstrating that the largest structural acceleration occurred during the peak earthquake acceleration shown in Figure 8. In other words, the structure experienced varying acceleration levels at different points during an earthquake. However, the critical part of the structure located at the lower front side experienced the highest acceleration, which occurred at the same time as the peak acceleration of the earthquake, indicating that the critical part of the structure was particularly vulnerable to earthquake forces and required special attention in terms of design and construction.
Overall, the findings of the analysis suggested that the Murum Powerhouse structure needed to be improved, thus enhancing its seismic capacity and ensuring its ability to withstand earthquake forces, particularly the critical sections. But based on the seismic conditions of Malaysia, we can say that the Murum dam is stable.
The displacement analysis results also corresponded with increasing displacement values caused by increasing PGA values applied on the powerhouse model shown in Figure 9. According to Table 3, the maximum displacements caused by PGAs of 0.1g, 0.2g, 0.3g, 0.5g and 0.8g are 3.17mm, 12.62mm, 43.88mm, 234.66mm and 834.54mm, respectively. In the real scenario, this value could have caused major damage and cracking to the powerhouse structures, especially 0.8g PGA. Based on previous research, Kyriakides et al. [23] investigated the effects of various PGAs ranging from 0.05g to 0.4g and tested their findings on a full-scale RC frame. The displacements of 29.5mm, 82mm and 172mm were obtained from the PGAs of 0.10g, 0.20g and 0.30g. For PGAs ranging from 0.05g to 0.1g, no visible damage was observed. But for PGAs of 0.2g and 0.3g, the RC frame suffered diagonal and horizontal cracking. Hence, by comparing the previous research and the ABAQUS model in this study, it clearly showed that the powerhouse structure may crack in an earthquake based on the computed displacement results.
Displacement (mm) | ||||
0.1g | 0.2g | 0.3g | 0.5g | 0.8g |
3.17mm | 12.62mm | 43.88mm | 234.66mm | 834.54mm |
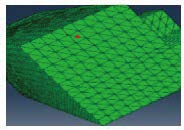 |  |  | 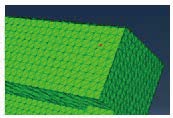 | 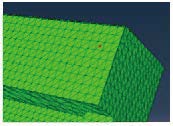 |
According to the UBC97, the allowable displacement of the powerhouse model was 22.5mm in Z-direction (axis of the major earthquake applied in the Murum powerhouse model). The computed results of this study using the ABAQUS software showed that PGAs of 0.1g and 0.2g caused displacements of only 3.16mm and 12.62mm, indicating that the powerhouse model passed the maximum displacement. For 0.2g PGA and above, the displacement requirement was not met, indicating the structure may have a high risk of failure due to the PGA response. In this analysis, the displacement of 43.88mm, which occurred at ground motion of 0.3g, was considered excessive especially for a large structure like the powerhouse. The analysis gave an insight that high displacement value was located at the upper structure of the powerhouse model. For example, the machine hall area was the tallest part in the model, and its displacement response was 43.88mm with 0.3g PGA, which exceeded the allowable displacement, as shown in Figure 9.
Figure 10 compares the displacement of the top part and that of the bottom part in the model. Excessive displacement resulting from ground motion could cause the powerhouse parts and components to cease to function, leading to system failure. It was inferred that the displacement response would not cause the machine hall area to crack at ground motion of 0.3g and above if there were 4 Francis-type turbines placed inside the area. This analysis was very crucial because the turbine played an important role for transmission mechanism and its dynamic load was initially responsible for creating vibration in the powerhouse structure. Apart from natural causes like earthquakes, this added another stress, leading to excessive displacement of the structure caused by the ground motion. In subgraph (a) and (b) Figure 11 show the displacement locations.
According to the simulation analysis, the maximum stress and strain results with different PGAs are shown in Table 4. All the results obtained were based on the critical nodes of the rebar at the lower front structure in the model with the maximum stress, as shown in Figure 12.
PGA | Stress (MPa) | Strain |
$0.1 \mathrm{~g}$ | 0.472 | $1.789 \mathrm{E}-04$ |
$0.2 \mathrm{~g}$ | 0.785 | $2.267 \mathrm{E}-04$ |
$0.3 \mathrm{~g}$ | 3.981 | $2.253 \mathrm{E}-03$ |
$0.5 \mathrm{~g}$ | 12.733 | $1.121 \mathrm{E}-01$ |
$0.8 \mathrm{~g}$ | 19.692 | $3.218 \mathrm{E}-01$ |
The most vulnerable location with the maximum stress was at the bottom part of the structure when a major earthquake was applied. Based on the results in Table 4, the highest stress and strain recorded with the highest PGA also followed the trend of this study concerning the ground motion’s PGA. The powerhouse model experienced the highest principal stress value of 19.692MPa with the ground motion of 0.8g PGA. In terms of material strength, the ultimate concrete strength under compression was 35MPa, showing that the powerhouse model did not fail. However, in terms of concrete tension property, the maximum principal stress value exceeded 3.5MPa, showing that the concrete structure had high strain in tension motion. In fact, the value was 3.981MPa at 0.3g ground motion, which exceeded the concrete tension property. Hence, the analysis results showed that the concrete structure had considerable deformation before total failure. The stress results obtained were related to the structure displacement. Under 0.3g ground motion in an earthquake, the structure experienced tensile stress, which caused the structure displacement to widen and then may cause cracking and failure. Figure 13 compares the stress time with different PGAs.
However, in terms of concrete compression property, none of the analysis results exceeded the ultimate strength of 35MPa, showing that the structure still withstood compression resulting from the load imposed by an earthquake, because additional restraints of the concrete reinforced with steel bars reduced the stress imposed on the powerhouse structure. In general terms, concrete was strong under compression whilst weak under tension. By reinforcing the concrete with steel bars, the resultant composite material had much more strength under tension, and exceeded the tensile stress limit at 0.3g. Although the reinforced concrete was able to resist any excessive bending or stretching, this could lead to severe concrete cracking in the powerhouse structure. Hence, the failure risk was relatively low if the concrete structure had a considerable value of the maximum stress.
4. Conclusion
To sum up, it was found that the critical section of the Murum Powerhouse model showed large displacement response at ground motion of 0.3g PGA and above. Acceleration, displacement and principal stress response were interrelated with each other, which significantly contributed to structural failure in the computed Murum Powerhouse model. The acceleration value or response of the model did not show a sudden spike, because the value did not exceed the PGA of the input ground motion. In addition, the acceleration response of the powerhouse model showed similar pattern in peak time to the earthquake time history used in this study. Based on the spectral acceleration response analysis of the model, the highest acceleration response occurred at a vibration period of 2.5 to 4 seconds recorded with a magnitude of 0.6g. The Murum Powerhouse is seismically vulnerable because the Miri Earthquake occurred 176km away, with 5.2 on the Richter scale, which showed potential considerable seismic hazard near the site causing significant damage to the powerhouse structure. Knowing that the powerhouse model was not expected to fail in terms of material strength, another failure mode was investigated (at 0.3g and above), which involved sliding displacement at the machine hall area and turbine section. The following were the recommendations for further accuracy and quality improvement of the results computed for this project:
First, exact technical drawings and specifications should be used for this modelling.
Second, existing concrete and reinforcement bars specifications should be included in the model analysis.
Third, different earthquake records and soil types can be used in this analysis to know the response of the facility under different conditions.
Fourth, future research can be done on the critical section with refined parameters to determine detailed response under seismic load.
The data used to support the findings of this study are available from the corresponding author upon request.
The authors declare that they have no conflicts of interest.